blog
Tips for Delivering MySQL Database Performance – Part One

The database backend affects the application, which can then impact organizational performance. When this happens, those in charge tend to want a quick fix. There are many different roads to improve performance in MySQL. As a very popular choice for many organizations, it’s pretty common to find a MySQL installation with the default configuration. This might not, however, be appropriate for your workload and setup needs.
In this blog, we will help you to better understand your database workload and the things that may cause harm to it. Knowledge of how to use limited resources is essential for anyone managing the database, especially if you run your production system on MySQL DB.
To ensure that the database performs as expected, we will start with the free MySQL monitoring tools. We will then look at the related MySQL parameters you can tweak to improve the database instance. We will also take a look at indexing as a factor in database performance management.
To be able to achieve optimal usage of hardware resources, we’ll take a look into kernel optimization and other crucial OS settings. Finally, we will look into trendy setups based on MySQL Replication and how it can be examined in terms of performance lag.
Identifying MySQL Performance Issues
This analysis helps you to understand the health and performance of your database better. The tools listed below can help to capture and understand every transaction, letting you stay on top of its performance and resource consumption.
PMM (Percona Monitoring and Management)
Percona Monitoring and Management tool is an open-source collection of tools dedicated to MySQL, MongoDB, and MariaDB databases (on-premise or in the cloud). PPM is free to use, and it’s based on the well known Grafana and Prometheus time series DB. It Provides a thorough time-based analysis for MySQL. It offers preconfigured dashboards that help to understand your database workload.
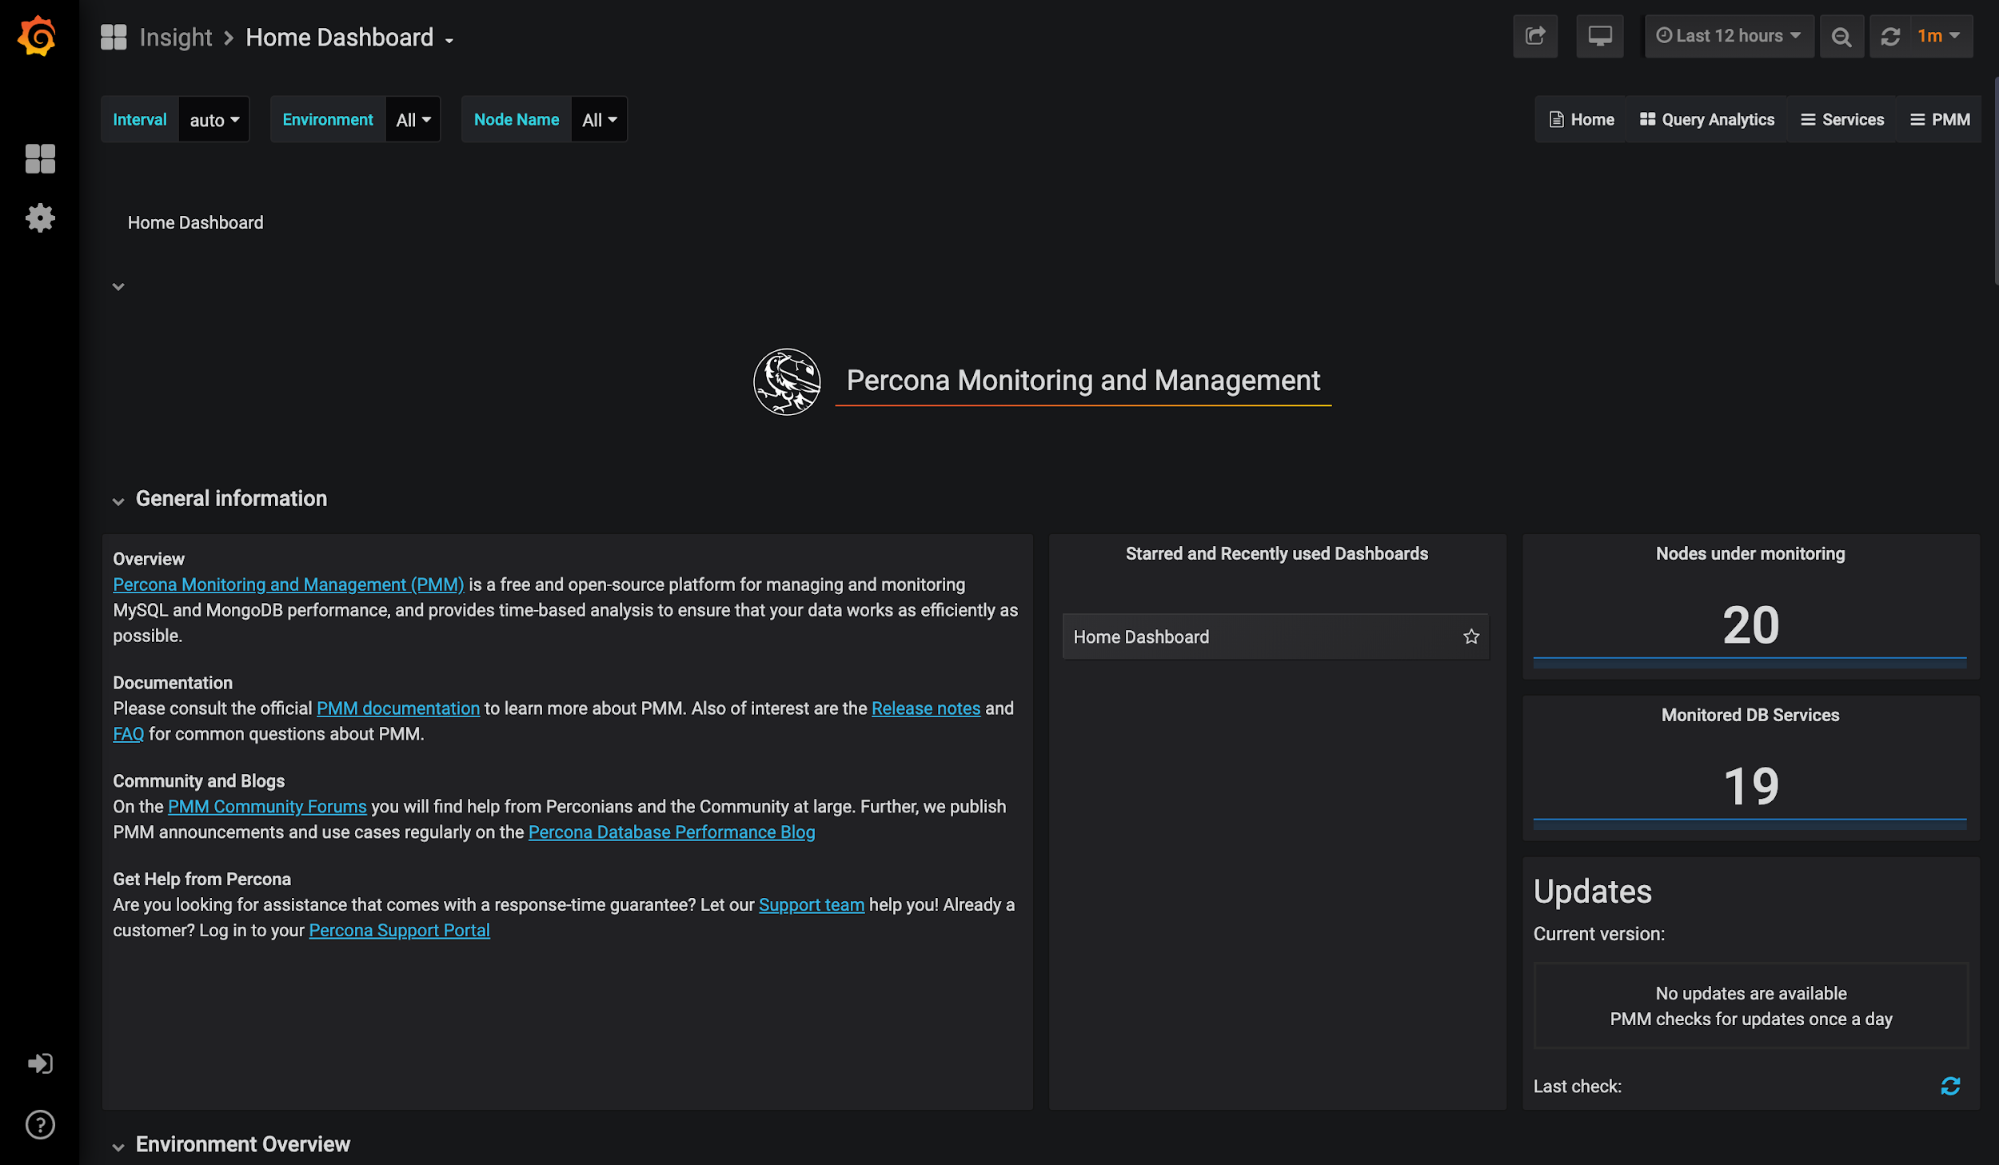
PMM uses a client/server model. You’ll have to download and install both the client and the server. For the server, you can use Docker Container. It’s as easy as pulling the PMM server docker image, creating a container, and launching PMM.
Pull PMM Server Image
docker pull percona/pmm-server:2

2: Pulling from percona/pmm-server

ab5ef0e58194: Downloading  2.141MB/75.78MB

cbbdeab9a179: Downloading  2.668MB/400.5MB
Create PMM Container
docker create

   -v /srv

   --name pmm-data

   percona/pmm-server:2 /bin/true
Run Container
docker run -d

   -p 80:80

   -p 443:443

   --volumes-from pmm-data

   --name pmm-server

   --restart always

   percona/pmm-server:2
You can also check how it looks without an installation. A demo of PMM is available here.
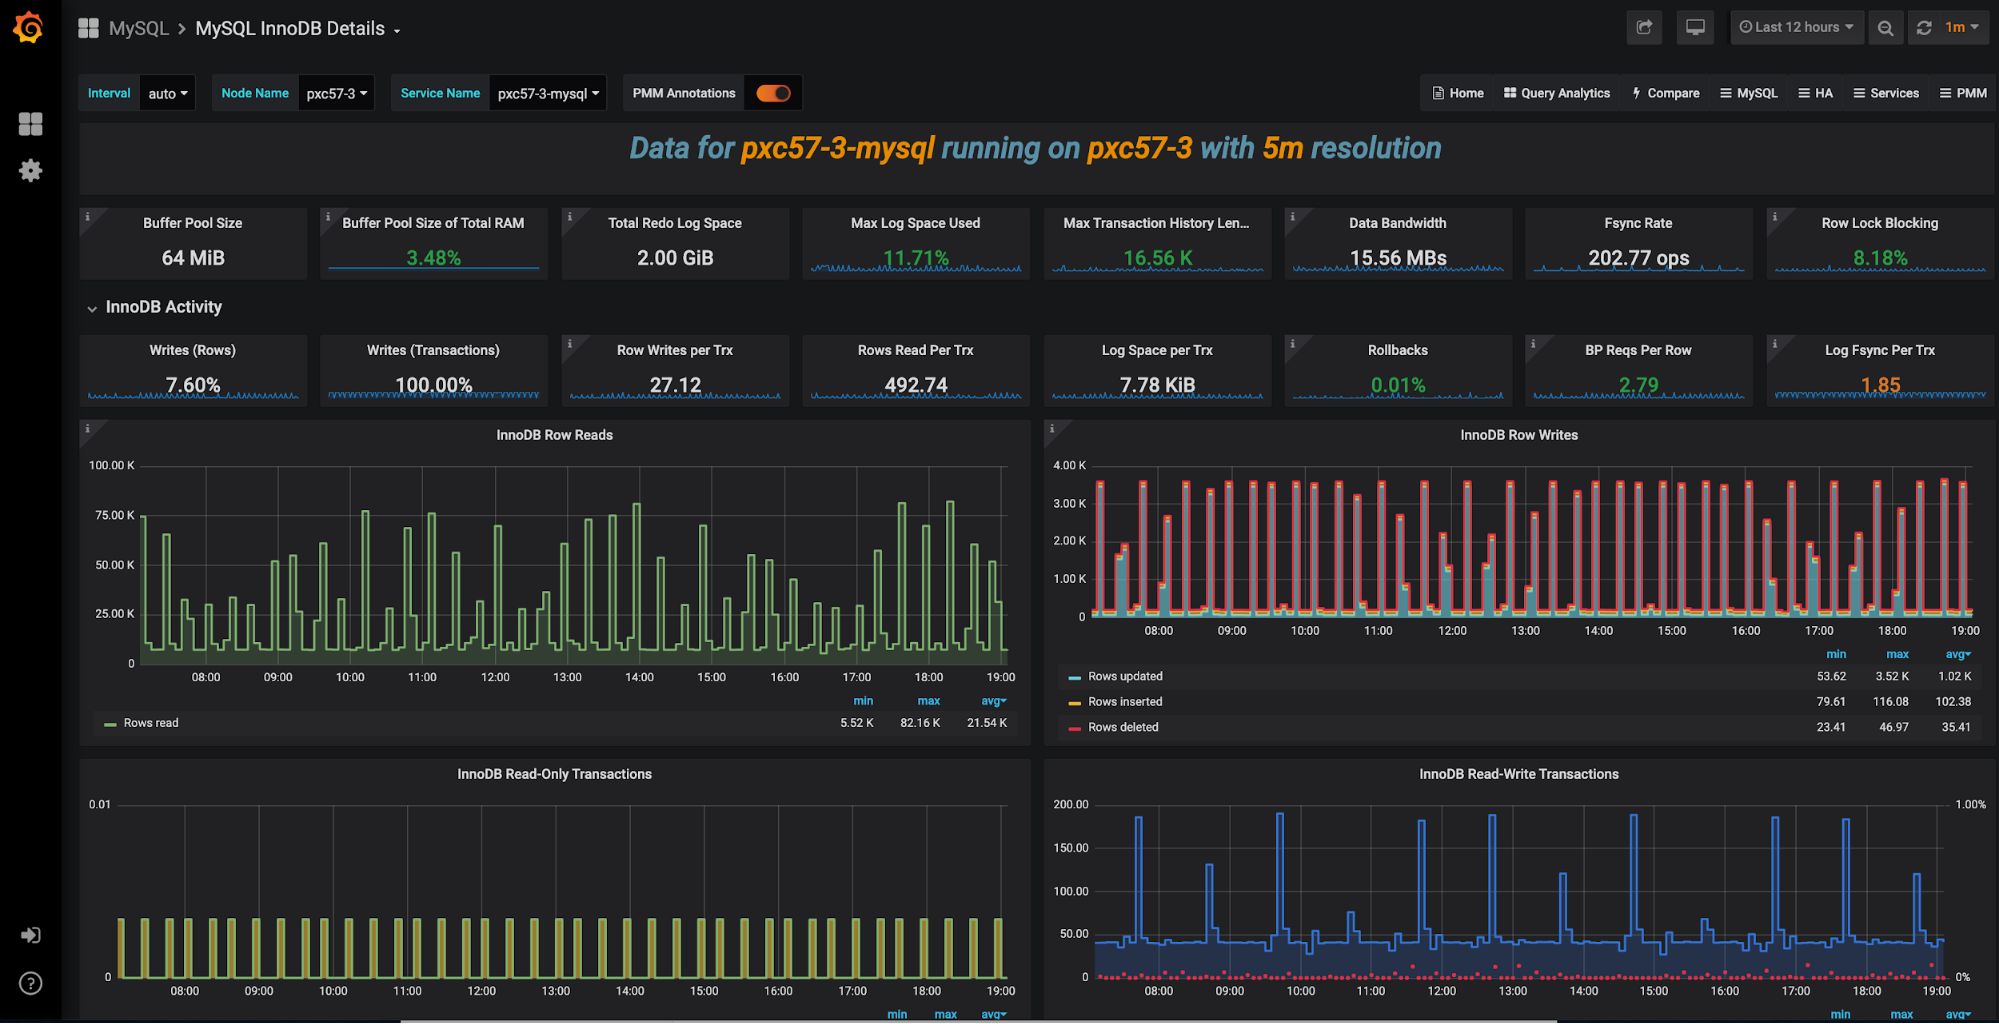
Another tool that is part of PMM tools set is Query Analytics (QAN). QAN tool stays on top of the execution time of queries. You can even get details of SQL queries. It also gives a historical view of the different parameters that are critical for the optimal performance of a MySQL Database Server. This often helps to understand if any changes in the code could harm your performance. For example, a new code was introduced without your knowledge. A simple use would be to display current SQL queries and highlight issues to help you improve the performance of your database.
PMM offers point-in-time and historical visibility of MySQL database performance. Dashboards can be customized to meet your specific requirements. You can even expand a particular panel to find the information you want about a past event.
Free Database Monitoring with ClusterControl
ClusterControl provides real-time monitoring of the entire database infrastructure. It supports various database systems starting with MySQL, MariaDB, PerconaDB, MySQL NDB Cluster, Galera Cluster (both Percona and MariaDB), MongoDB, PostgreSQL and TimescaleDB. The monitoring and deployment modules are free to use.
ClusterControl consists of several modules. In the free ClusterControl Community Edition we can use:
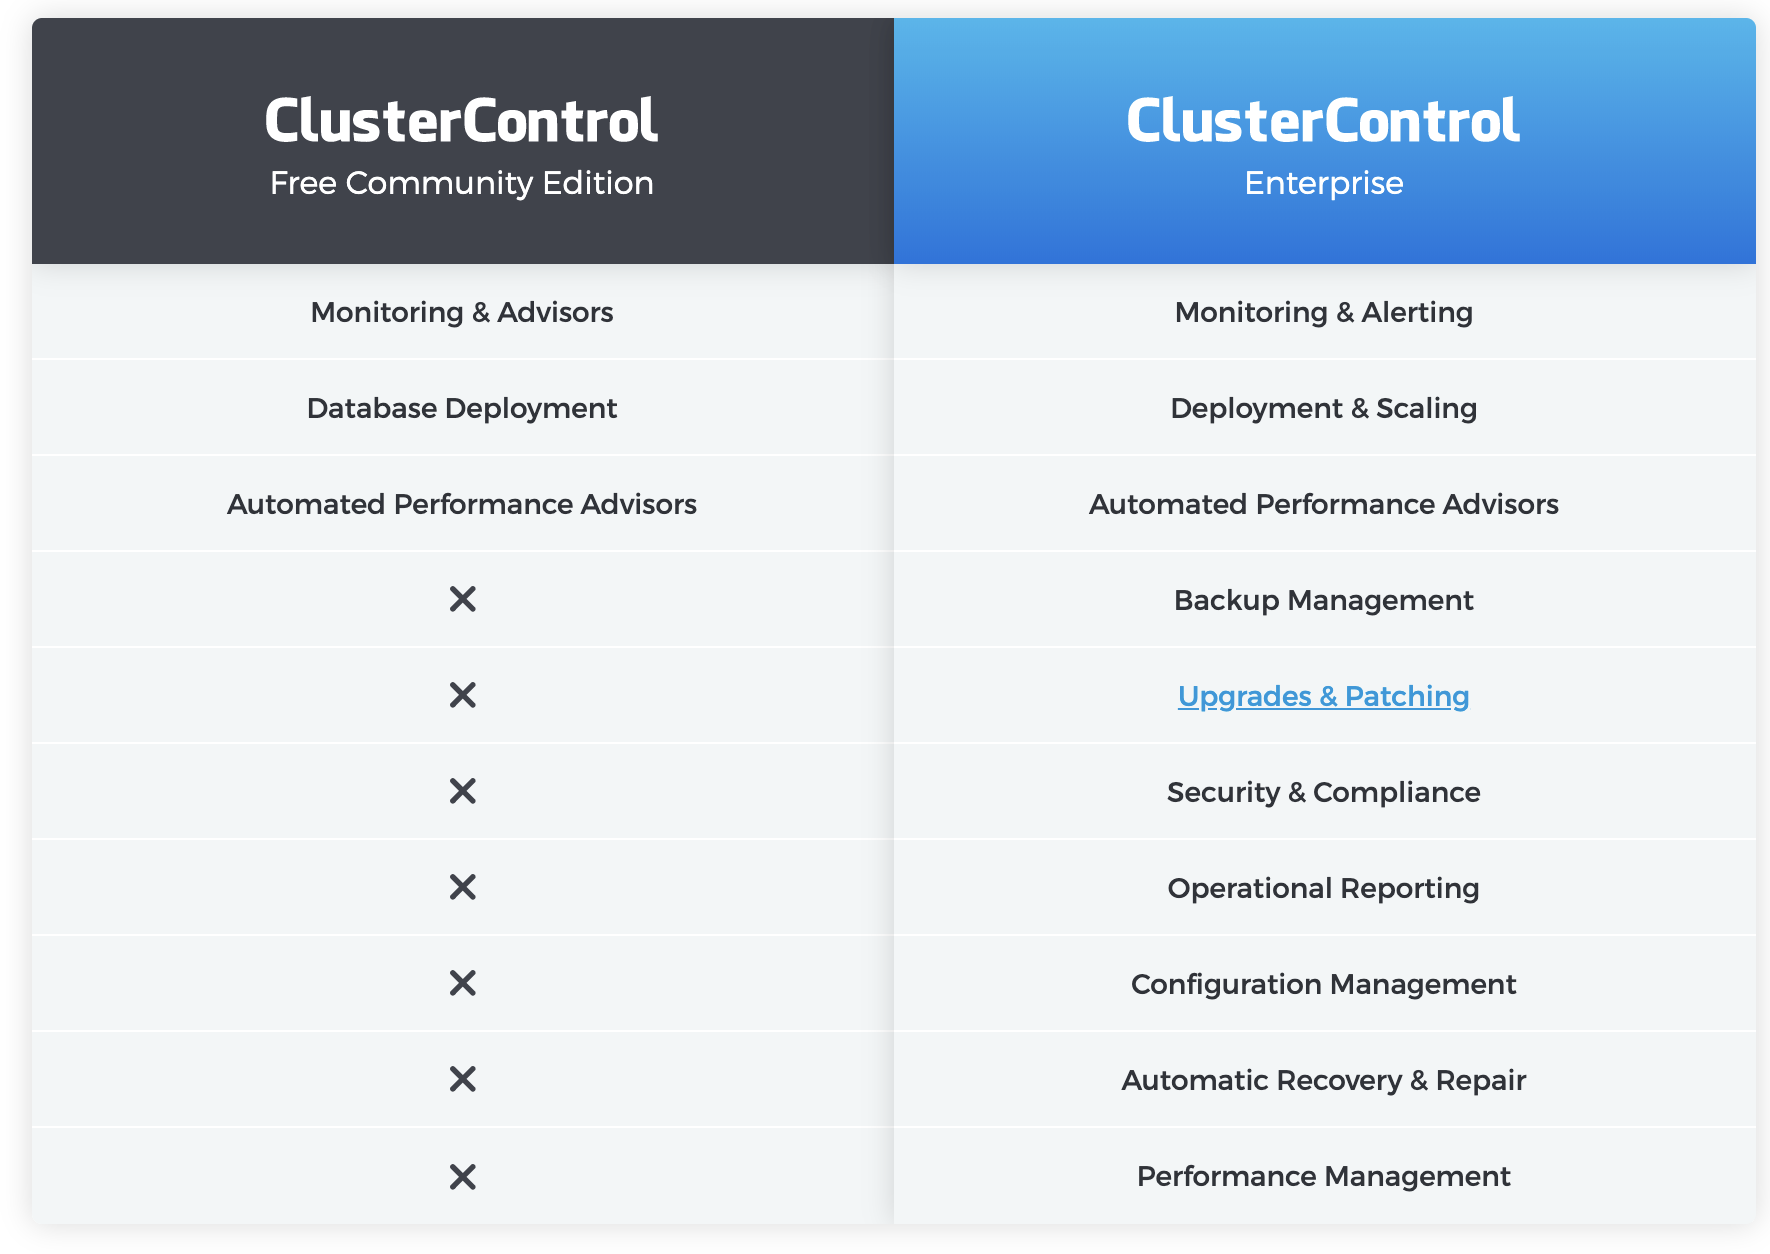
Performance advisors offer specific advice on how to address database and server issues, such as performance, security, log management, configuration, and capacity planning. Operational reports can be used to ensure compliance across hundreds of instances. However, monitoring is not management. ClusterControl has features like backup management, automated recovery/failover, deployment/scaling, rolling upgrades, security/encryption, load balancer management, and so on.
Monitoring & Advisors
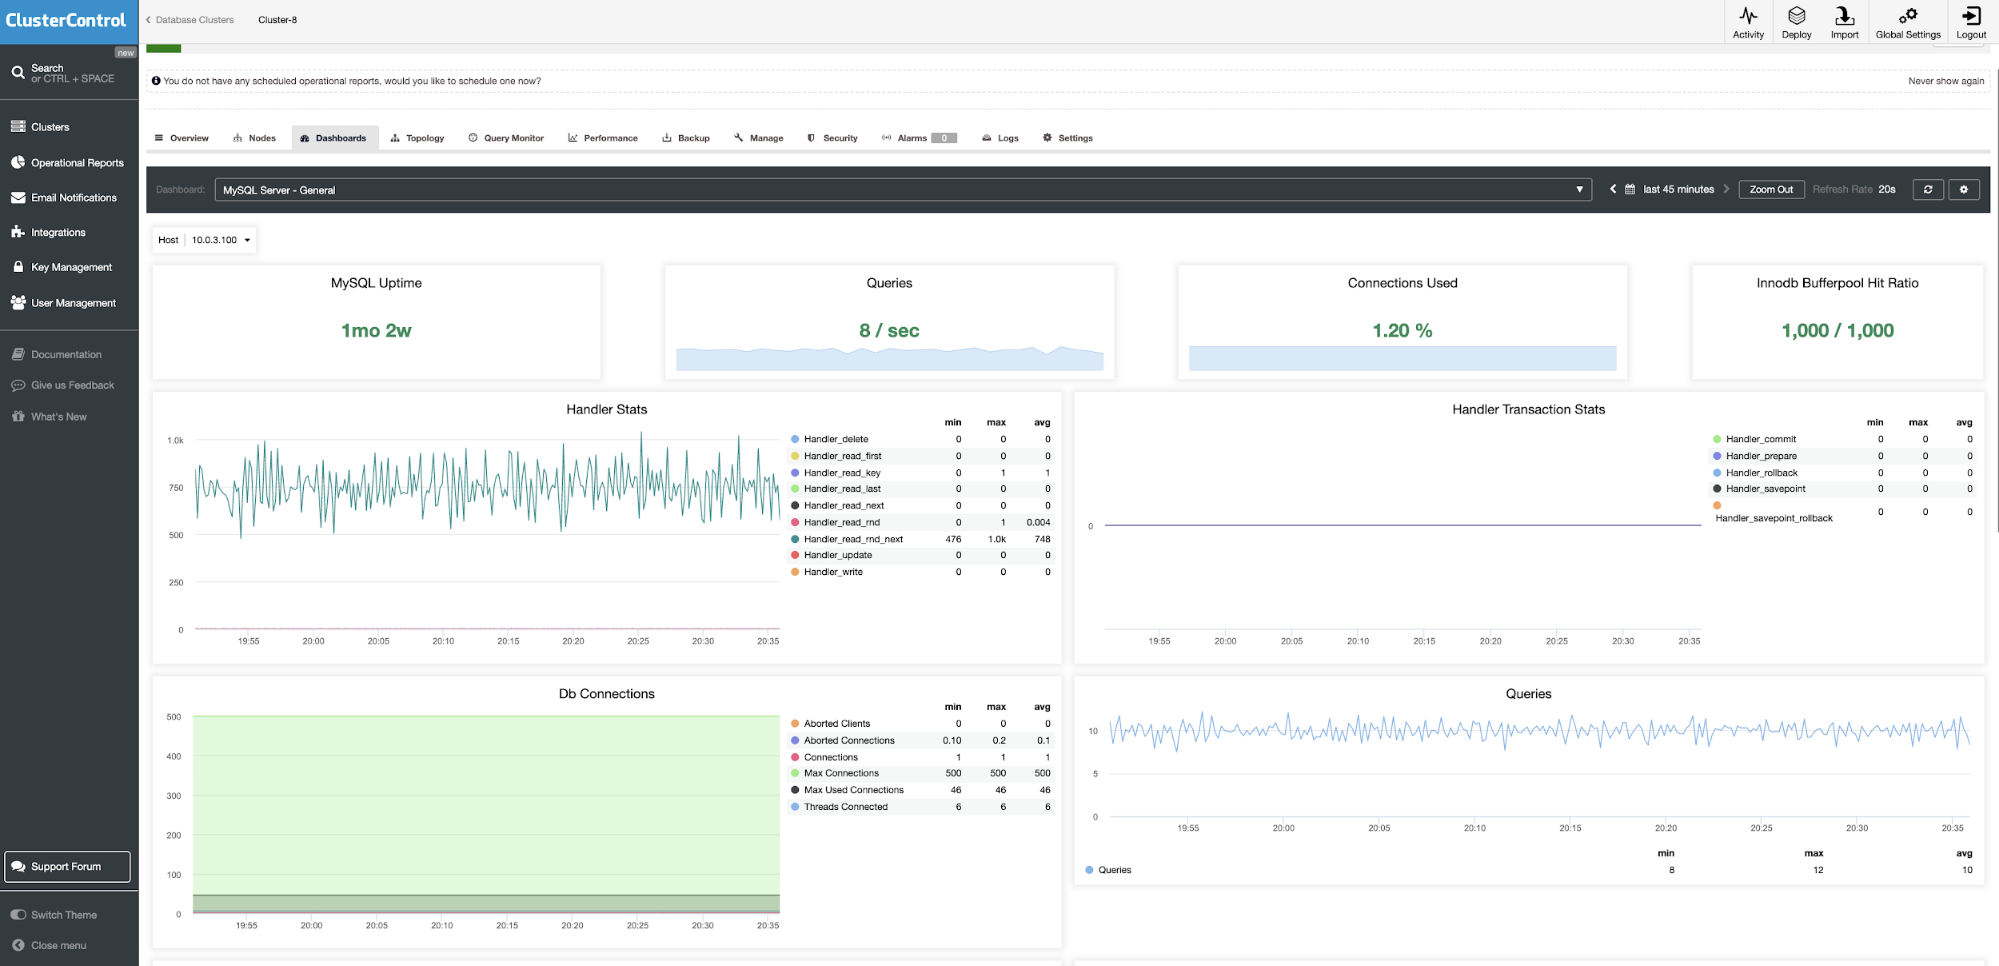
The ClusterControl Community Edition offers free database monitoring which provides a unified view of all of your deployments across data centers and lets you drill down into individual nodes. Similar to PMM we can find dashboards based on real-time data. It’s to know what is happening now, with high-resolution metrics for better accuracy, pre-configured dashboards, and a wide range of third-party notification services for alerting.
On-premises and cloud systems can be monitored and managed from one single point. Intelligent health-checks are implemented for distributed topologies, for instance, detection of network partitioning by leveraging the load balancer’s view of the database nodes.
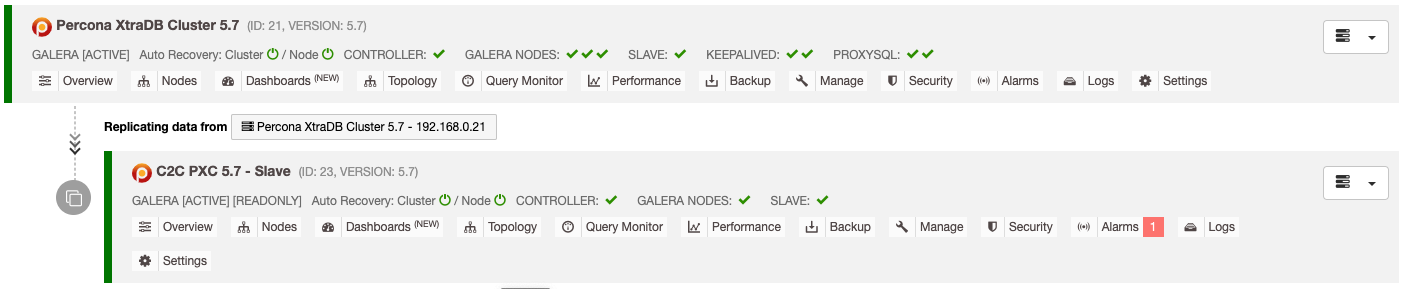
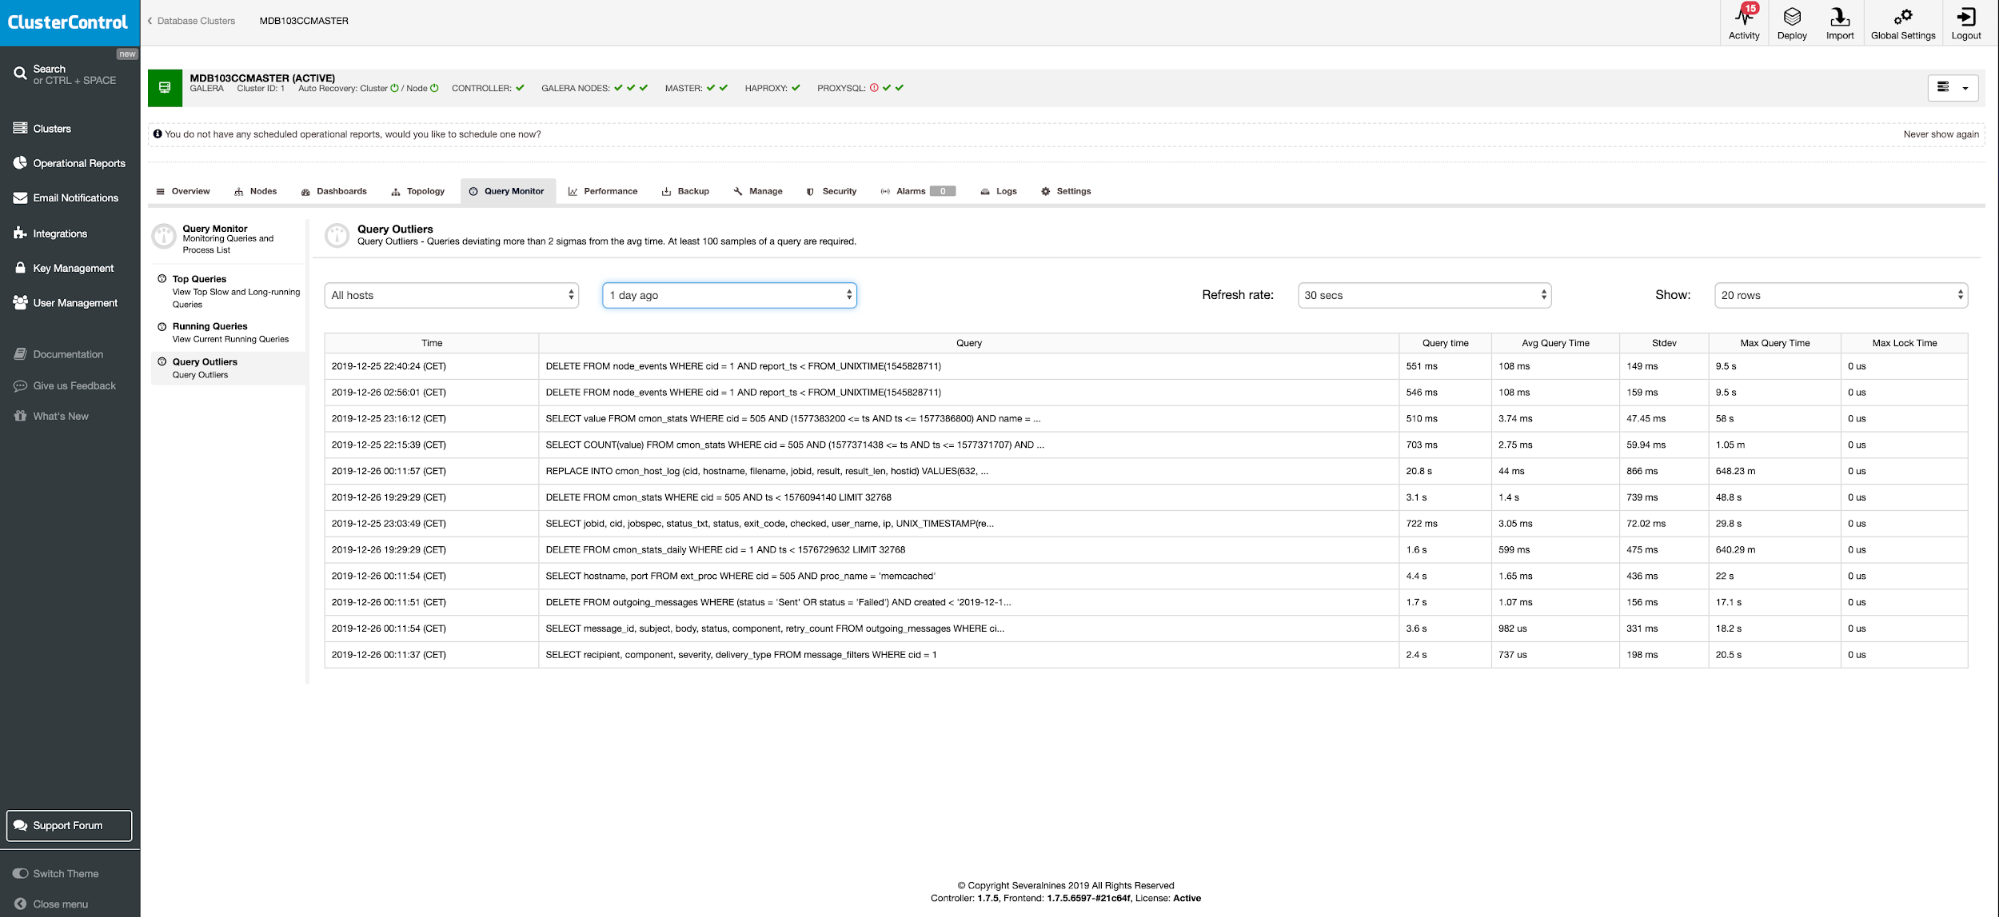
ClusterControl Workload Analytics in one of the monitoring components which can easily help you to track your database activities. It provides clarity into transactions/queries from applications. Performance exceptions are never expected, but they do occur and are easy to miss in a sea of data. Outlier discovery will get any queries that suddenly start to execute much slower than usual. It tracks the moving average and standard deviation for query execution times and detects/alerts when the difference between the value exceeds the mean by two standard deviations.
As we can see from the below picture, we were able to catch some queries that in between one day tend to change execution time on a specific time.
To install ClusterControl click here and download the installation script. The install script will take care of the necessary installation steps.
You should also check out the ClusterControl Demo to see it in action.
You can also get a docker image with ClusterControl.
$ docker pull severalnines/clustercontrolFor more information on this, follow this article.
MySQL Database Indexing
Without an index, running that same query results in a scan of every row for the needed data. Creating an index on a field in a table creates extra data structure, which is the field value, and a pointer to the record it relates to. In other words, indexing produces a shortcut, with much faster query times on expansive tables. Without an index, MySQL must begin with the first row and then read through the entire table to find the relevant rows.
Generally speaking, indexing works best on those columns that are the subject of the WHERE clauses in your commonly executed queries.
Tables can have multiple indexes. Managing indexes will inevitably require being able to list the existing indexes on a table. The syntax for viewing an index is below.
To check indexes on MySQL table run:
SHOW INDEX FROM table_name;Since indices are only used to speed up the searching for a matching field within the records, it stands to reason that indexing fields used only for output would be simply a waste of disk space. Another side effect is that indexes may extend insert or delete operations, and thus when not needed, should be avoided.
MySQL Database Swappiness
On servers where MySQL is the only service running, it’s a good practice to set vm.swapiness = 1. The default setting is set to 60 which is not appropriate for a database system.
vi /etc/sysctl.conf
vm.swappiness = 1
Transparent Huge Pages
If you are running your MySQL on RedHat, make sure that Transparent Huge Pages is disabled.
This can be checked by command:
cat /proc/sys/vm/nr_hugepages
0
(0 means that transparent huge pages are disabled.)
MySQL I/O Scheduler
In most distributions noop or deadline I/O schedulers should be enabled by default. To check it run
cat /sys/block/sdb/queue/scheduler MySQL Filesystem Options
It’s recommended to use journaled file systems like xfs, ext4 or btrfs. MySQL works fine with all that of them and the differences more likely will come with supported maximum file size.
- XFS (maximum filesystem size 8EB, maximum file size 8EB)
- XT4 (maximum filesystem size 8EB, maximum file size 16TB)
- BTRFS (maximum filesystem size 16EB, maximum file size 16EB)
The default file system settings should apply fine.
NTP Deamon
It’s a good best practice to install NTP time server demon on database servers. Use one of the following system commands.
#Red Hat
yum install ntp
#Debian
sudo apt-get install ntp
Conclusion
This is all for part one. In the next article, we will continue with MySQL variables operating systems settings and useful queries to gather database performance status.


