blog
Getting the Most Out of ClusterControl Community Edition

ClusterControl is an agentless management and monitoring system that helps to deploy, manage, monitor and scale our databases from a friendly interface. It allows us to perform, in a few seconds, database management tasks that would take us hours of work and research to do manually.
It can be easily installed in a dedicated VM or physical host using an installation script or we can consult the official documentation available on the Severalnines web site for more options.
ClusterControl comes in three versions, Community, Advanced and Enterprise.
The main features of each are the following:
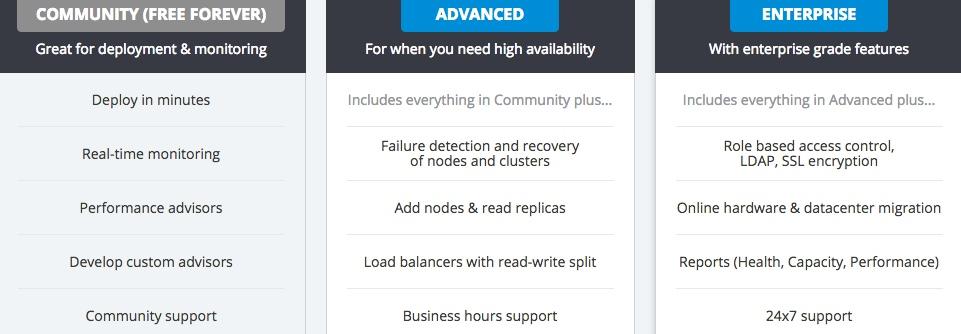
To test the system, we provide a trial period of 30 days. During that period, we can make use of all the functionalities that available in the product, such as importing our existing databases or clusters, adding load balancers, scaling with additional nodes, and automatic recovery from failures, among others.
ClusterControl has support for the top open source database technologies MySQL, MariaDB, MongoDB, PostgreSQL, Galera Cluster and more. It supports nearly two dozen database versions, that one can try on premises or in the cloud. This enables you to test which database technology, or which high availability configuration, is the most suitable for your application.
Next, let’s have a detailed look of what we can do with the Community version (after the trial period), at no cost and without time limit.
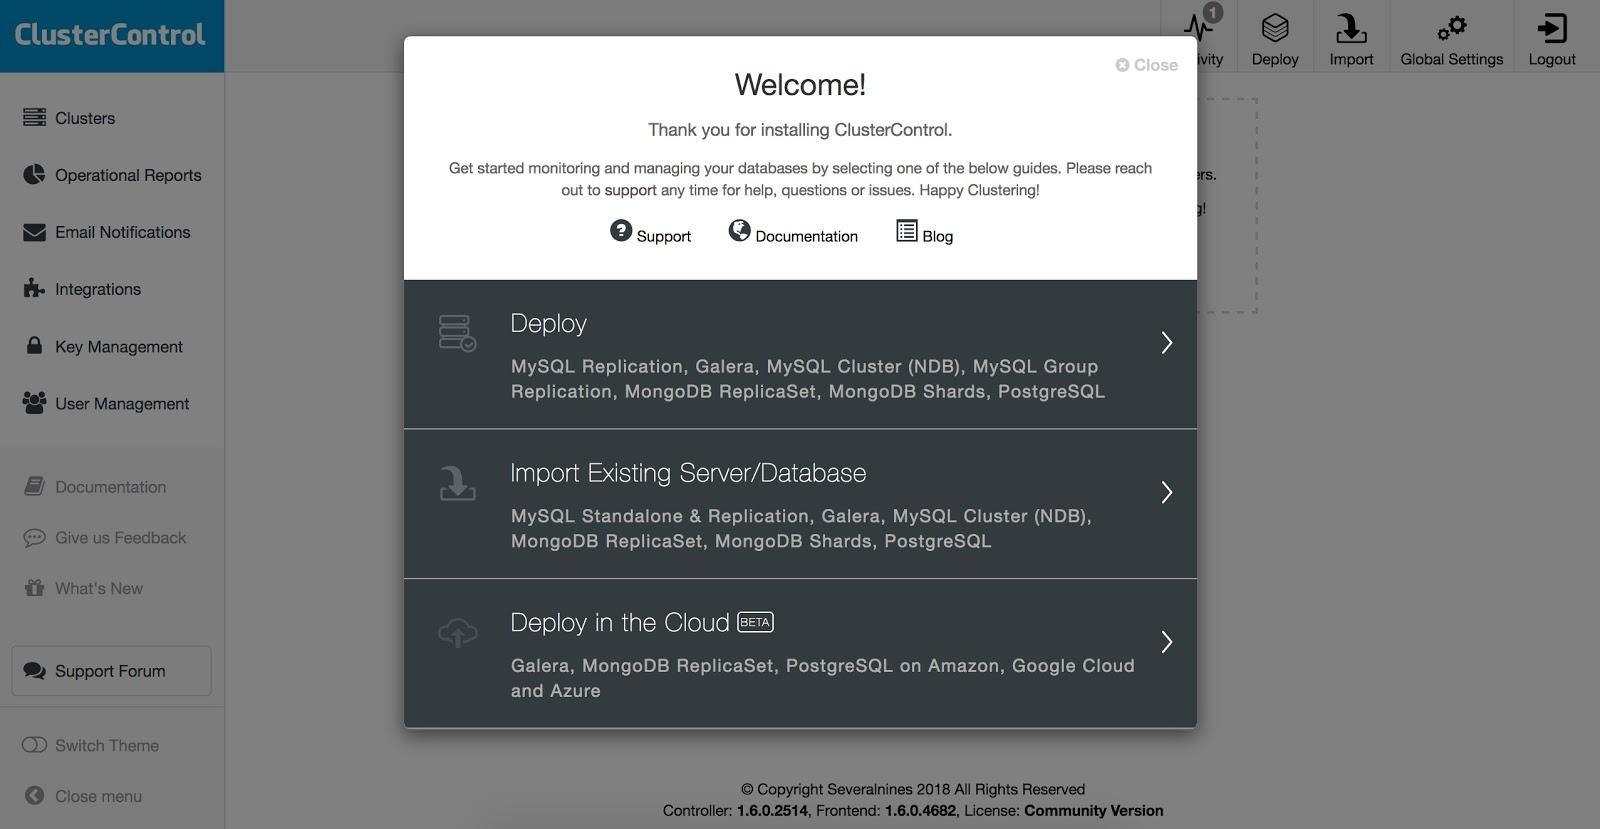
Deploy
ClusterControl allows you to deploy a number of high availability configurations in the Community Edition. To perform a deployment, simply select the option “Deploy” and follow the instructions that appear.
When selecting Deploy, we must specify User, Key or Password and port to connect by SSH to our servers. We also need the name for our new cluster and if we want ClusterControl to install the corresponding software and configurations for us.
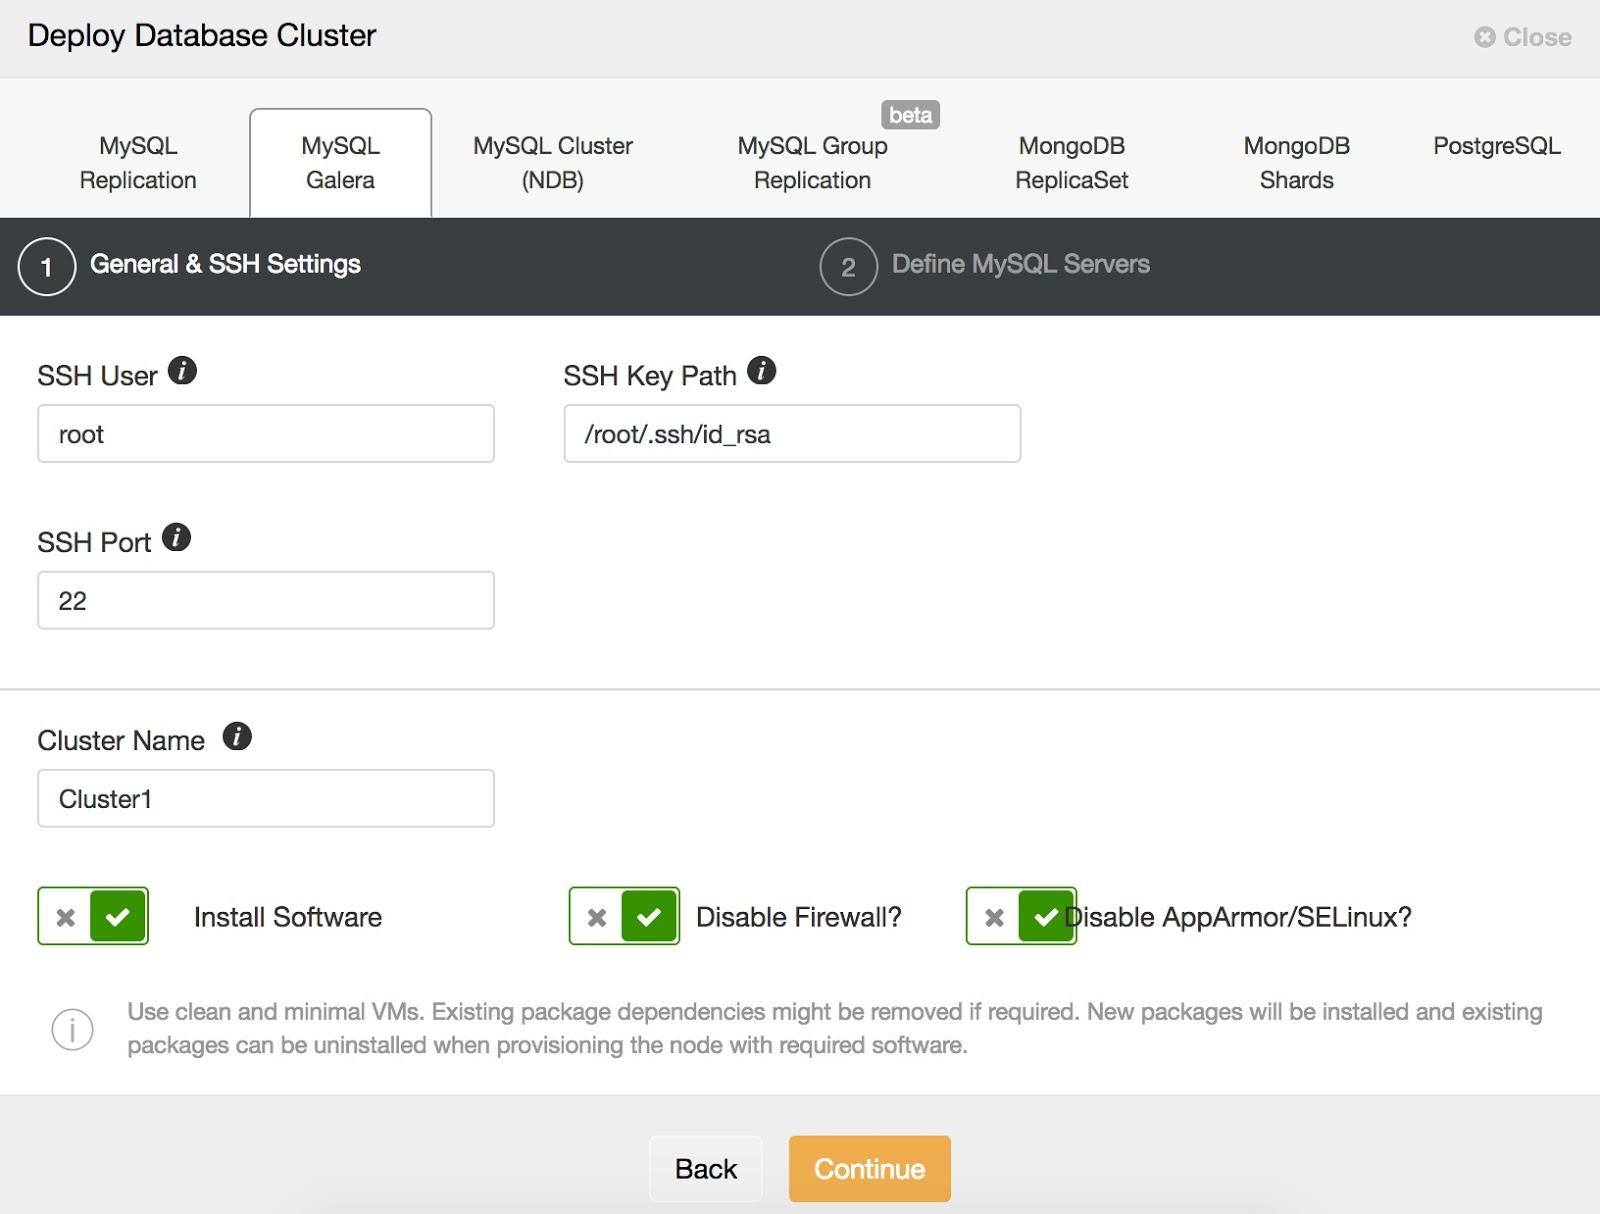
For our example we will create a Galera Cluster with 3 nodes.
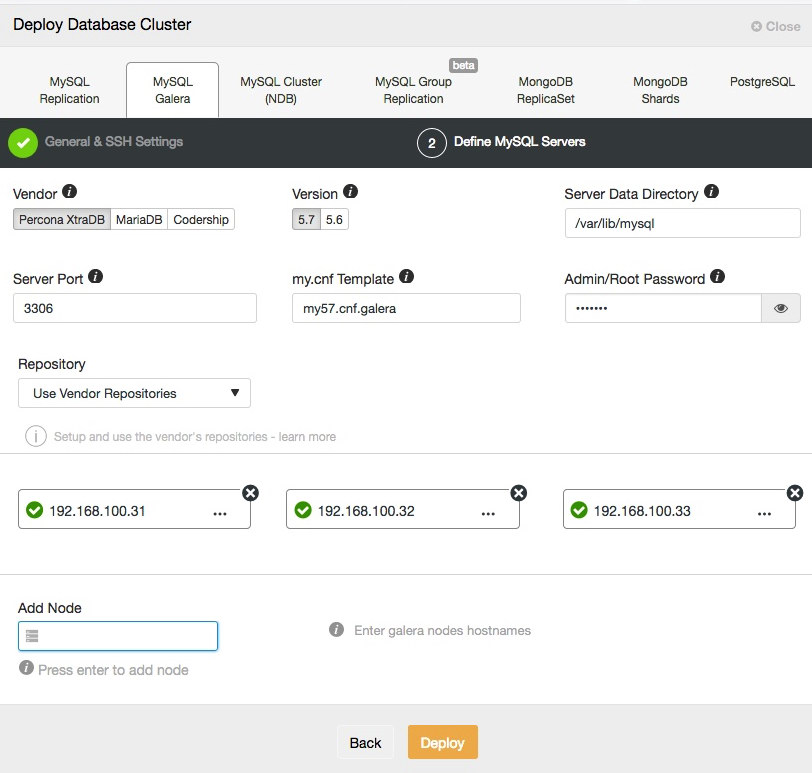
After configuring the SSH access information, we must enter the data of our database, such as Vendor, Version, data dir and access to the database.
We can also specify which repository to use and add our servers to the cluster that we are going to create.
When adding our servers, we can enter IP or hostname. For the latter, we must have a DNS server or have added our PostgreSQL servers to the local resolution file (/etc/hosts) of our ClusterControl, so it can resolve the corresponding name that you want to add.
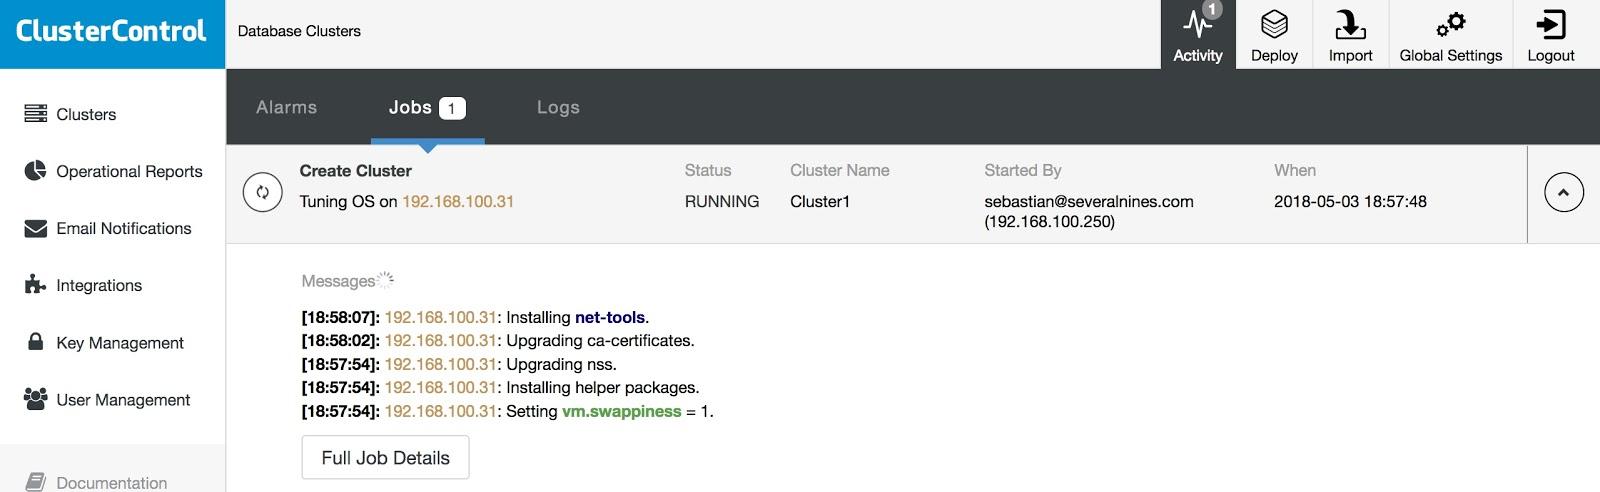
We can monitor the status of the creation of our new cluster from the ClusterControl activity monitor.
Once the task is finished, we can see our cluster in the main ClusterControl screen. Note that it is also possible to use the ClusterControl CLI for those who prefer command line.
Monitoring
ClusterControl Community Edition allows us to monitor our servers in real time. It provides us from a high-level, multi-datacenter view to a deep-dive node view. This means that we can see a unified view of all of our deployments across data centers, as well as the possibility to drill down into individual nodes as required. We will have graphs with basic host statistics, such as CPU, Network, Disk, RAM, IOPS, as well as database metrics.
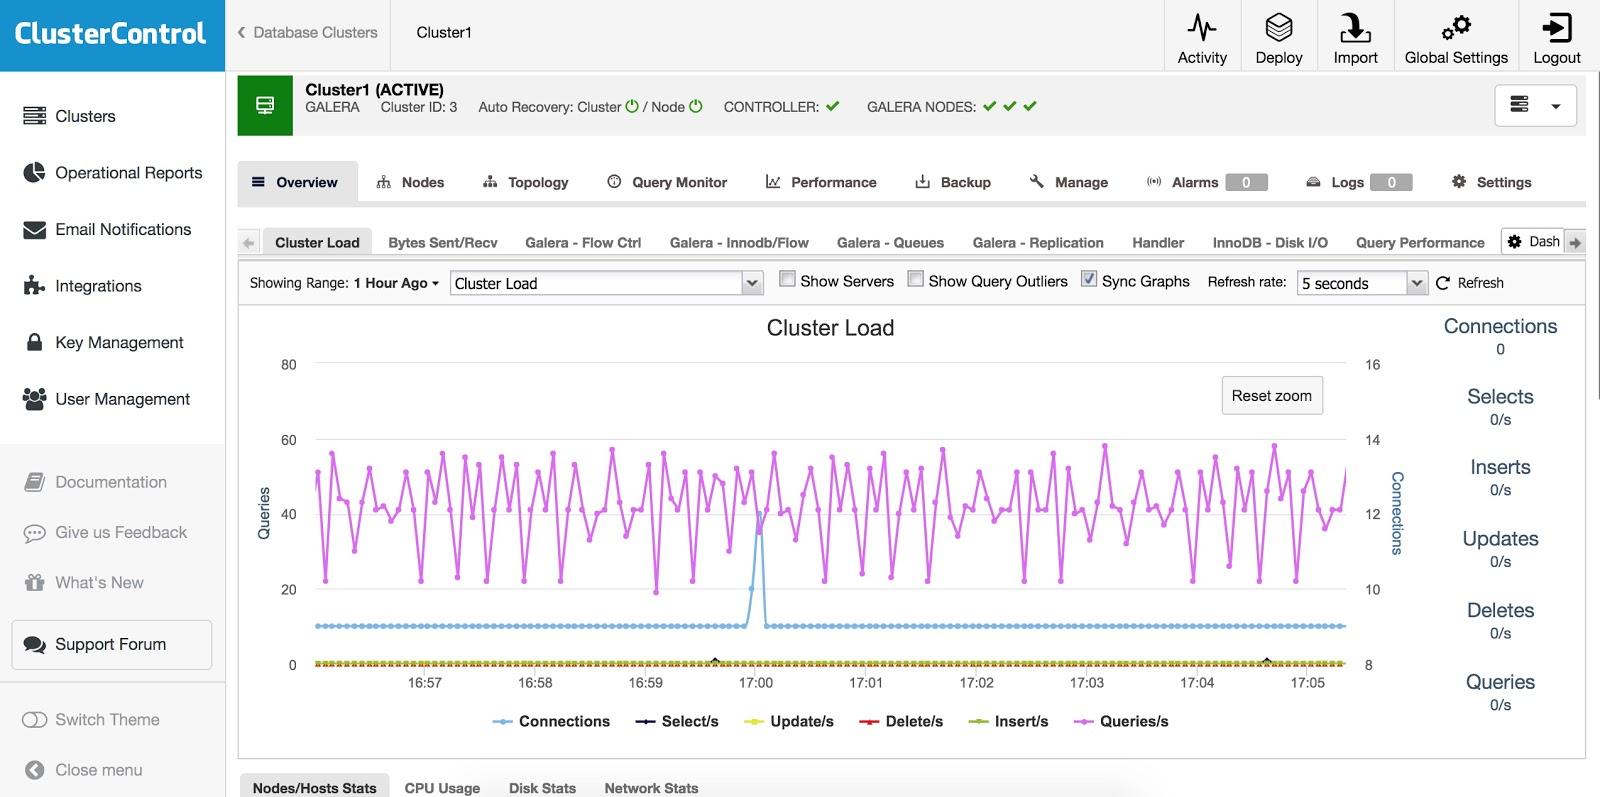
If you go to the Cluster, you can check an overview of it.
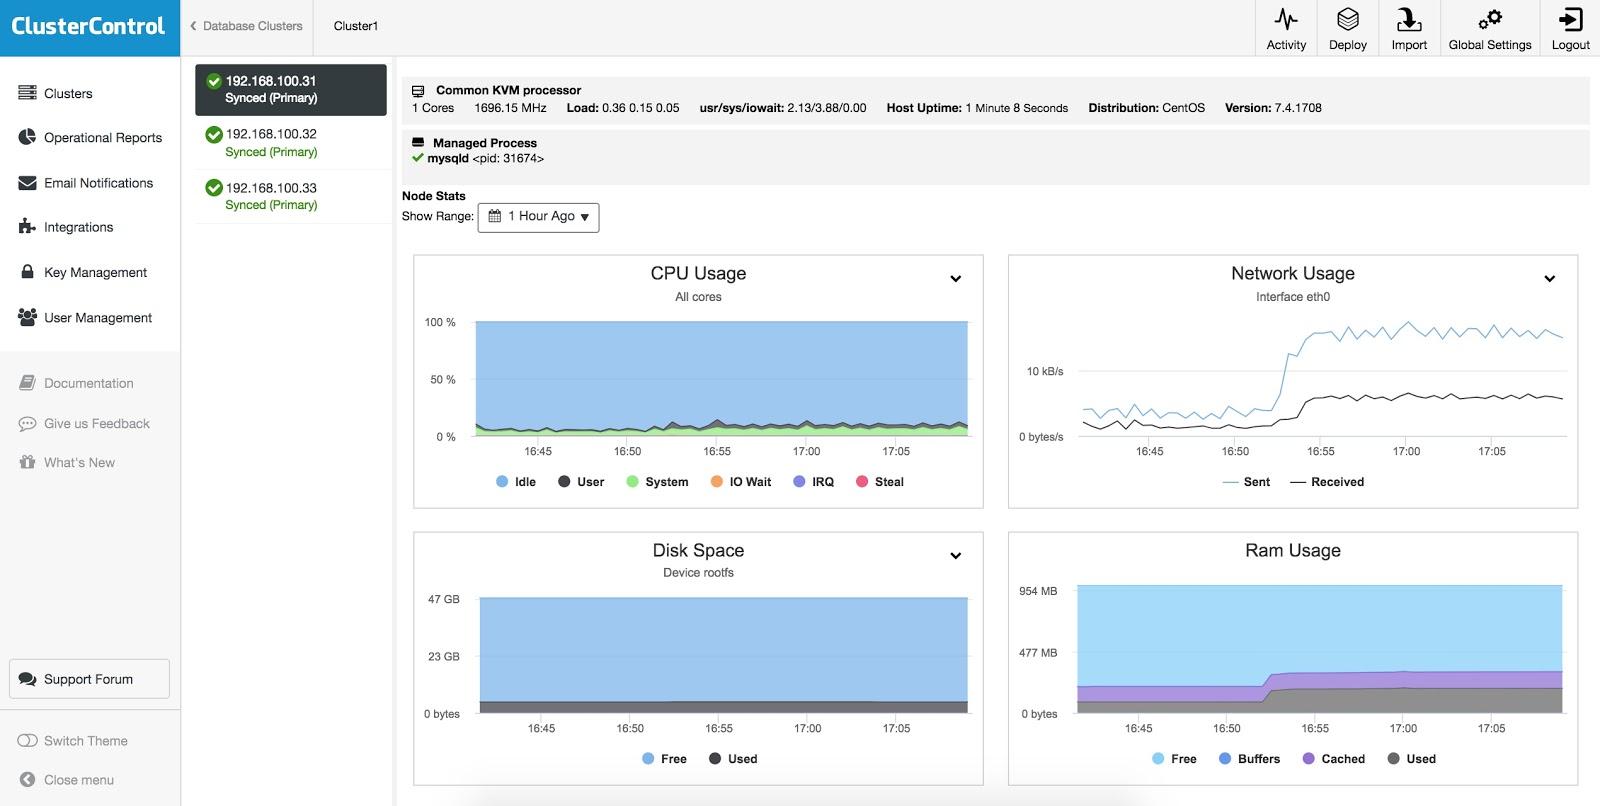
If you go to Cluster -> Nodes, you can check the status, graphs, performance, or variables of them.
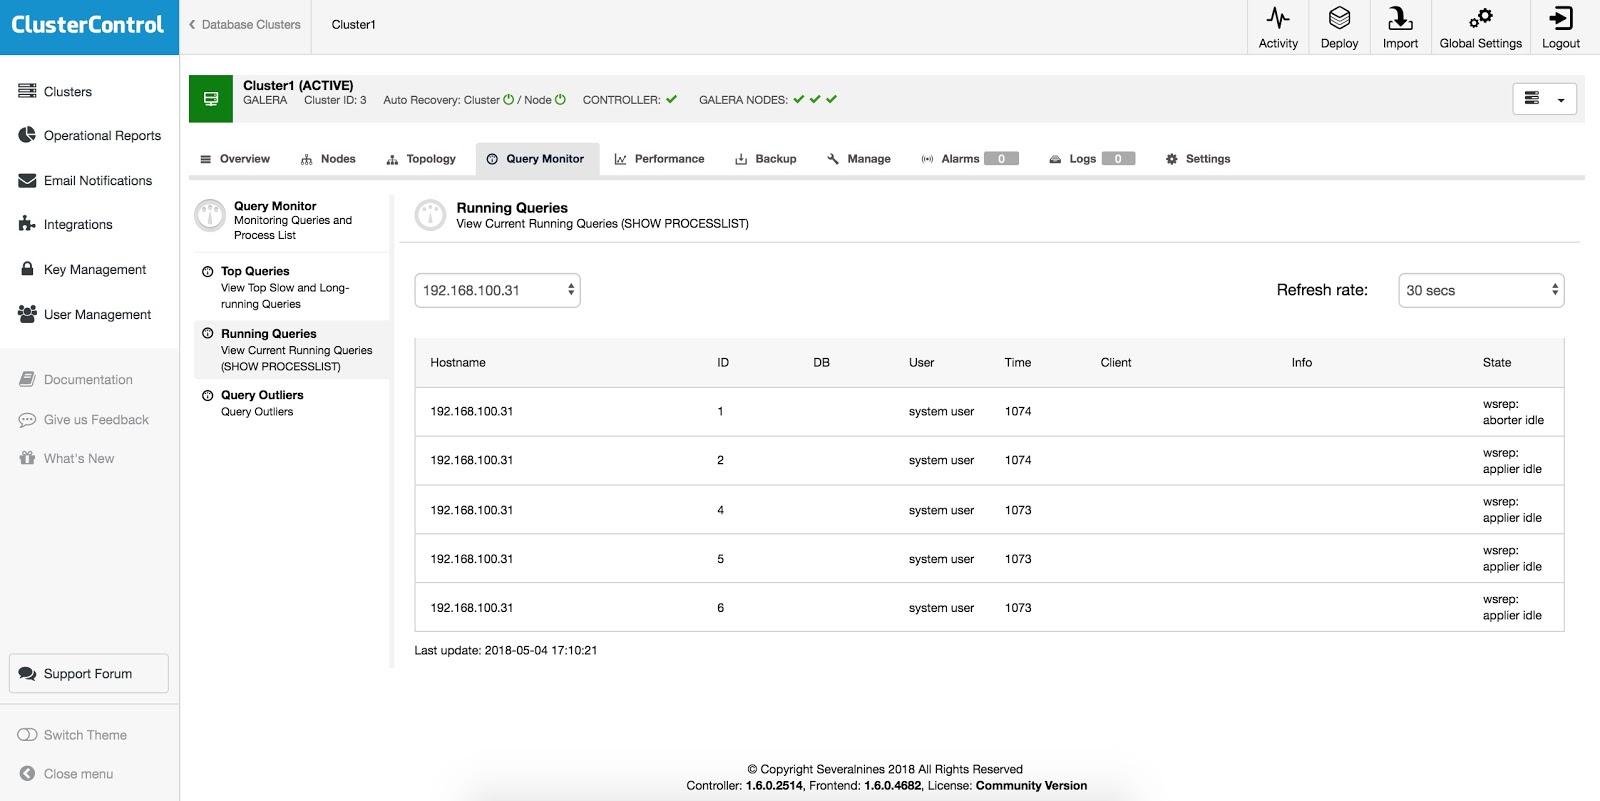
You can check your database queries from the Query Monitor in Cluster -> Query Monitor.
Also, you have information about your database performance in Cluster -> Performance.
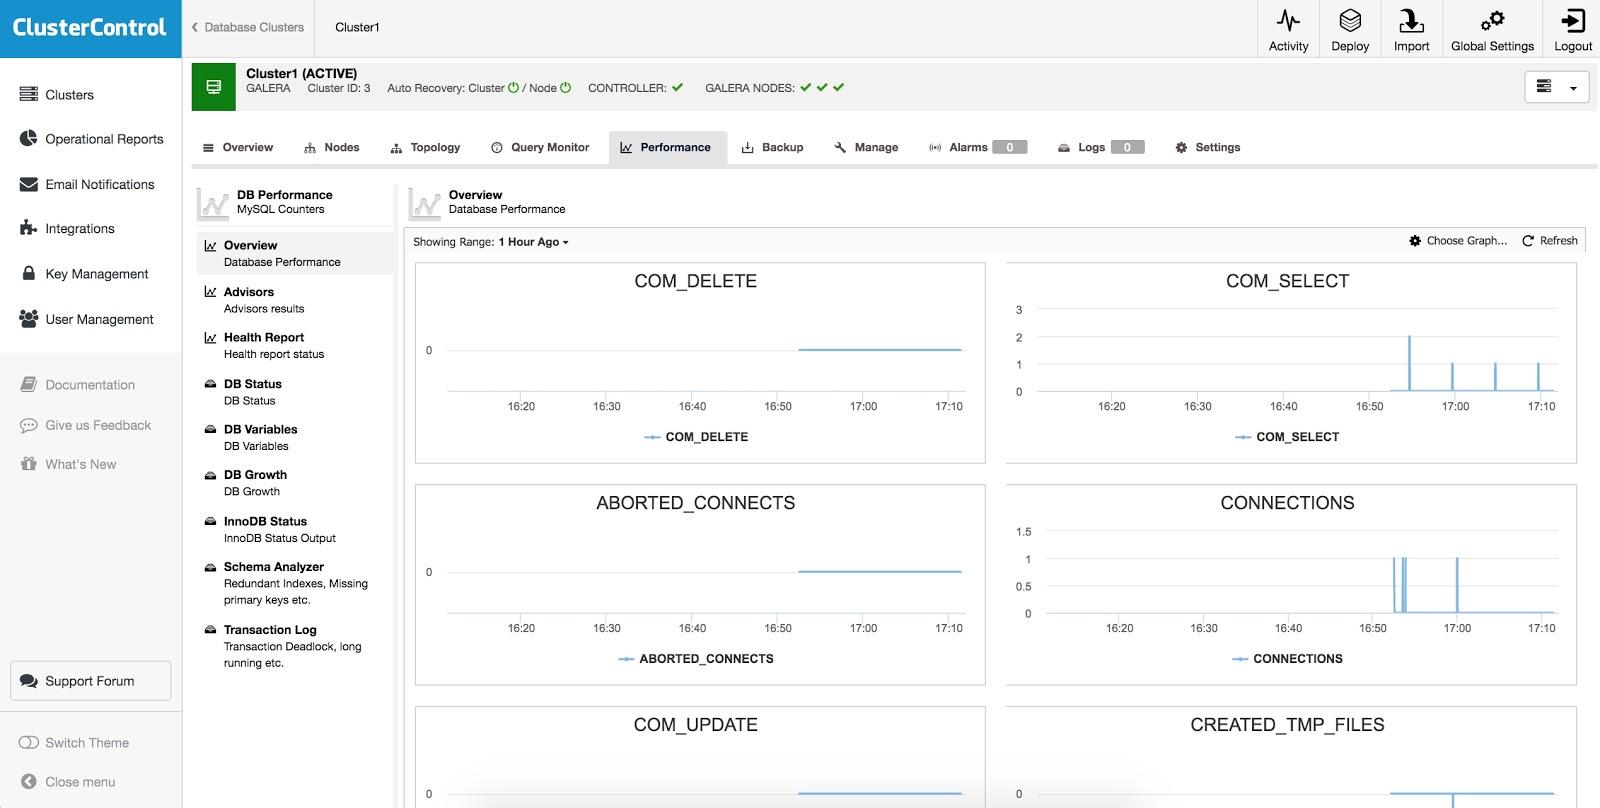
Using these functionalities we can identify slow or incorrect queries very easily, optimize them, and improve the performance of our systems.
In this way, we can have our cluster fully monitored, without adding additional tools or utilities ,and for free.
Performance Advisors
We have a number of predefined advisors, starting from simple ones like CPU usage, disk space, top queries, to more advanced ones detecting redundant indexes, queries not using indexes that cause table scans, and so on.
We can see the predefined advisors in Cluster -> Performance -> Advisors.
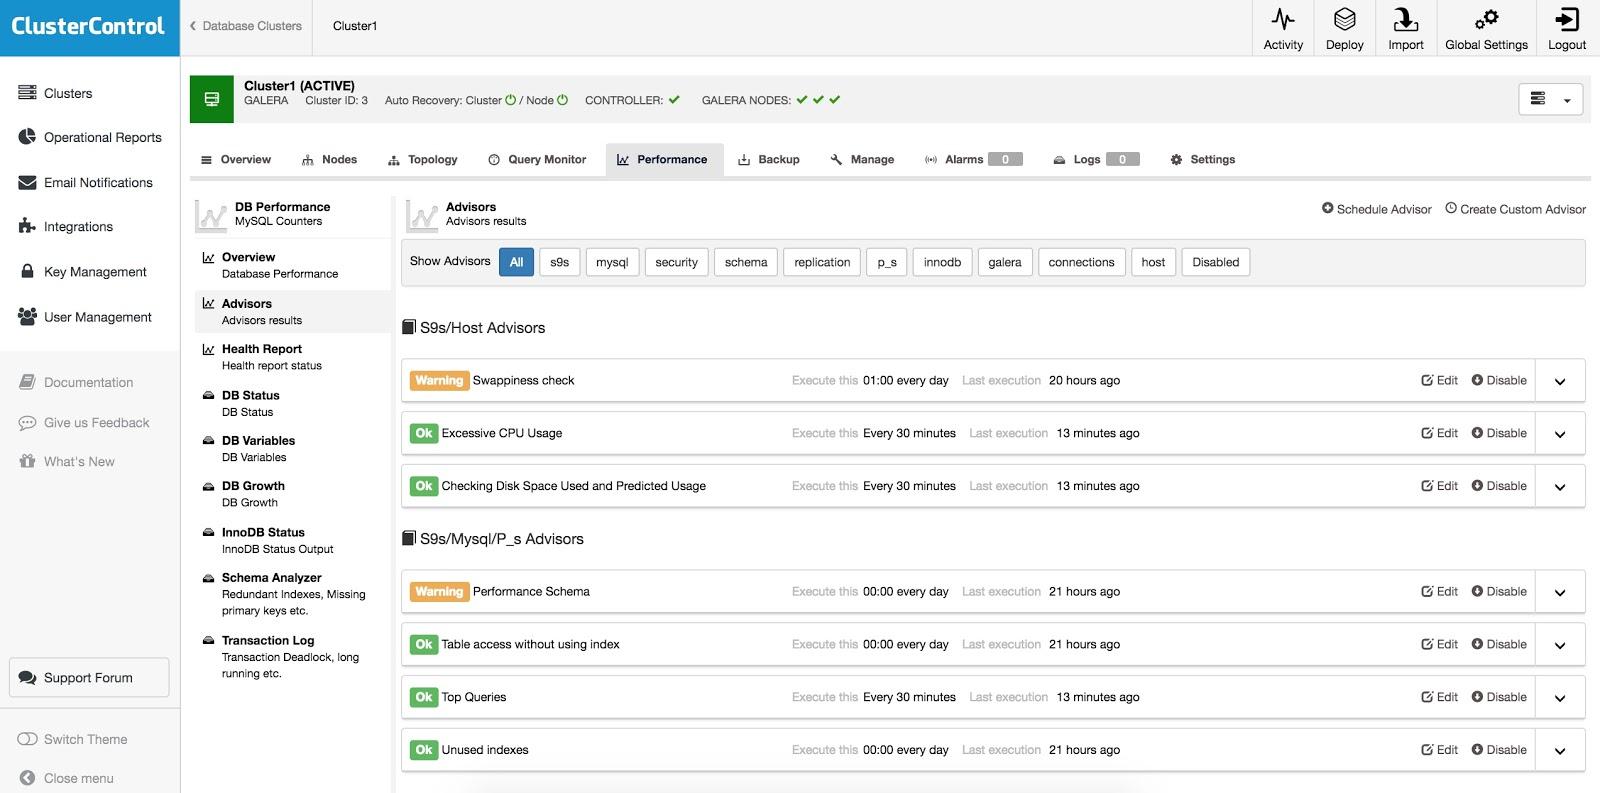
Here we can see details, disable, enable or edit our Advisors.
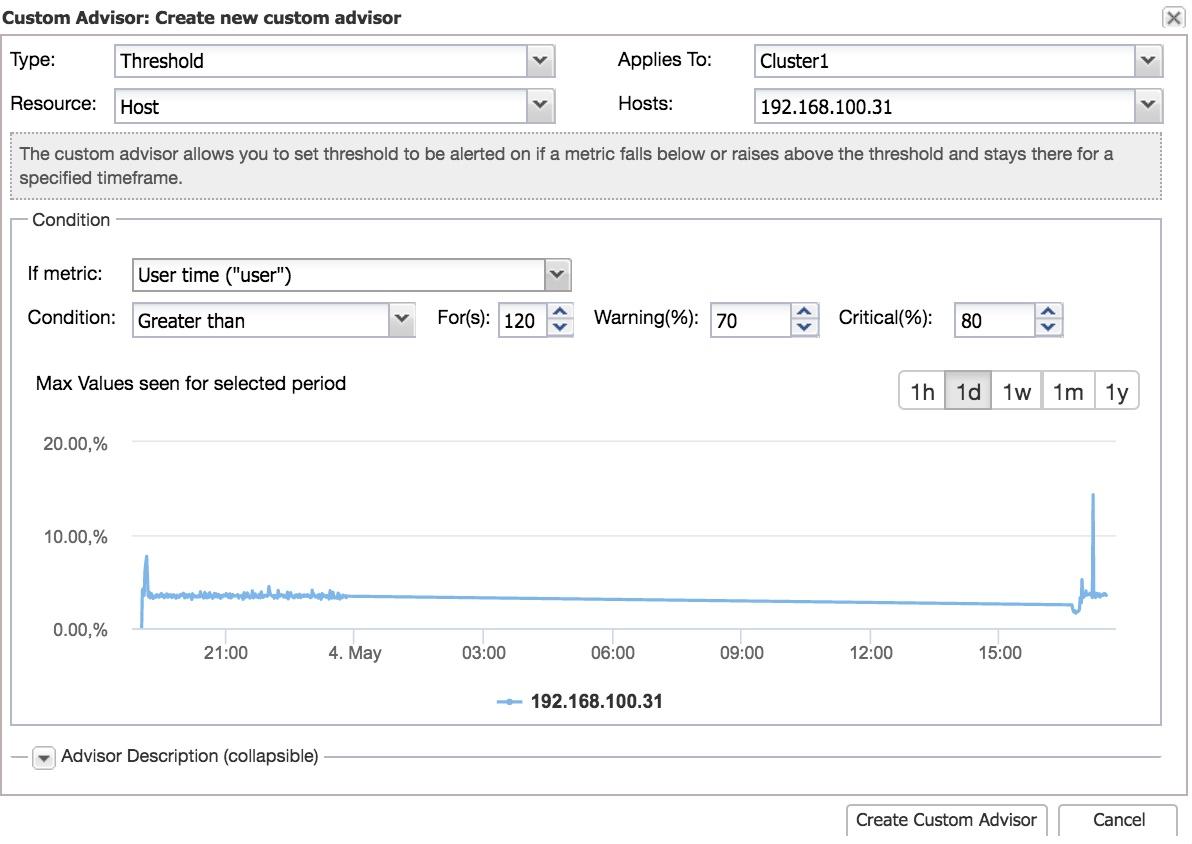
Also we can easily configure our own advisors. We can check our custom advisors in Cluster -> Manage -> Custom Advisors.
Develop custom advisors
We can also create our own advisors using the Developer Studio tool, available in Cluster -> Manage -> Developer Studio.
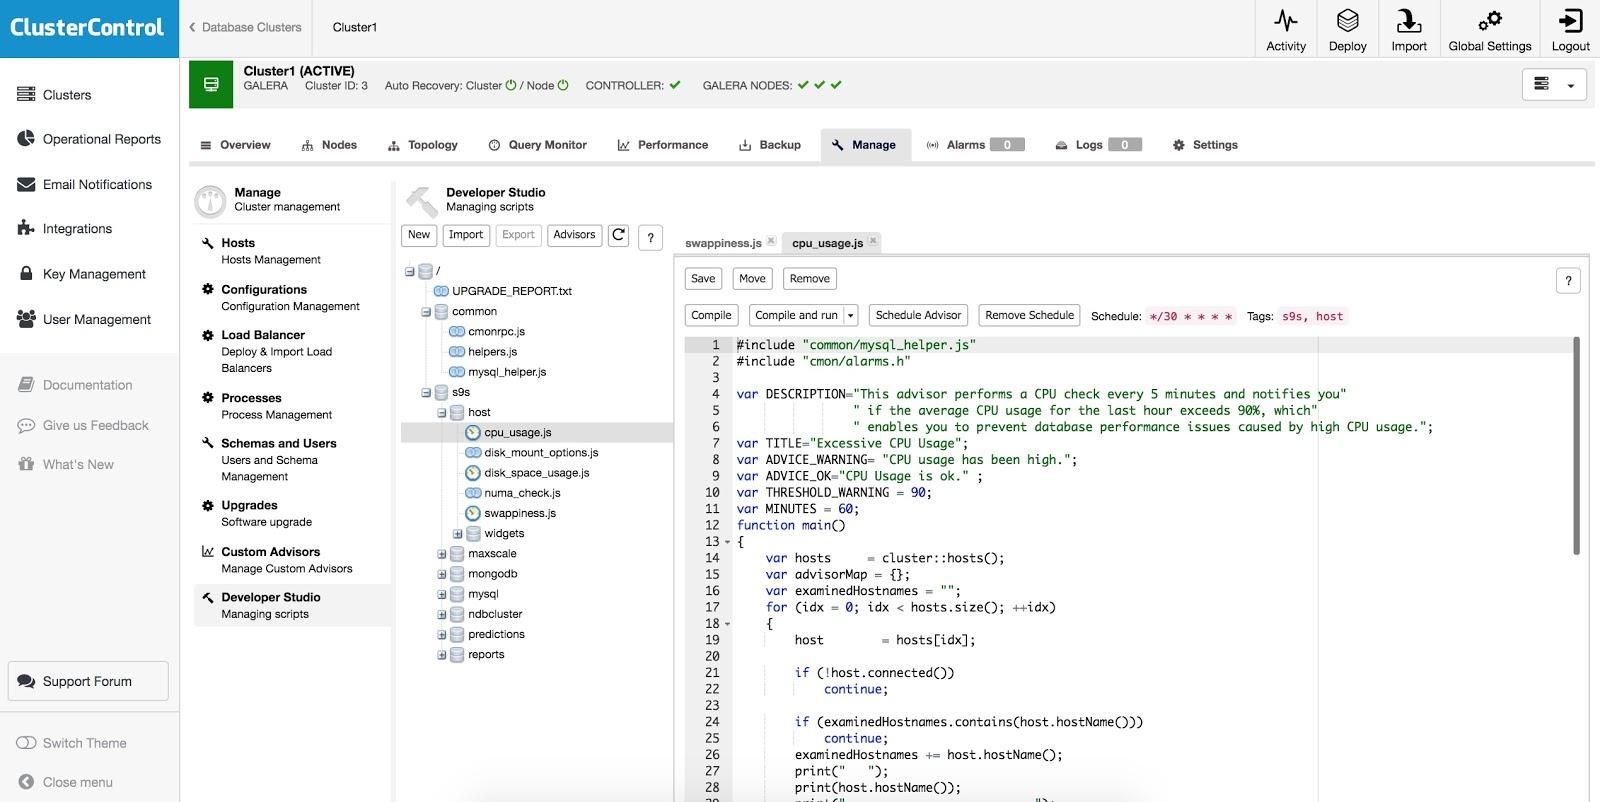
With this tool, you can create your own custom database advisors to monitor specific items to let you know if something goes wrong.
Topology View
To use this feature, you need to go to Cluster -> Topology.
From the Topology view, you can get a visual representation of your cluster, quickly see how they are organized and the health status of each node. This is particularly useful when having e.g., replication setups with multiple masters. You can also detect problems very easily, as each object presents a quick summary of its status.
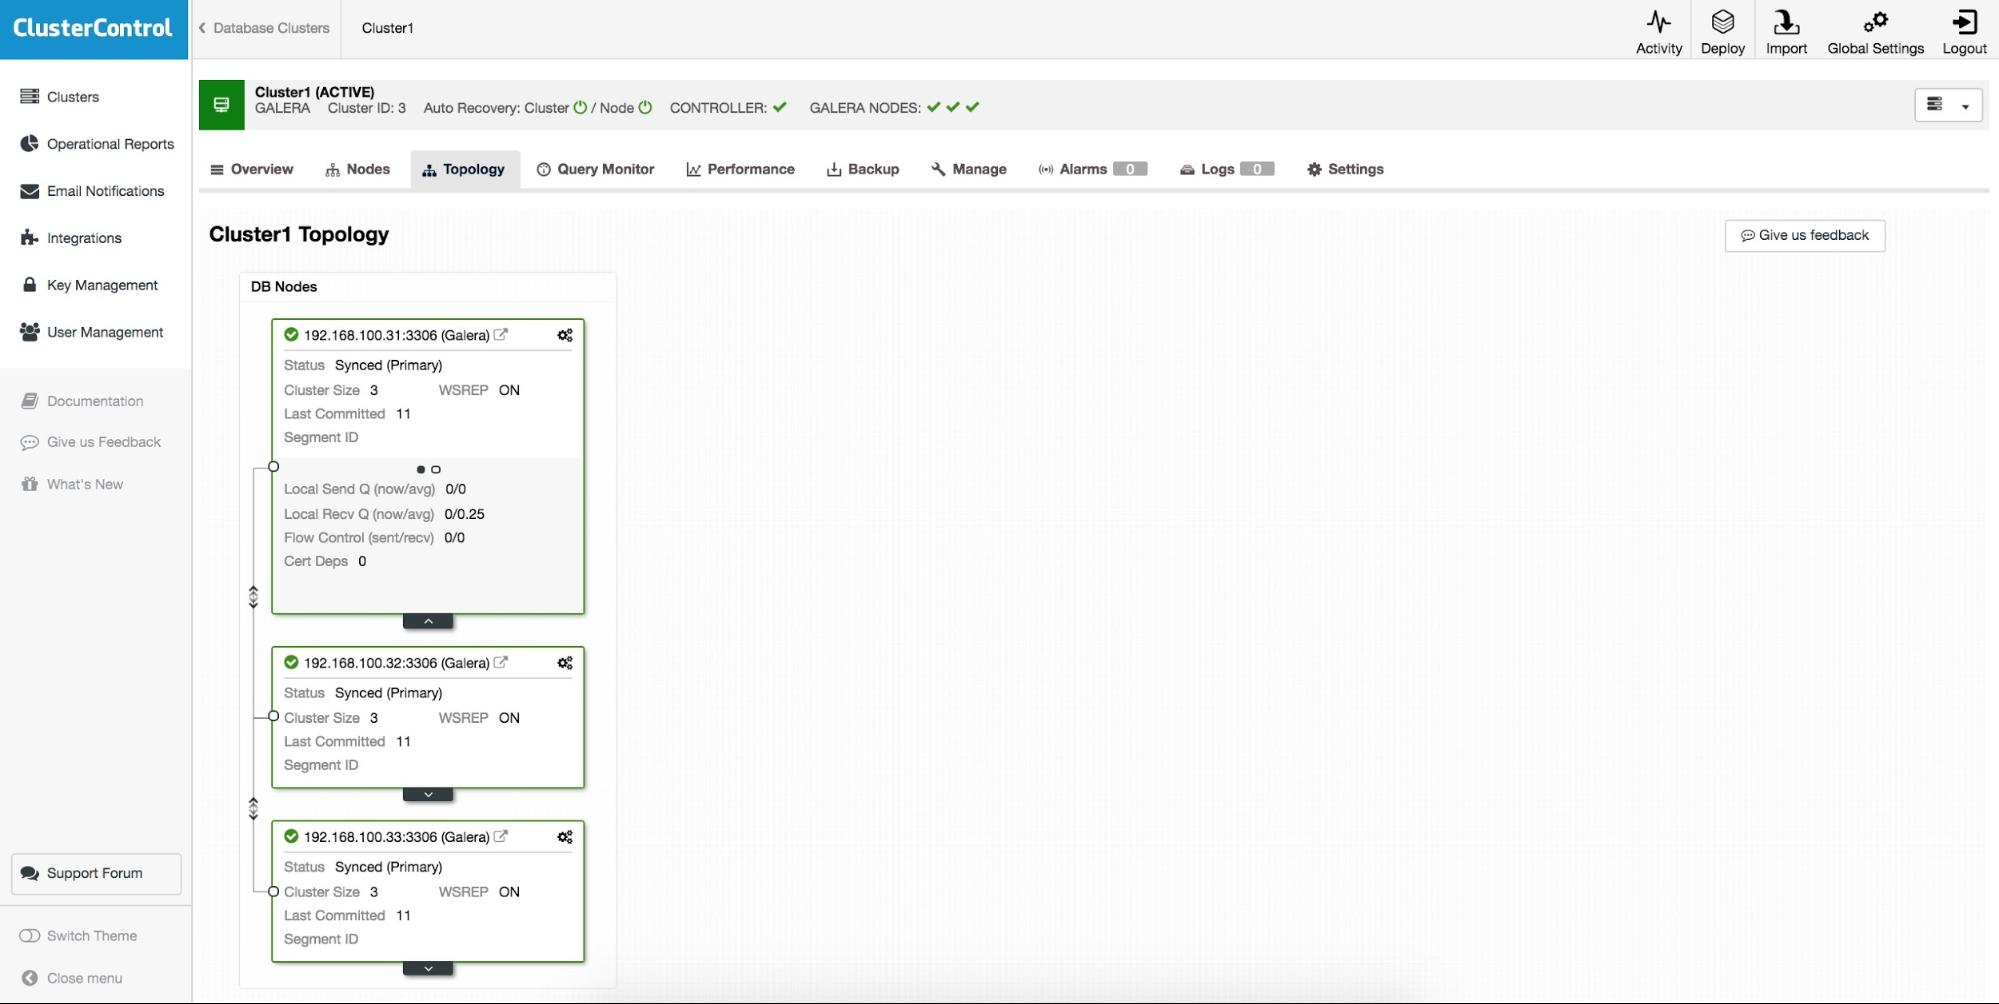
You can also check details about replication and operative system from each node.
Community Support
Finally, for any question or problem that comes our way, we have community support available, where both the Severalnines technicians and the community itself can help us solve our problems.
We also have a number of free resources available, such as blogs, webinars, documentation, or tips and tricks for ClusterControl on our website.
Conclusion
As we saw in this blog, ClusterControl Community Edition gives us the possibility to deploy database clusters and get a real-time view of database status and queries. This can help save time and work in our daily tasks, and is a great way to get started. Do give it a try and let us know what you think. There are other useful features in the commercial edition, such as security, backups, automatic recovery, load balancers and more, that can be activated by upgrading our license.