blog
Visualizing Your Cluster Topology in ClusterControl

Distributed databases or clusters typically consist of multiple node and nodes types, and it is not always easy to understand how all these hang together. For instance, one could have a replication setup with intermediate masters, and replication traffic following a certain path. Throw in some load balancers, hosts with multiple IP addresses, read only flags and slave lag, and you’re in for a brain teaser.
However, a picture is worth a thousand words. That’s exactly what ClusterControl’s new Topology View delivers. It shows all the different nodes that form part of your database cluster (whether database nodes, load balancers or arbitrators), as well as the connections between them. The nodes, connections, and their statuses are discovered by ClusterControl. Since ClusterControl is continuously monitoring the nodes and keeps state information, any changes in the topology are reflected in the web interface. If a node has failed, it will be shown as offline.
From the topology view, you can manage the nodes, change masters by dragging and dropping the object on the desired master, restart nodes and synchronize data. You can also detect problems very easily, as each object presents a quick summary of its status. ClusterControl performs some extra controls for the actions you want to perform. The predefined checks do not allow executing tasks that can cause data loss.
There are different types topologies, we will show some of them and see how they work.
Galera Cluster
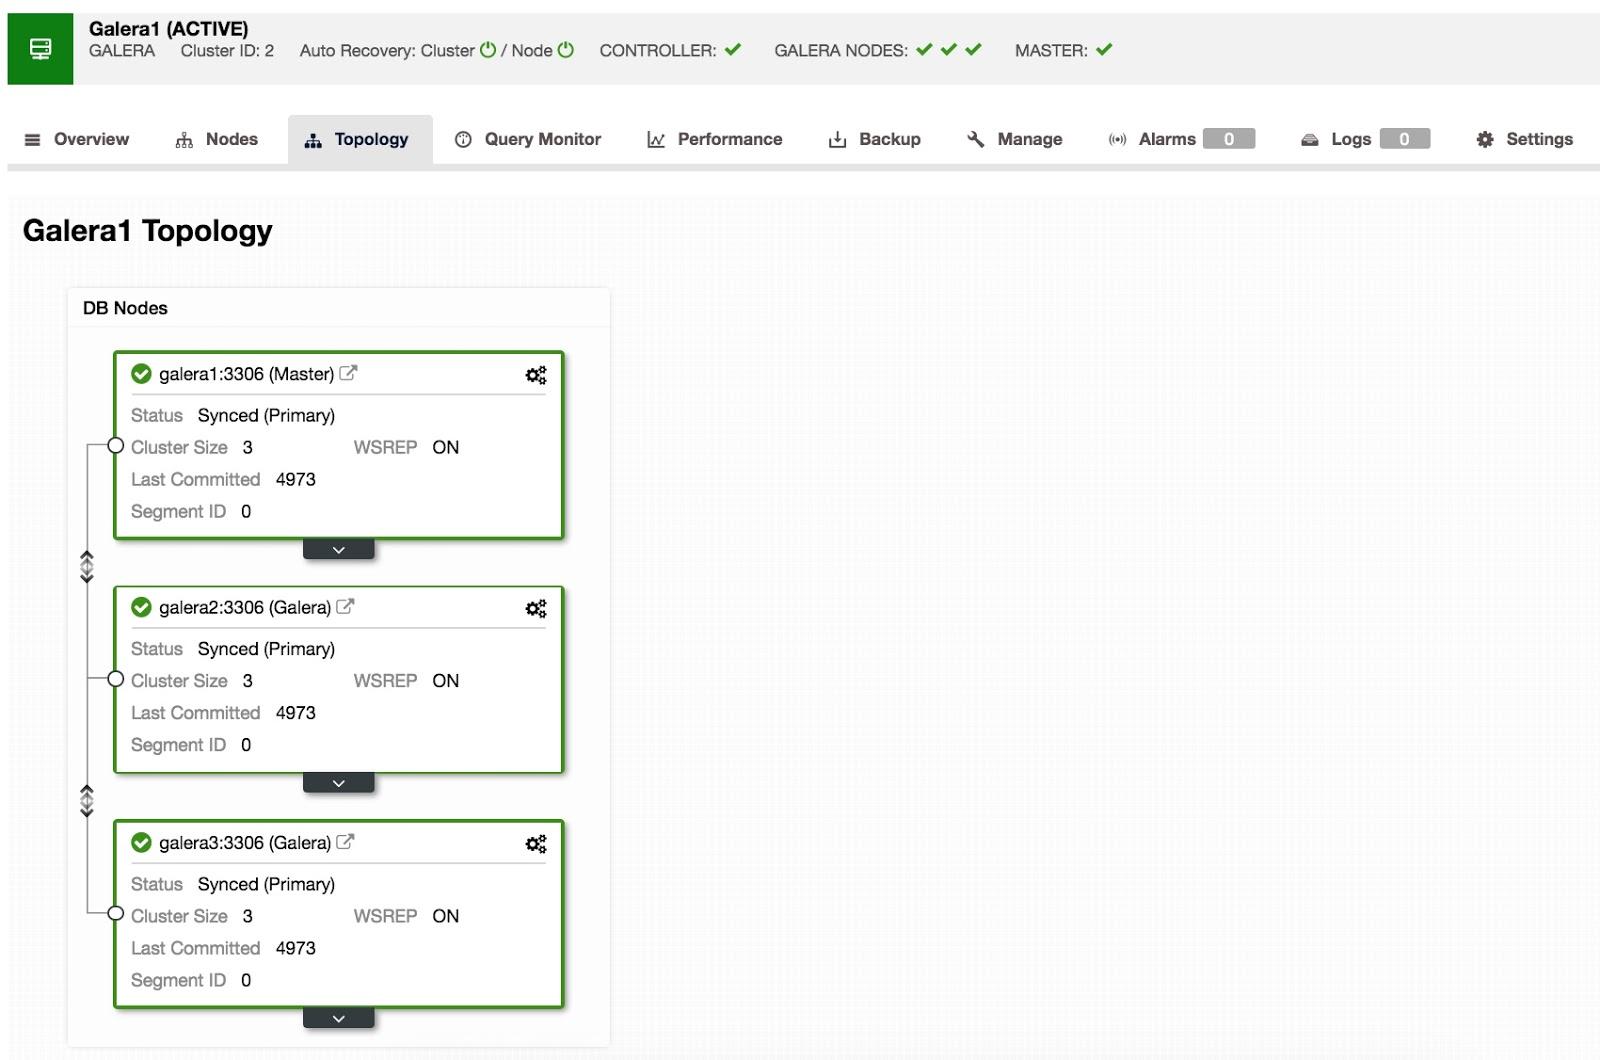
Here we have a basic Galera Cluster topology with 3 nodes.
In this screen we can see the 3 nodes working correctly and basic information such as the state and the last commit.
We can also observe that galera1 is listed as master, since it is generating binlogs.
If we expand one of the nodes, we can view additional status information.
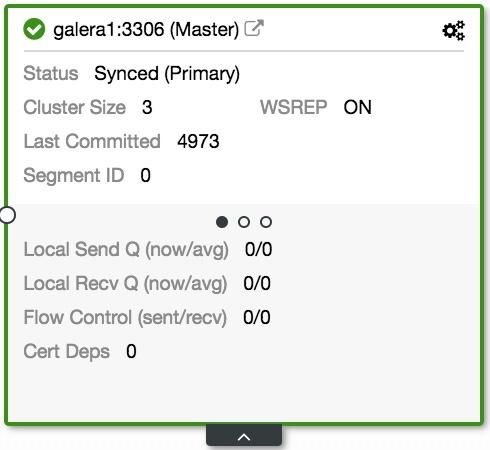
In the first we see information related to Galera traffic.
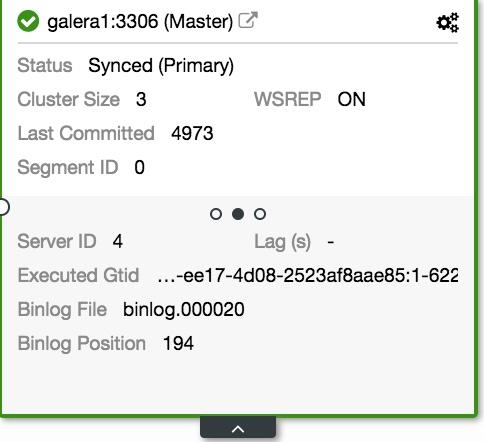
In the second subscreen, we can see details about regular MySQL replication.
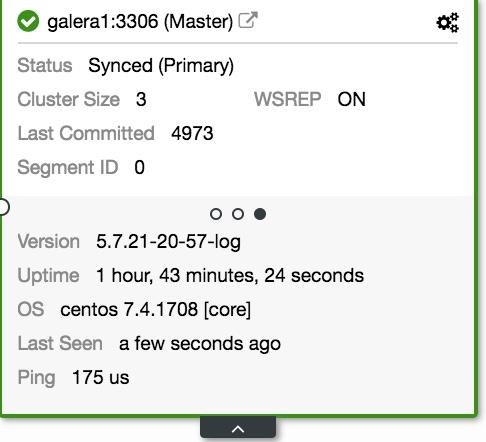
In the third, we have details about the server, such as uptime and version.
We also have actions that we can perform on the nodes.
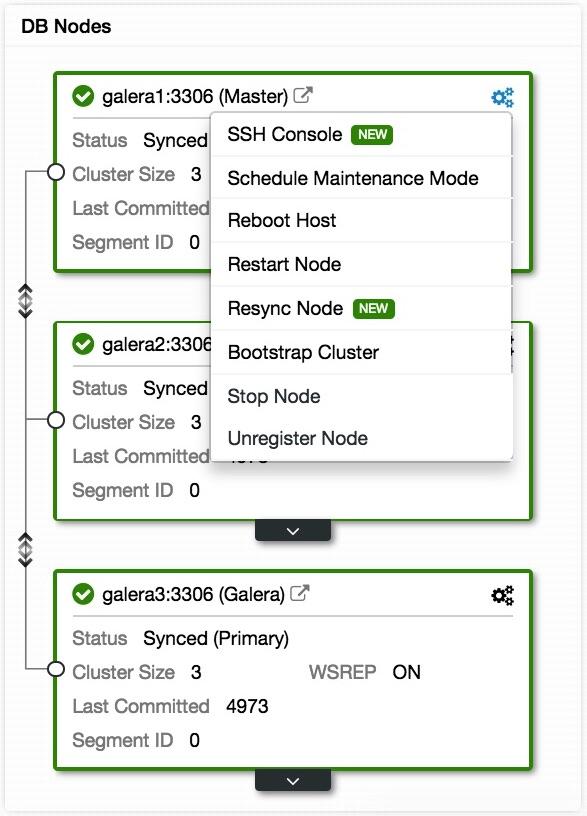
If we click on the right icon, we can see the available actions:
- SSH Console: It allows us to access an ssh console on the node.
- Schedule Maintenance Mode: Allows you to set a maintenance window for the node.
- Reboot Host: We can restart the host from here.
- Restart Node: We can restart the database.
- Resync Node: Allows us to perform a resync of the node.
- Bootstrap Cluster: By selecting this option, we can perform a bootstrap of the cluster by selecting the corresponding node.
- Stop Node: We can stop the database.
- Unregister Node: With this action, we remove the node from the cluster.
MySQL Replication
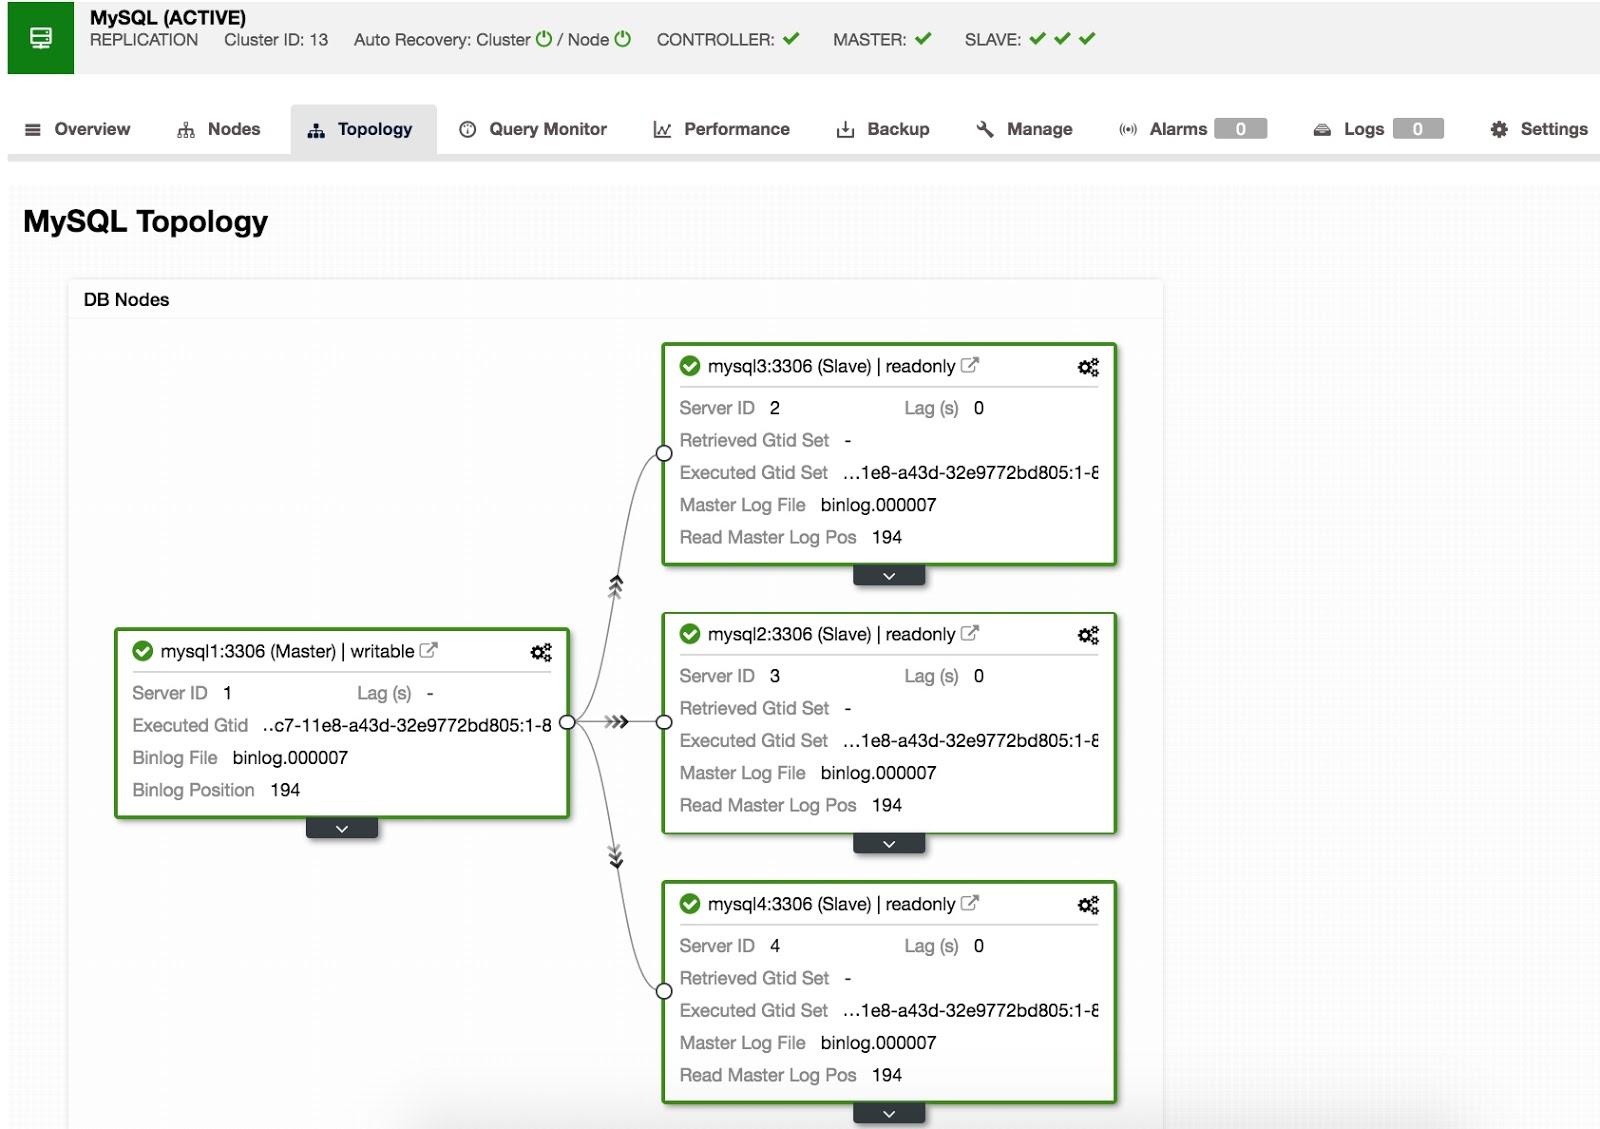
In this screen we can see a MySQL Replication topology with 1 master and 3 slaves.
We have some information such as the state of the replicas and the master, which nodes are writeable, and the position of the replication.
If we expand each node, we can obtain more detailed information.
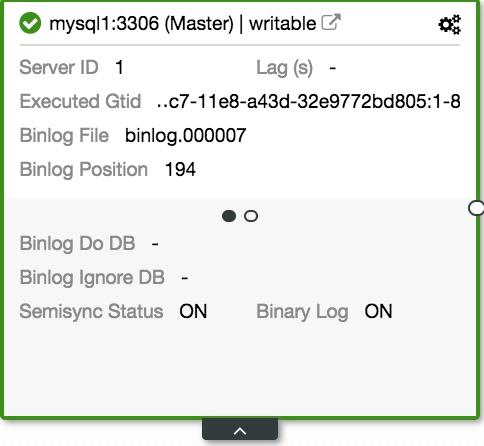
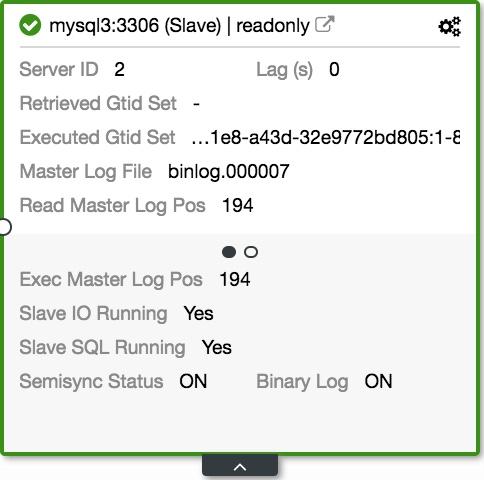
In the first sub screen, we can see details of the replication. Both the master and the slave.
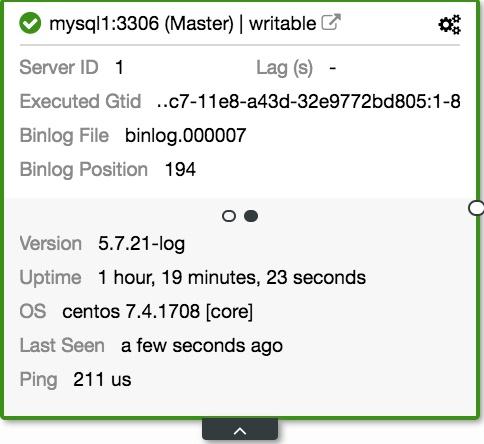
In the second sub screen, we see server details, such as version and uptime.
We have different actions that we can perform on the nodes.
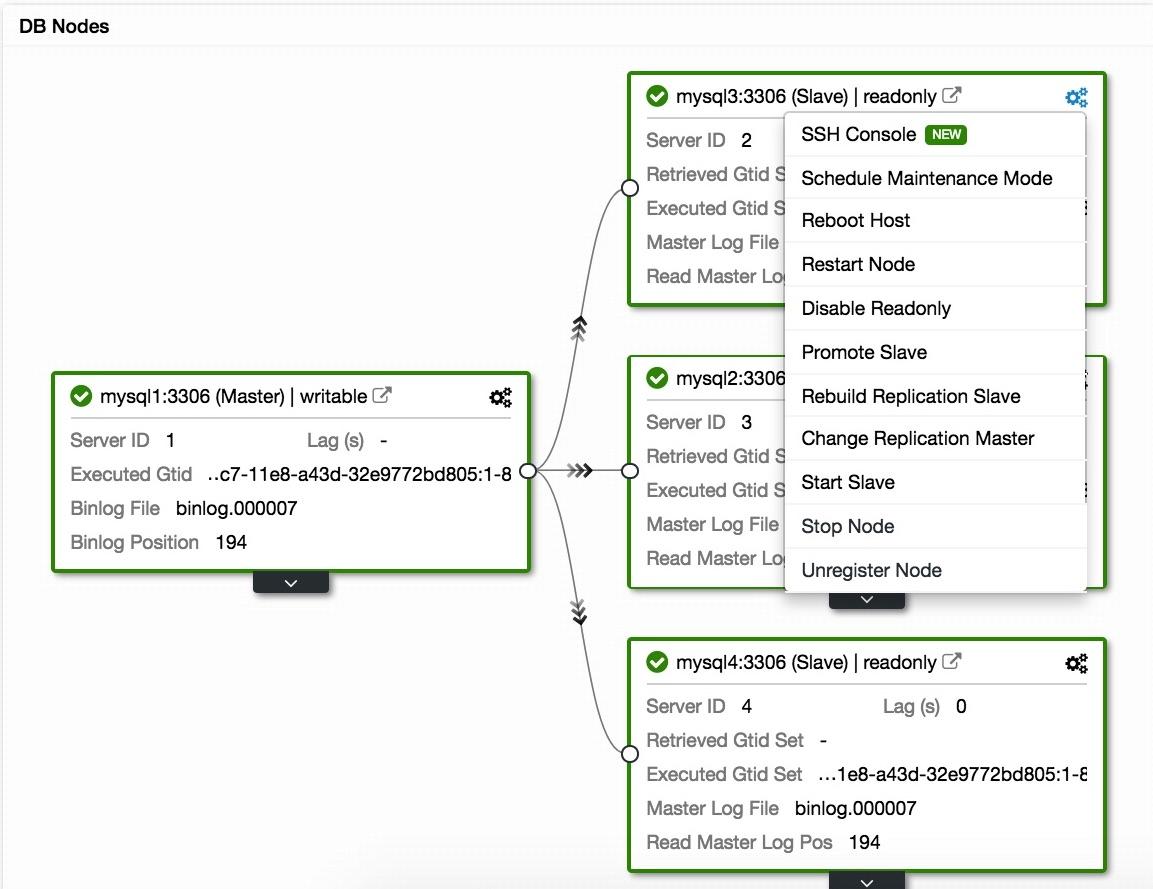
If we click on the right icon, we can see the available actions:
- SSH Console: It allows us to access an ssh console inside the node.
- Schedule Maintenance Mode: Allows you to set a maintenance window for the node.
- Reboot Host: We can restart the host from here.
- Restart Node: We can restart the database.
- Disable Readonly: With this option we enable writing on the replica.
- Promote Slave: Allows to promote a slave to master.
- Rebuild Replication Slave: Selecting this option we rebuild the replica by selecting a master.
- Change Replication Master: Allows you to change the master of the replication.
- Start Slave: Start the instance.
- Stop Node: We can stop the instance.
- Unregister Node: With this action we remove the node from the cluster.
The options may vary depending on the role of the node.
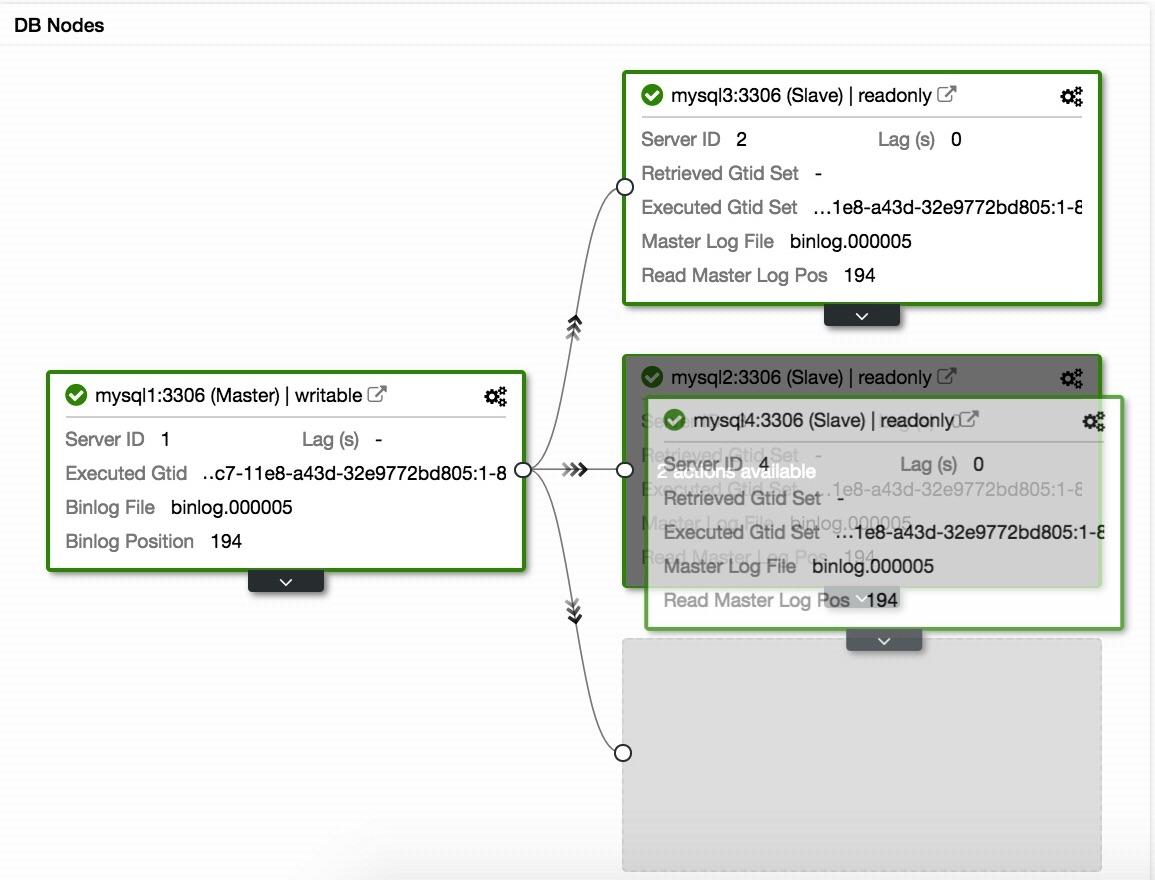
You can also, by selecting a node and dragging it to another node, select one of the following options:
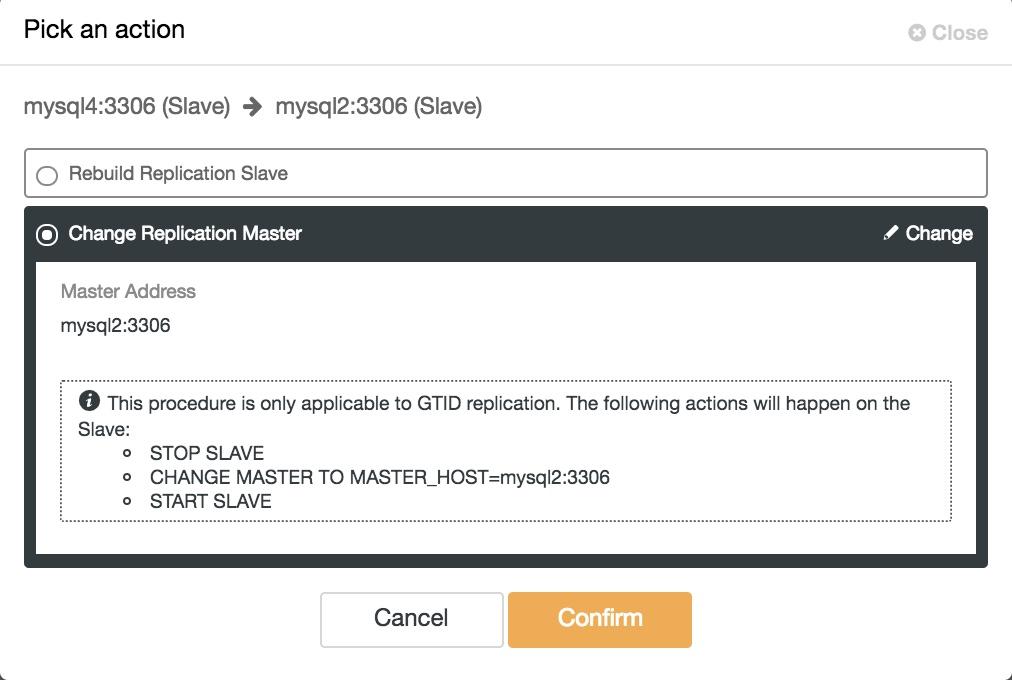
You can rebuild the replica from that new node, or simply change the master and continue replicating.
When confirming the changes, we will have a new topology view:
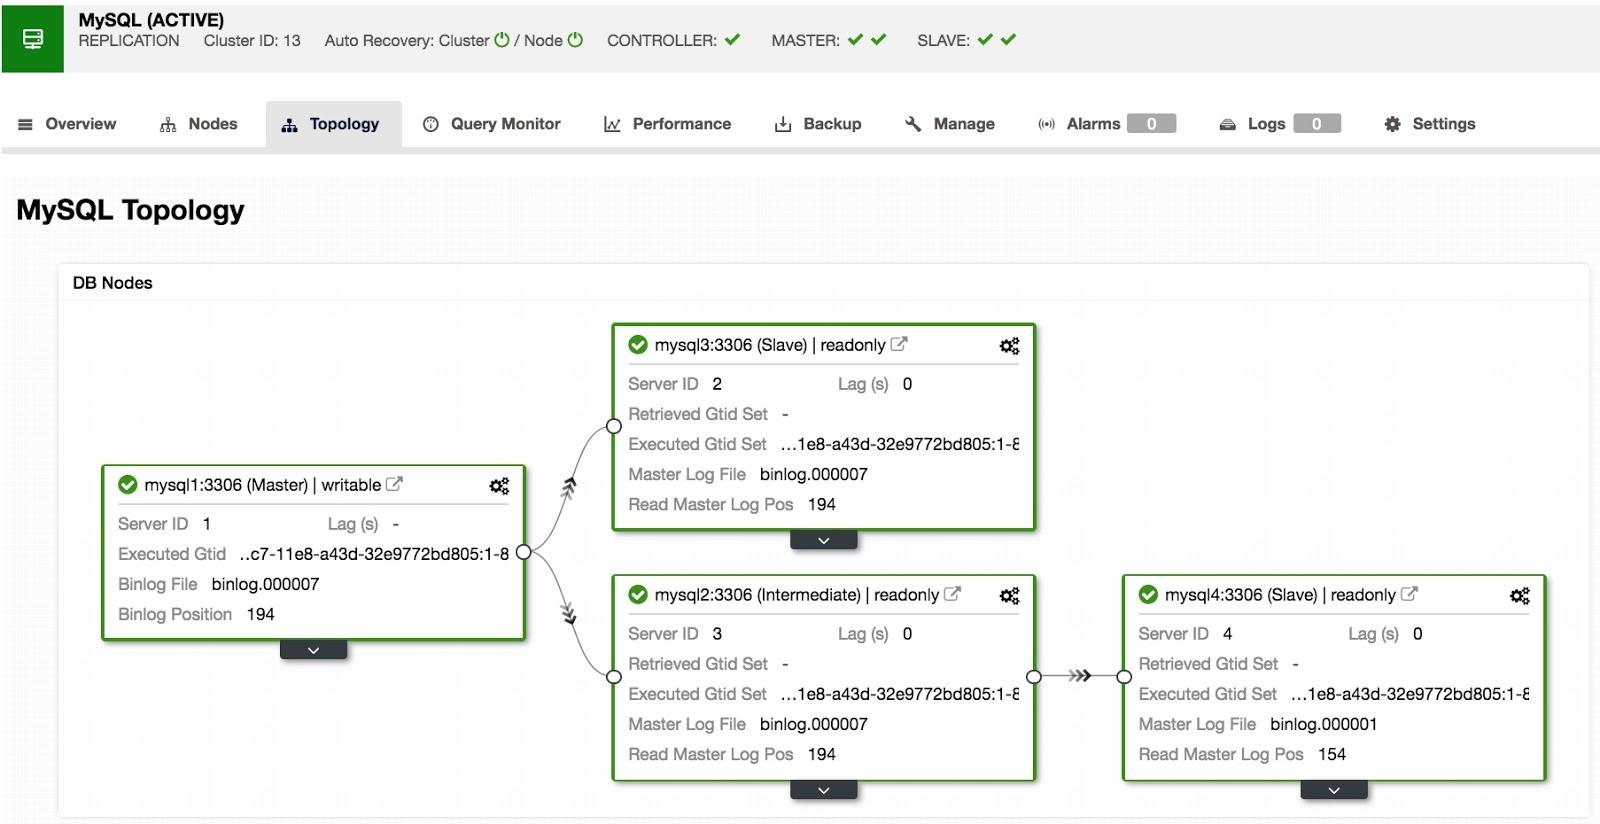
Here we can see that we have our master, with two replicas, and one of those replicas functions as an intermediate master, with a slave replicating from it.
PostgreSQL
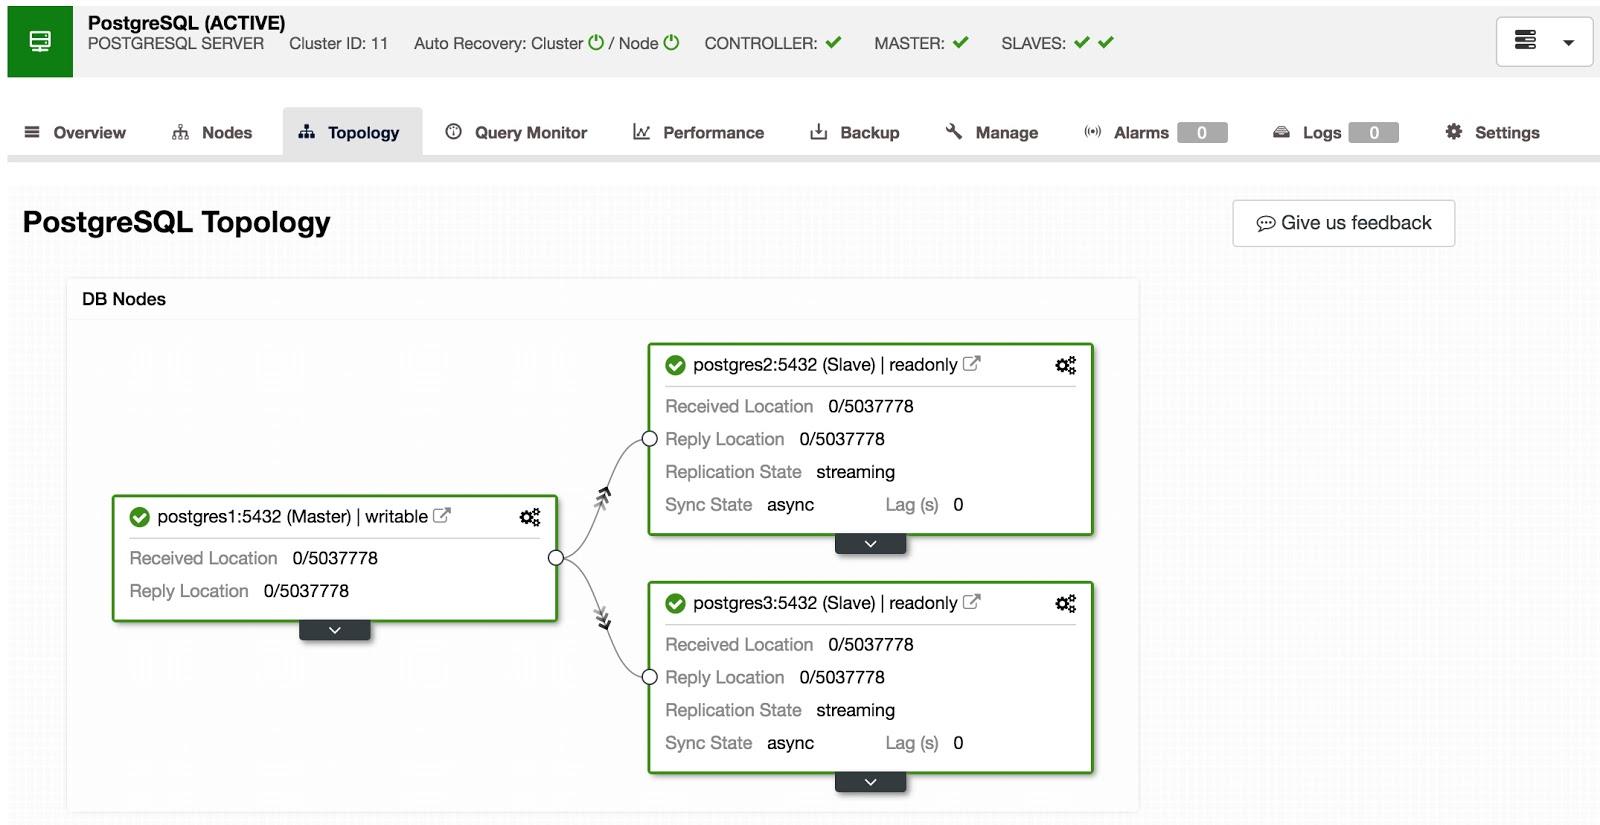
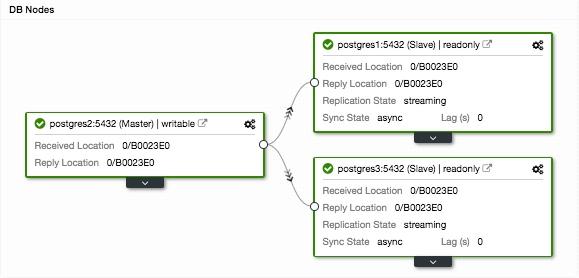
Here we have a topology for PostgreSQL, with 1 master and 2 slaves.
We can observe the role of each one, which nodes allow writing and the state of replication.
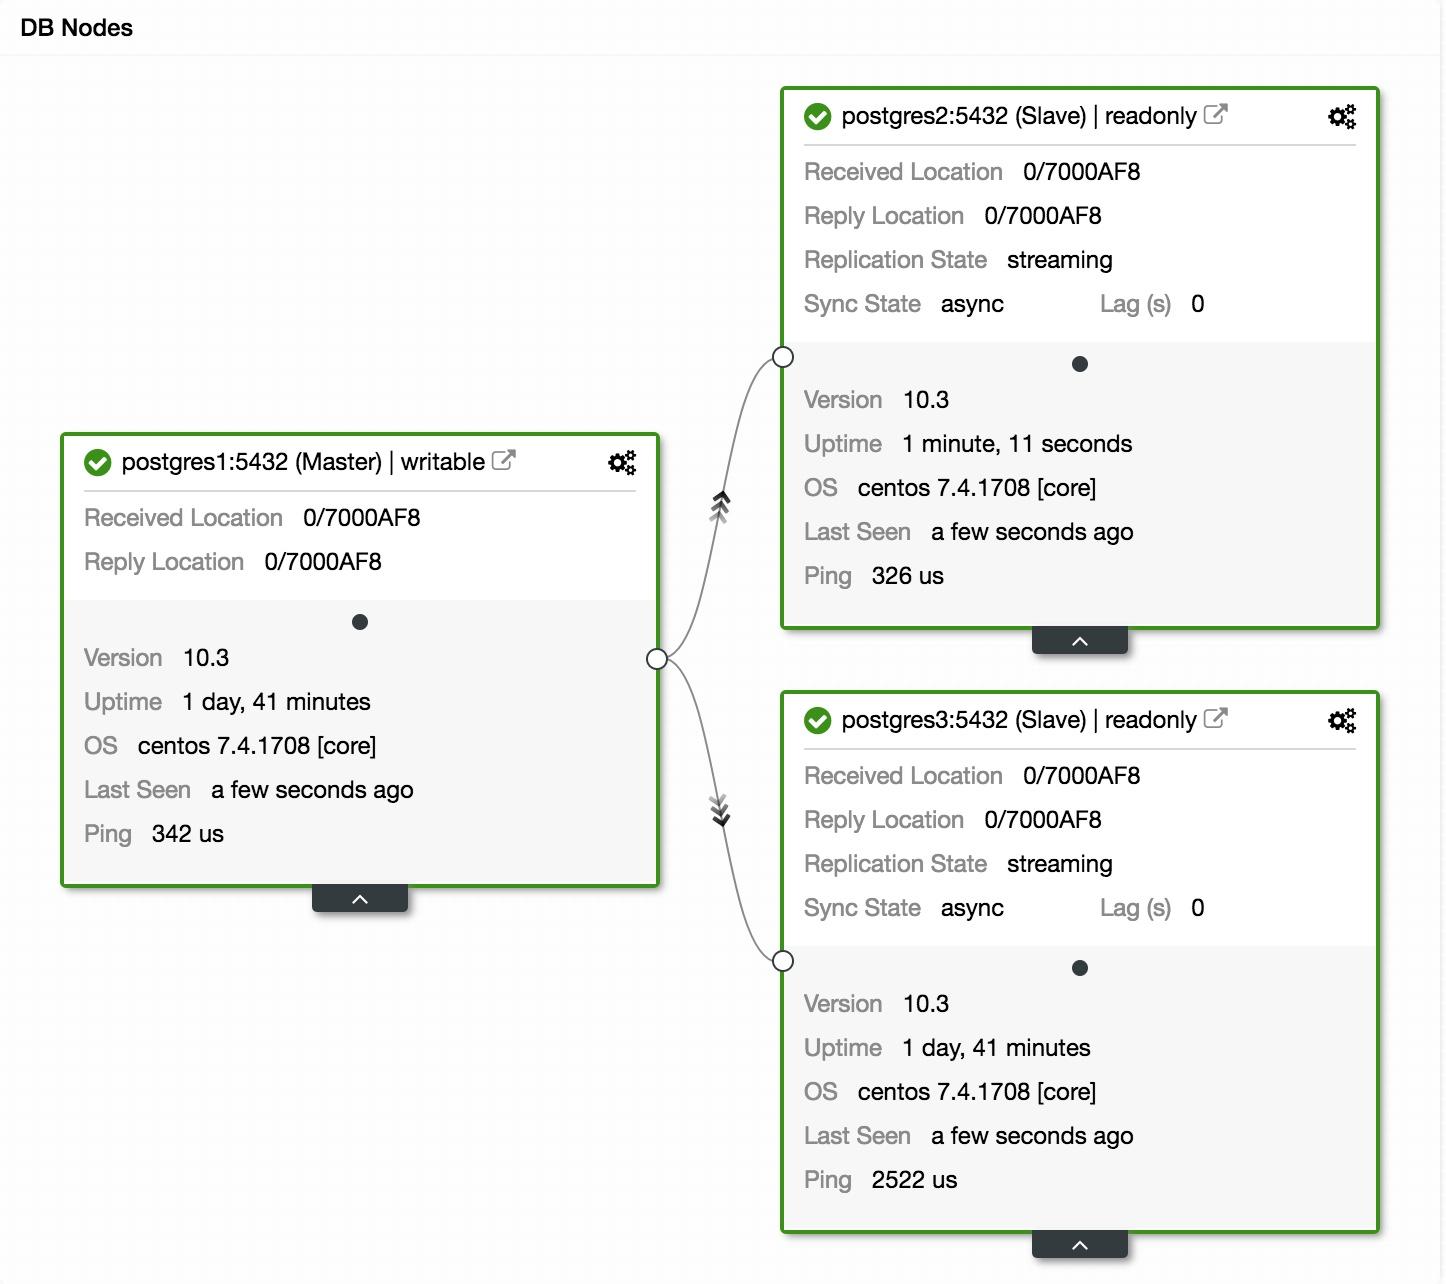
If we expand the information of the nodes, we can see version and uptime details .
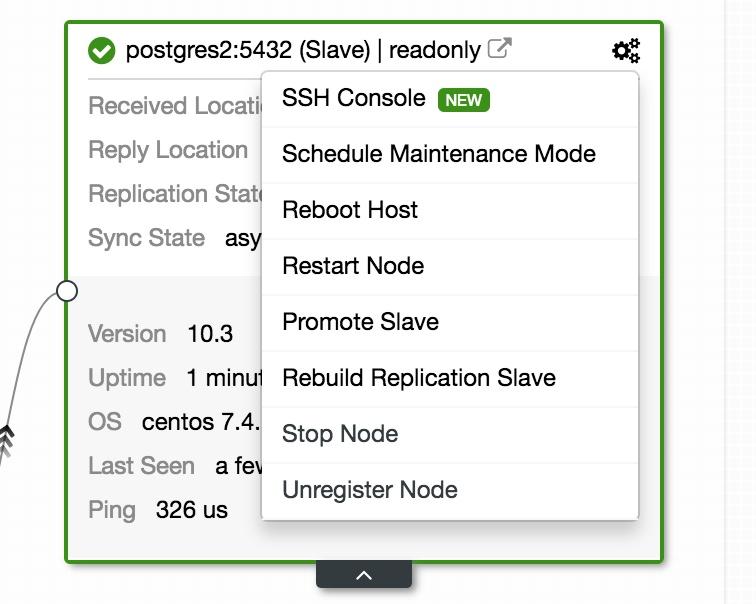
We also have different actions that can be performed on the nodes:
- SSH Console: It allows us to access an ssh console inside the node.
- Schedule Maintenance Mode: Allows you to set a maintenance window for the node.
- Reboot Host: We can restart the host from here.
- Restart Node: We can restart the database.
- Promote Slave: Allows us to promote a slave master.
- Rebuild Replication Slave: This option allows reconstructing a replica from a master.
- Stop Node: We can stop the database.
- Unregister Node: With this action we remove the node from the cluster.
The options may change depending on the role of each node.
If we want to modify our master, we can do it simply by selecting Promote Slave in the actions of the node that we saw earlier.
After a few seconds, we can see our new topology, with the new master we selected.
To rebuild a replica, we can simply select the node we want to modify and drop it on the master.
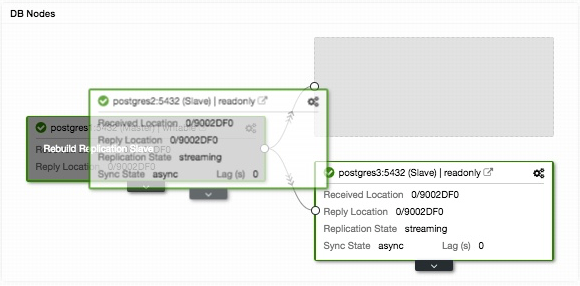
In this way, you can reconstruct a replica fast and easy.
MongoDB
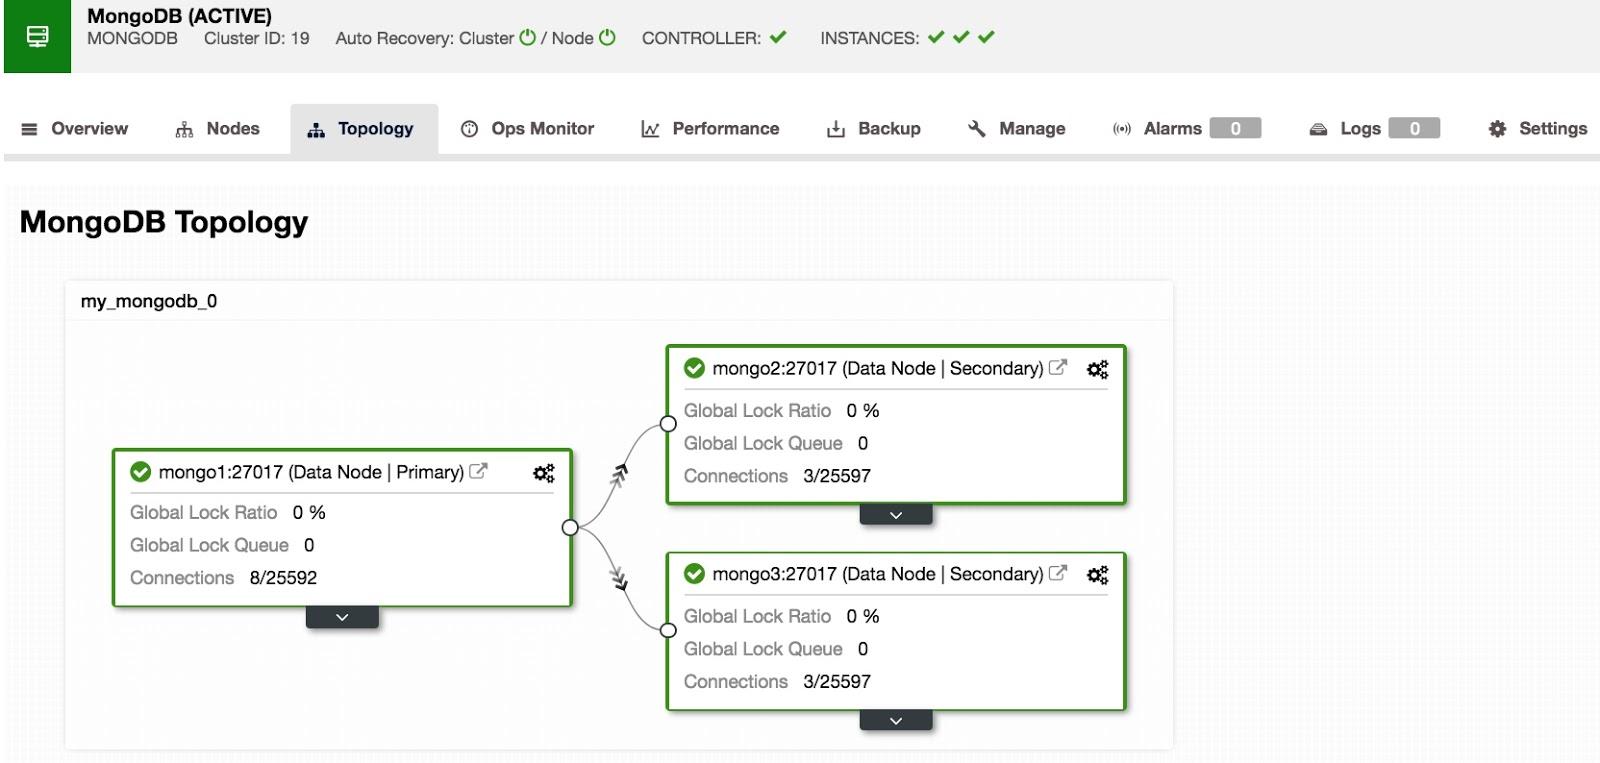
This is the topology for a MongoDB ReplicaSet with 1 primary node and 2 secondary nodes.
We can observe basic information such as connections and locks.
By expanding the node information, we can see two sub screens.
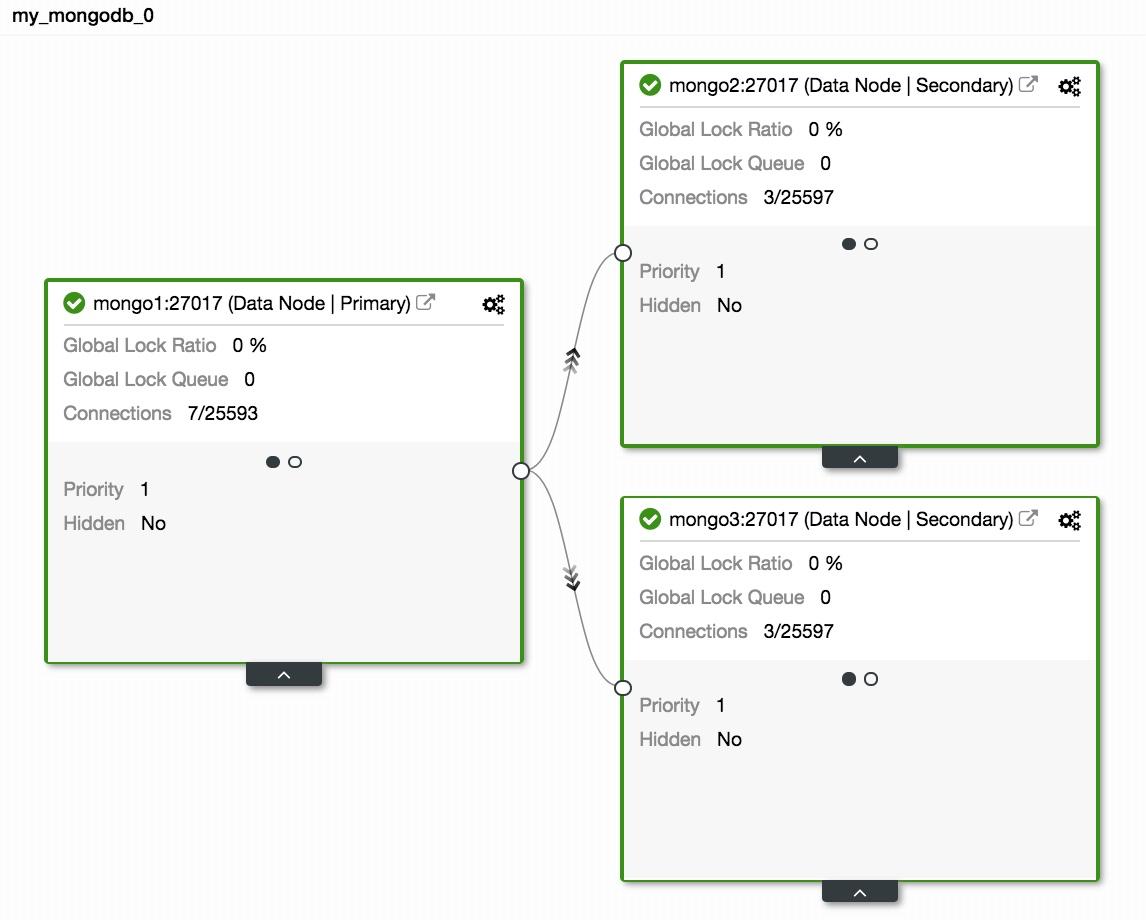
In the first, we see the priority and whether it is hidden or not.
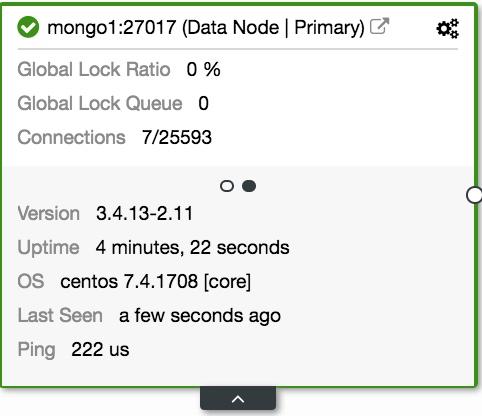
In the second we can see server data, such as the version and the uptime.
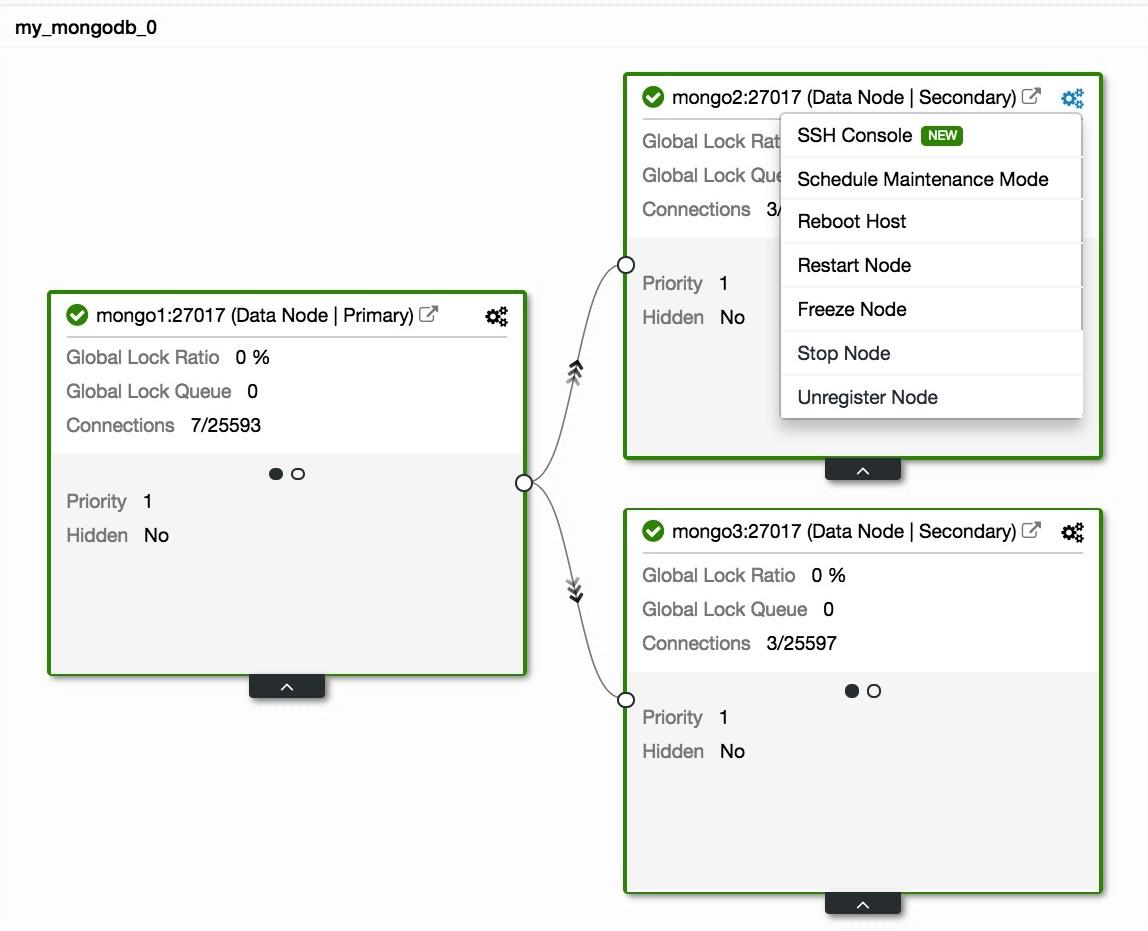
We have different actions to perform on each nodes:
- SSH Console: It allows us to access an ssh console inside the node.
- Schedule Maintenance Mode: Allows you to set a maintenance window for the node.
- Reboot Host: We can restart the host from here.
- Restart Node: We can restart the database.
- Freeze Node: We can put the node in freeze mode for X time.
- Stop Node: We can stop the database.
- Unregister Node: With this action we remove the node from the cluster.
The options may change depending on the role of each node.
General
Regardless of the engine that we use, if we lose access to any node, we can easily see it, and configure alerts about the events. Let’s see an example with Galera Cluster:
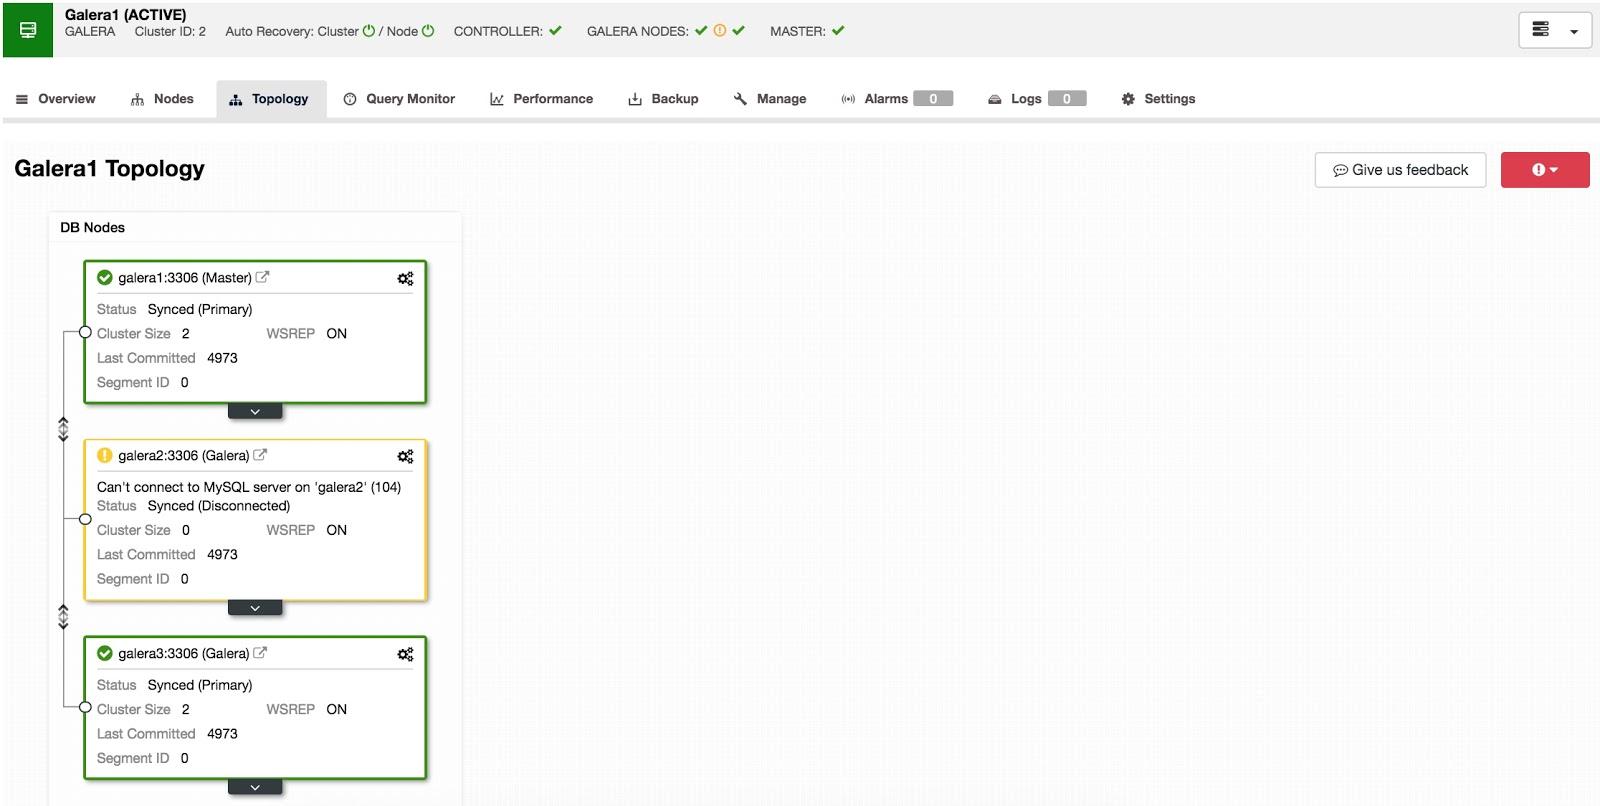
In this way, we can quickly identify the inaccessible node and take the necessary actions.
We can also have in our topology, load balancers with keepalived configured:
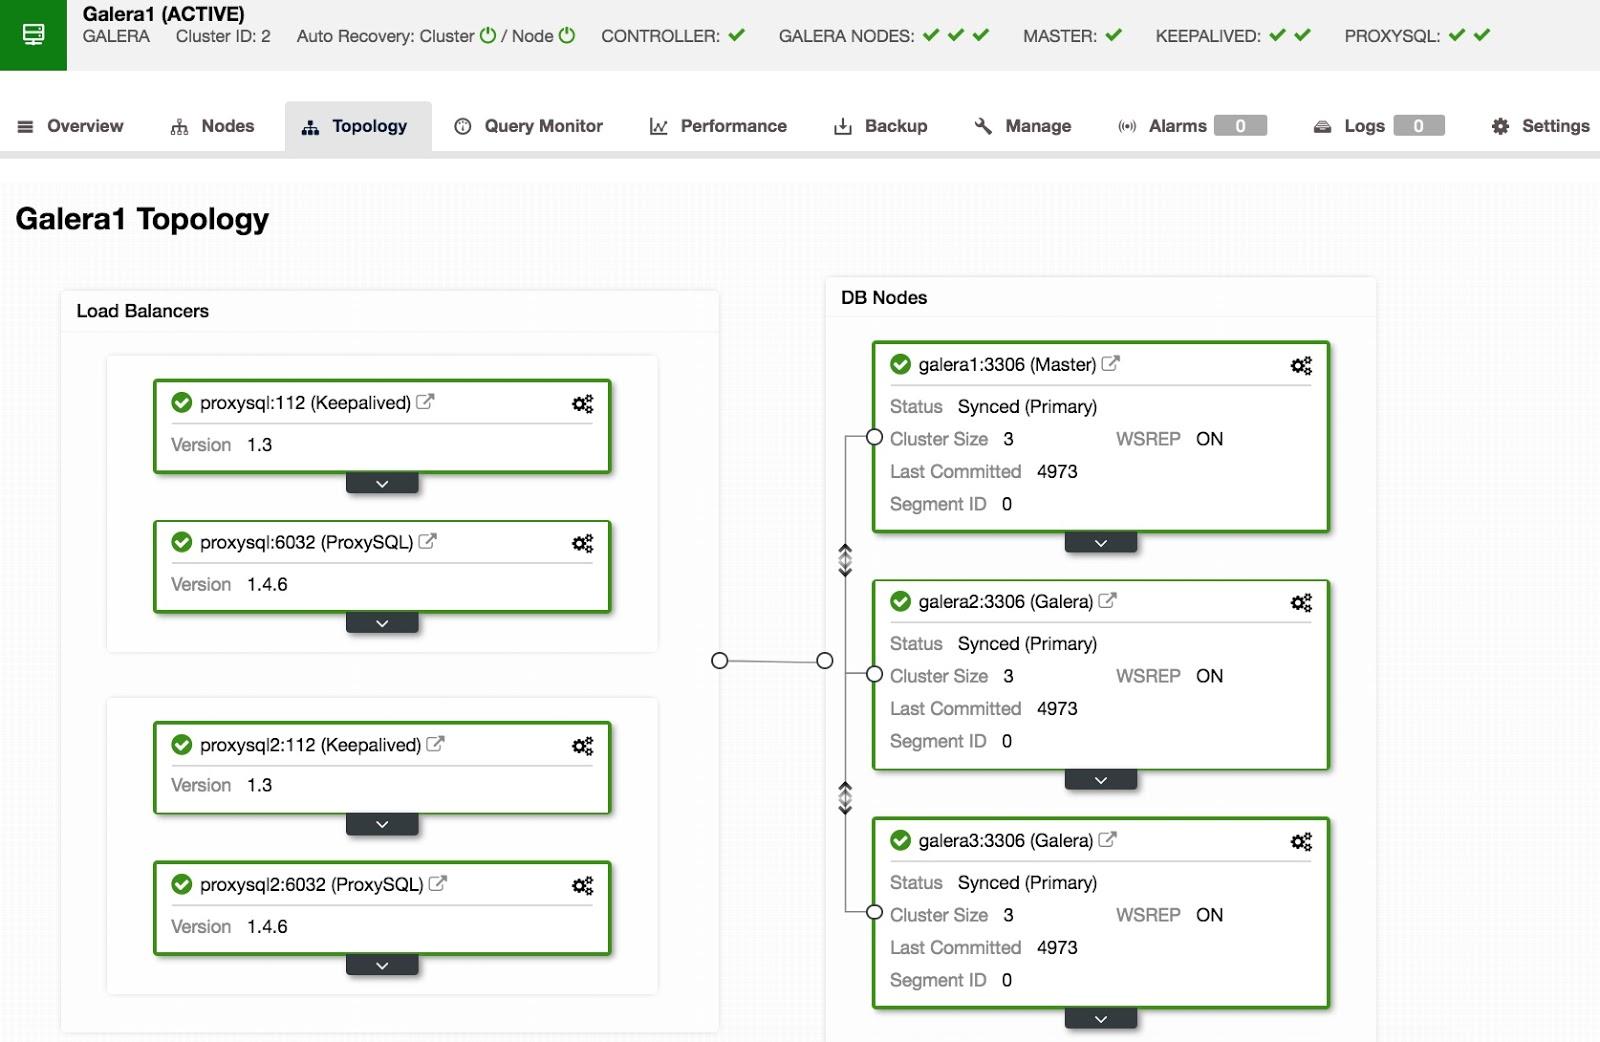
We can view database nodes and the load balancers (E.g. ProxySQL).
To conclude, the Topology View can be quite useful to quickly visualize how our cluster is replicating.
You can try this and many other features with the free trial version.