blog
Tips for Monitoring MariaDB Cluster

In previous blog posts, we have covered topics for Monitoring Your Galera Cluster whether it’s MySQL or MariaDB. Although the technology versions don’t differ much, MariaDB Cluster has some major changes since version 10.4.2. In this version it supports Galera Cluster 4 and has some great new features that we will look at in this blog post.
For beginners that are not yet familiar with MariaDB Cluster, is a virtually synchronous multi-master cluster for MariaDB. It is available on Linux only, and only supports the XtraDB/InnoDB storage engines (although there is experimental support for MyISAM – see the wsrep_replicate_myisam system variable).
The software is a bundled technology which is powered by MariaDB Server, MySQL-wsrep patch for MySQL Server and MariaDB Server developed by Codership (supports Unix-like OS), and the Galera wsrep provider library.
You might compare this product with MySQL Group Replication or with the MySQL InnoDB Cluster, which aims to provide high availability. (Though they differ diversely on principles and approaches for providing HA.)
Now that we’ve covered the basics, in this blog we are going to provide tips we think beneficial when monitoring your MariaDB Cluster.
The Essentials of MariaDB Cluster
When you start using MariaDB Cluster you have to identify what exactly is your purpose and why you have chosen MariaDB Cluster in the first place. First you have to digest what are the features and their benefits when using MariaDB Cluster. The reason to identify these is because those are essentially what have to be monitored and checked in order for you to determine performance, normal health conditions, and if it’s running in accordance to your plans.
Essentially, it is identified as no slave lag, no lost transactions, read scalability, and smaller client latencies. Then questions can arise like, how does it make no slave lag, or lost transactions? How does it make read being scalable or with smaller latencies in the client side? These areas are one of the key areas you need to look and monitor especially for heavy production usage.
Although the MariaDB Cluster itself can be customized accordingly. Applying changes to the default behavior such as pc.weight or pc.ignore_quorum, or even using multicast with UDP for a large number of nodes, can impact the way you monitor the nature of your MariaDB Cluster. But on the other hand, the most essential status variables are usually your silver lining here knowing the state and flow of your cluster is doing fine or its degrading showing a possible problem leading to a catastrophic failure beforehand.
Always Monitor Your Server Activity (Network, Disk, Load, Memory, & CPU)
Monitoring your server activity can also be a complex task if you have a very complicated stack that is intertwined in your database architecture. However, for a MariaDB Cluster, it’s always best to have your nodes always set up as dedicated yet simple as possible. Although that doesn’t limit you from using all the spare resources, below are the common key areas you have to look into.
Network
Galera Cluster 4 features streaming replication as one of the key features and changes from the previous version. Since streaming replication addresses the drawbacks it had in the previous releases but allows it to manage more than 2GB of write-sets since Galera Cluster 4. This allows big transactions to be fragmented and is highly recommended to enable this during session level alone. This means, monitoring your network activity is very important and crucial to the normal activity of your MariaDB Cluster. This will help you identify which node did have the most or highest network traffic based on the period of time.
So how will that help you improve where nodes with the highest network traffic have been identified? Well, this provides you room for improvement with your database topology or the architectural layer of your database cluster. Using load balancers or a database proxy allows you to configure proactively your database traffic especially when determining which specific writes shall go to a specific node. Let’s say, out of the 3 nodes, one of them is more capable of handling large and big queries due to differences with the hardware specifications. This allows you to manage more of your capex and improve your capacity planning as demands on a specified period of time changes.
Disk
As network activity matters also with your disk performance especially during flushing time. It’s also best to determine how committed time and retrieval performs when high peak load is reached. There are times that you stock up your database host with not only being dedicated to a Galera Cluster activity but also mash up with other tools like docker, SQL proxies such as ProxySQL or MaxScale. This gives you control with low load servers and allows you to use the spare resources available that can be utilized for other beneficial purposes especially to your database architecture stack. Once you are able to determine which node upon monitoring has the lowest load but still capable of managing its disk IO utilization, then you can select the specific node while watching over the time passes by. Again, this still gives you better management with your capacity planning.
CPU, Memory, and Load Activity
Let me briefly put these three areas to look upon when monitoring. In this section, it’s always best you have better observability of the following areas at once. It’s quicker and easier to understand, especially ruling out a performance bottleneck or identifying bugs that cause your nodes to either stall and that can also affect the other nodes and the possibility of going down the cluster.
So how does CPU, memory, and load activity upon monitoring help your MariaDB Cluster? Well, as what I have mentioned above, those are one of the few things yet a big factor for daily routine checks. Now, this also helps you identify if these are periodical or random occurrences. If periodical, it might be related to backups running in one of your Galera nodes, or it’s a massive query that requires optimization. For example, bad queries with no proper indexes, or in-balance usage of data retrieval such as doing a string comparison for such a large string. That can be undeniably inapplicable for OLTP type databases such as MariaDB Cluster especially if it’s really the nature and requirements of your application. Better use other analytical tools such as MariaDB Columnstore, or other third-party analytic processing tools (Apache Spark, Kafka, or MongoDB, etc.) for large string data retrieval and/or string matching.
So with all these key areas being monitored, the question is, how it shall be monitored? It has to be monitored at least per-minute. With refined monitoring, i.e. per-second of collective metrics can be resource intensive and much greedy in terms of your resources. Although half-a-minute of collectivity is acceptable especially if your data and RPO (recovery point objective) is very low, so you need more granular and real-time data metrics. It is very important that you are able to oversee the whole picture of your database cluster. Aside from this, it’s also best and important that whenever what metrics you are monitoring, you have the right tool to tap your attention when things are in danger or even just warnings. Using the proper tool such as ClusterControl helps you manage these key areas to be monitored. I’m using here a free version or community edition of ClusterControl and helps me monitor my nodes without any hassle from installation up to the monitoring of nodes by just a few clicks. For example, see the screenshots below:
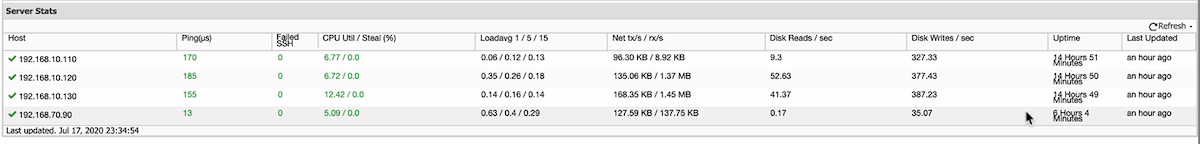
The view is a more refined and quick overview of what’s happening currently. A more granular graph can be used as well,
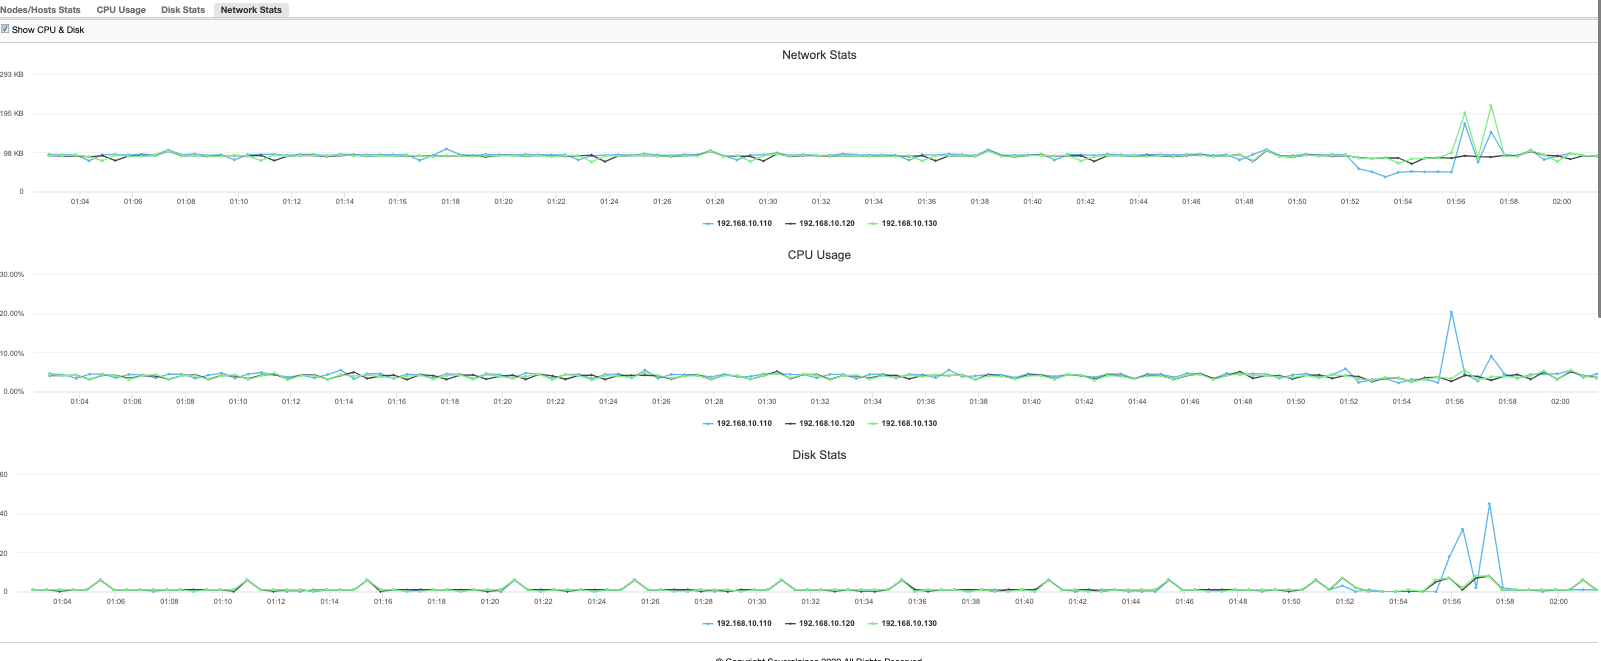
or with a more powerful and rich data model which also supports query language can provide you analysis of how your MariaDB Cluster performs based on historical data comparing its performance in a timely manner. For example,
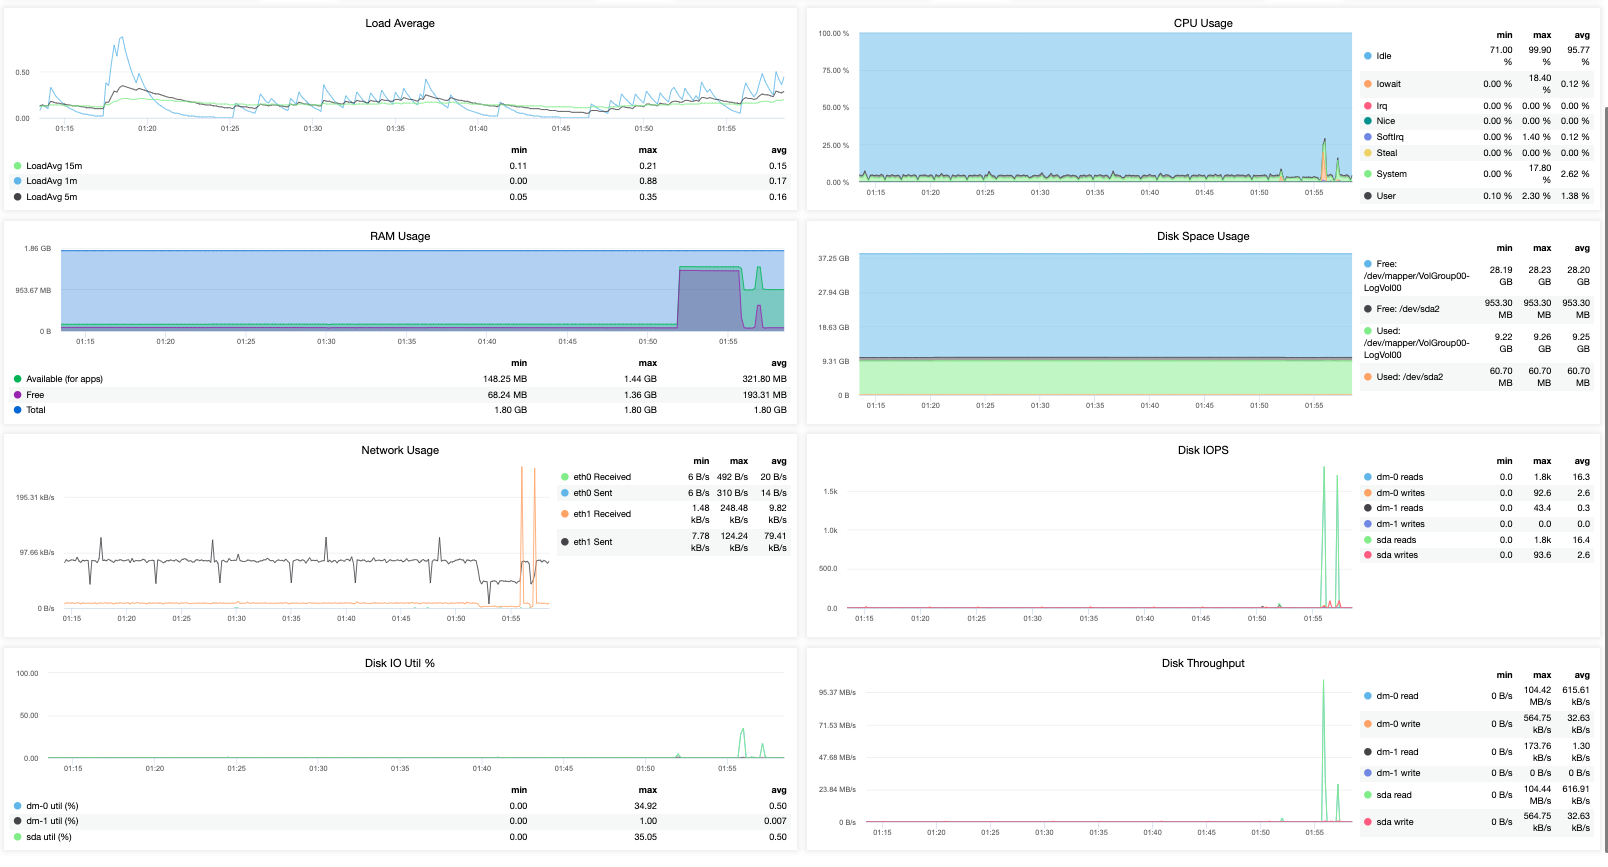
That just provides you more visible metrics. So you see how important it really is to have the right tool when monitoring your MariaDB Cluster.
Ensure Collective Monitoring of Your MariaDB Cluster Statistic Variables
From time to time, it cannot be inevitable that MariaDB Cluster versions will produce new stats to monitor or enhance the nature of monitoring the database by providing more status variables and refine values to look upon. As what I have mentioned above, I am using ClusterControl to monitor my nodes in this example blog. However, that doesn’t mean it’s the best tool out there. I mean PMM from Percona is very rich when it comes to collective monitoring for every statistic variable that whenever MariaDB Cluster has newer statistic variables to offer, you can leverage this and also change it as PMM is an open-source tool. It’s a great advantage that you also have all the visibility of your MariaDB Cluster as every aspect counts especially in a production-based database that caters hundreds of thousands of requests per minute.
But let’s get more specific into the problem here. What are these statistical variables to look into? There’s many to count on for a MariaDB Cluster but focusing again on the features and benefits that we believe you use the MariaDB Cluster what it has to offer, then we’ll focus into that.
Galera Cluster – Flow Control
The flow control of your MariaDB Cluster provides you the overview of how the replication health performs on all over the cluster. The replication process in Galera Cluster uses a feedback mechanism, which means it signals all over the nodes within that cluster and flags whether the node has to pause or resume replication according to its needs. This also prevents any node from lagging too far while the others are applying the incoming transactions. This is how the flow control serves as its function within Galera. Now, this has to be seen and not to be overlooked when monitoring your MariaDB Cluster. This, as mentioned in one of the benefits upon using MariaDB Cluster is that the avoidance of having slave lag. Although that’s too naive to understand about the flow control and the slave lag, but with flow control, it will impact your Galera cluster’s performance when there’s a lot of queue and commits or flushing of pages to the disk goes very low for such disk issues or it’s just the query running is a bad query. If you’re a beginner of how Galera works, you might be interested reading this external post about what is flow control in Galera.
Bytes Sent/Received
The bytes sent or received correlates with the networking activity and even is one of the key areas to look side-by-side with flow control. This allows you to determine which node is the most impacted or attributing to the performance issues that are suffering within your Galera Cluster. It is very important as you can check if there can be any degradation in terms of hardware such as your network device or the underlying storage device for which syncing of dirty pages can take too much time to be done.
Cluster Load
Well, this is more of the database activity of how much changes or data retrieval have been queried or done so far since the server’s uptime. It helps you rule out what kind of queries are mostly affecting your database cluster performance. This allows you to provide room for improvement especially on balancing the load of your database requests. Using ProxySQL helps you out here with a more refined and granular approach for query routing. Although MaxScale also offers this feature, ProxySQL has more granularity although it also serves some performance impact or cost as well. Impact comes when you only have one ProxySQL as the SQL proxy to work out the query routing and it can struggle when high traffic is on-going. Having cost, if you add more ProxySQL nodes to balance more of the traffic which an underlying KeepAlived. Although, this is a perfect combo but it can be run at a low-cost until needed. However, how will you be able to determine if needed, right? That’s the question remains here, so a keen eye to monitor these key areas is very important, not only for observability, but also for improvement of the performance of your database cluster as time goes by.
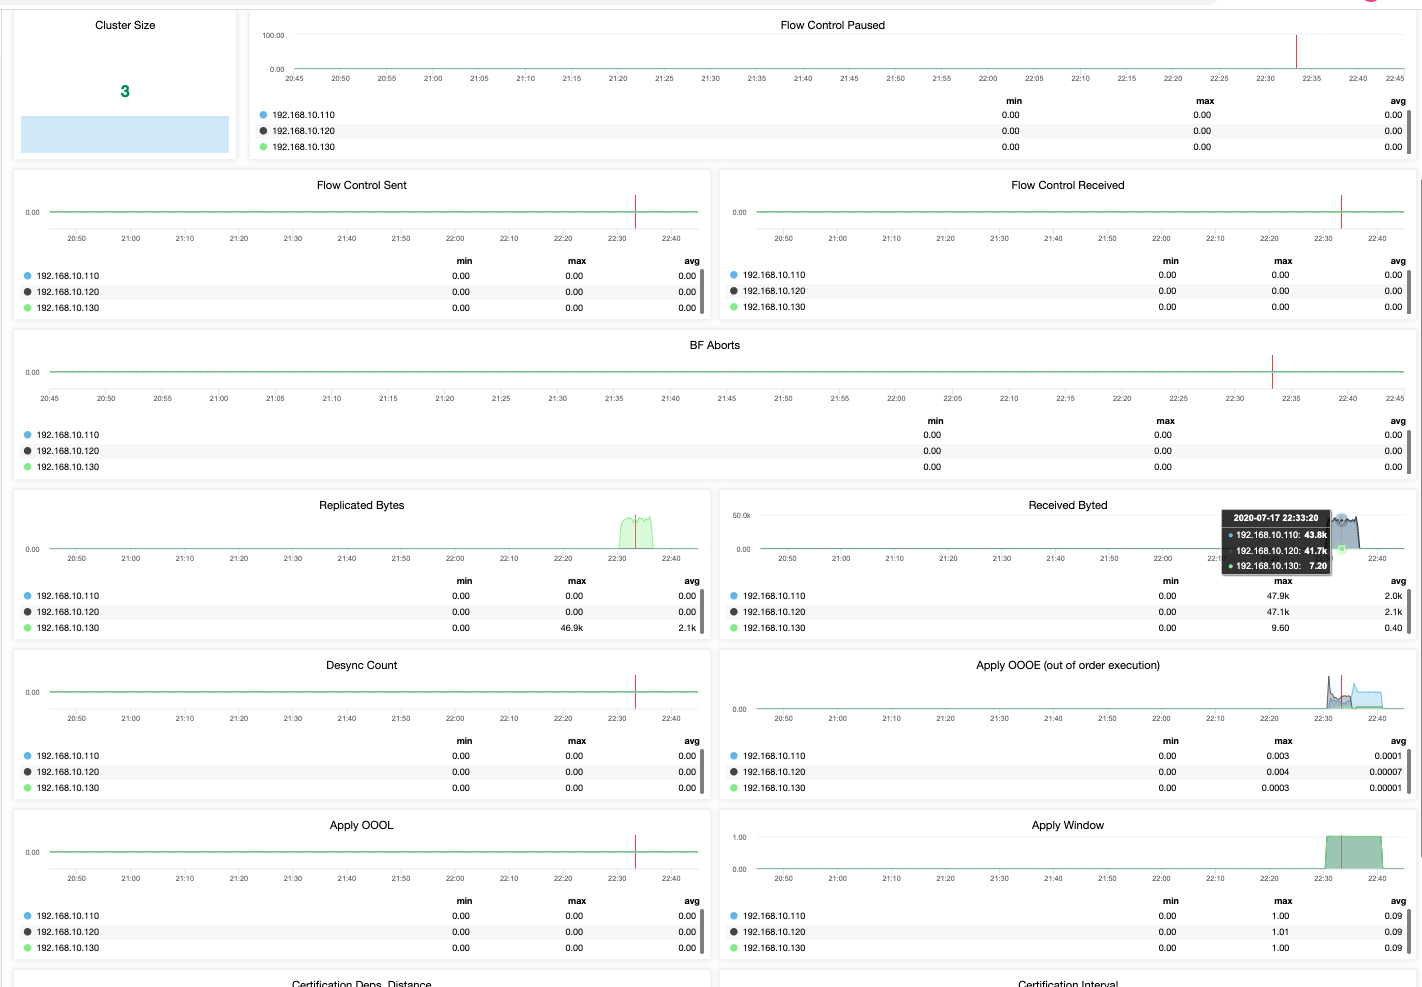
As such, there are tons of variables to look upon in a MariaDB Cluster. The most important thing here you have to take into account is the tool you are using for monitoring your database cluster. As mentioned earlier, I prefer using the free version license of ClusterControl (Community Edition) here in this blog as it provides me more ways with flexibility to look upon in a Galera Cluster. See the example below,
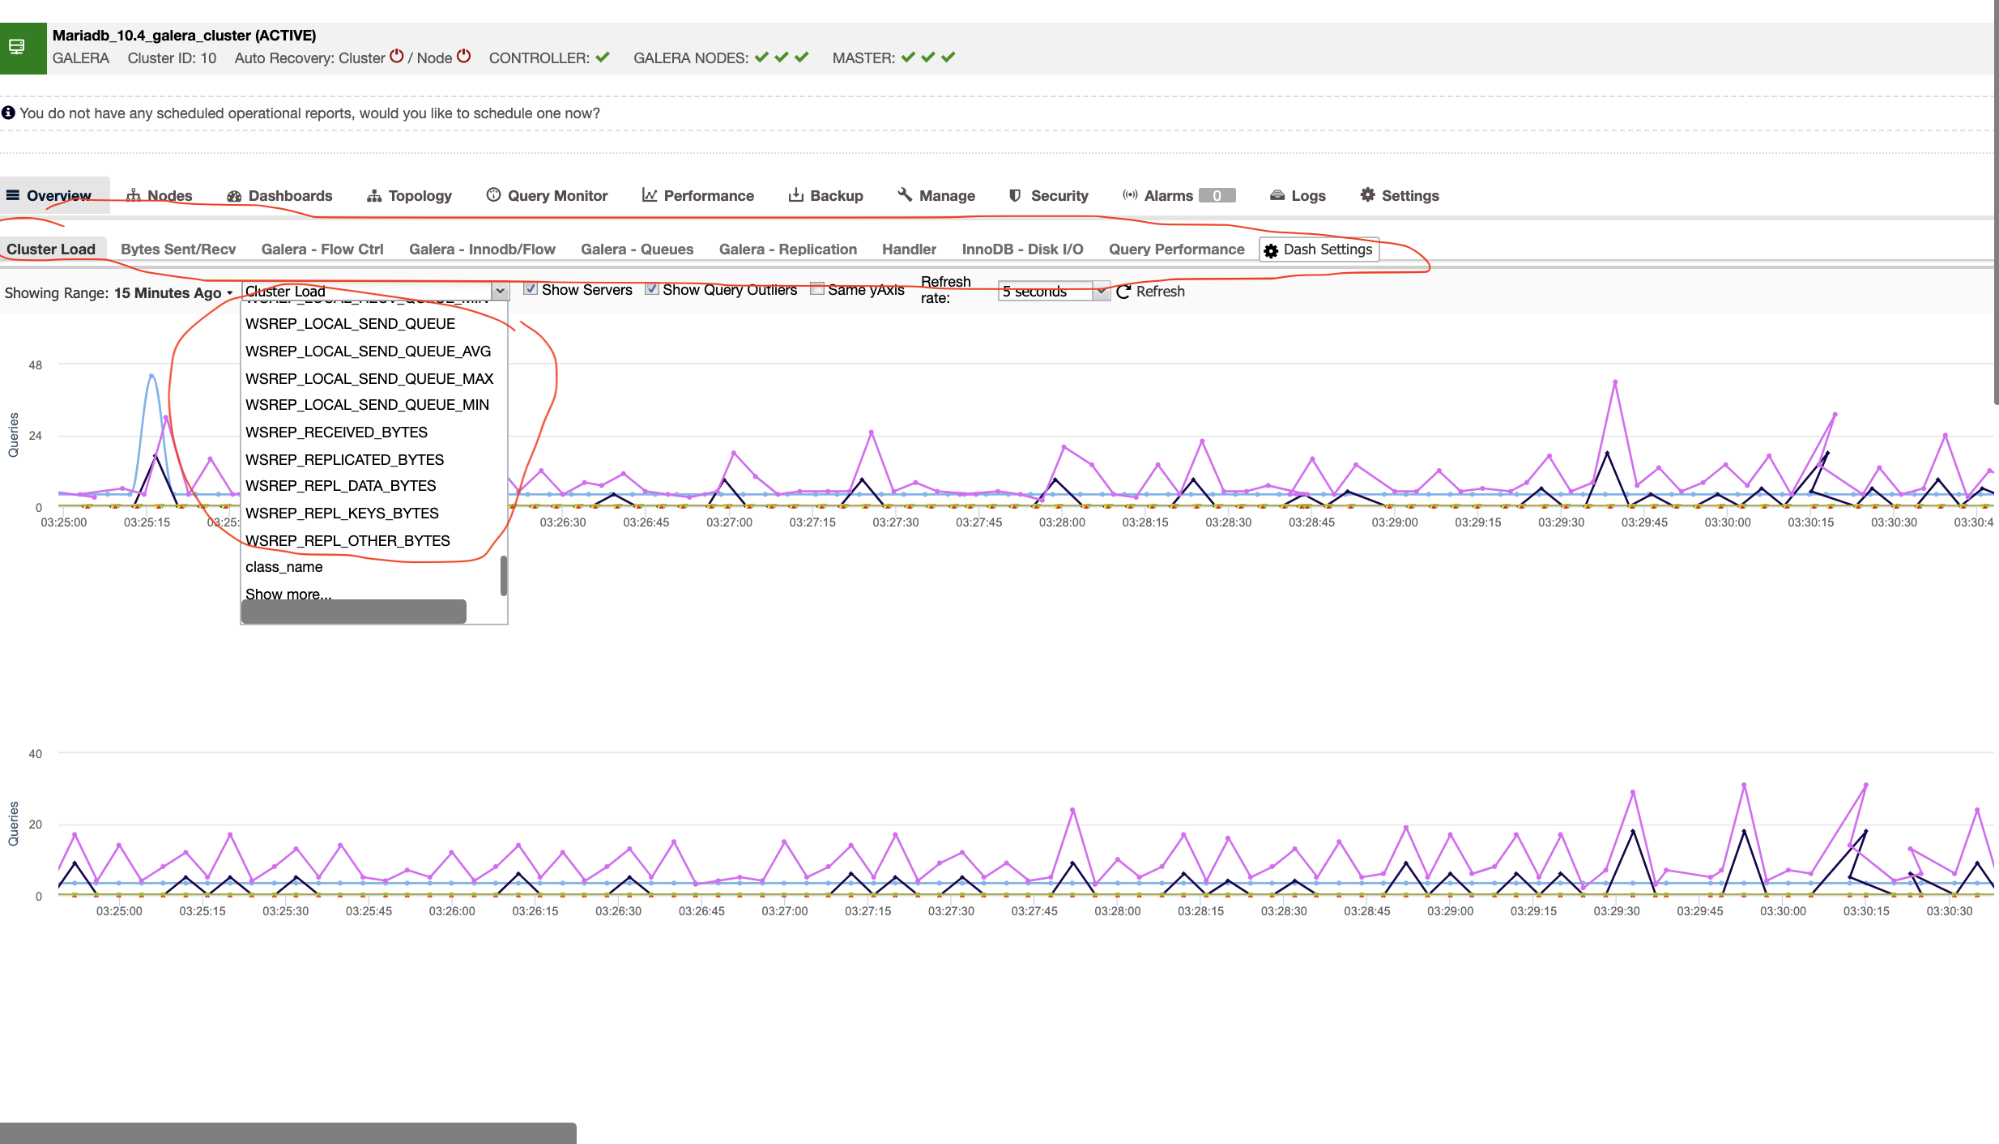
I have marked or circled in red those tabs that allow me to visually oversee the health of my MariaDB Cluster. Let’s say, if your application is greedy over using streaming replication from time to time and it sends a large number of fragments (large network transfer) for cluster inter-activity, it’s best to determine how well your nodes can handle the stress. Especially during stress testing before pushing specific changes in your application, it’s always best to try and test to determine the capacity management of your application product and determine if your current database nodes and design can handle the load of your application requirements.
Even on a community edition of the ClusterControl, I am able to gather granular and more refined results of the health of my MariaDB Cluster. See below,
This is how you shall approach the monitoring of your MariaDB Cluster. A perfect visualization is always easier and quicker to manage. When things go south, you cannot afford to lose your productivity and also the downtime can impact your business. Although having free does not provide you the luxury and comfort when managing high traffic databases, having alarms, notifications, and database management in one area is a-walk-in-the-park add-ons that ClusterControl can do.
Conclusion
MariaDB Cluster is not as simple to monitor as compared with the traditional asynchronous MySQL/MariaDB master-slave setups. It works differently and you must have the right tools to determine what’s going on and what’s going into your database cluster. Always prepare your capacity planning ahead before running your MariaDB Cluster without proper monitoring beforehand. It’s always best that your database load and activity is known prior to a catastrophic event.