blog
How to Troubleshoot MySQL Database Issues

As soon as you start running a database server and your usage grows, you are exposed to many types of technical problems, performance degradation, and database malfunctions. Each of these could lead to much bigger problems, such as catastrophic failure or data loss. It’s like a chain reaction, where one thing can lead to another, causing more and more issues. Proactive countermeasures must be performed in order for you to have a stable environment as long as possible.
In this blog post, we are going to look at a bunch of cool features offered by ClusterControl that can greatly help us troubleshoot and fix our MySQL database issues when they happen.
Database Alarms and Notifications
For all undesired events, ClusterControl will log everything under Alarms, accessible on the Activity (Top Menu) of ClusterControl page. This is commonly the first step to start troubleshooting when something goes wrong. From this page, we can get an idea on what is actually going on with our database cluster:
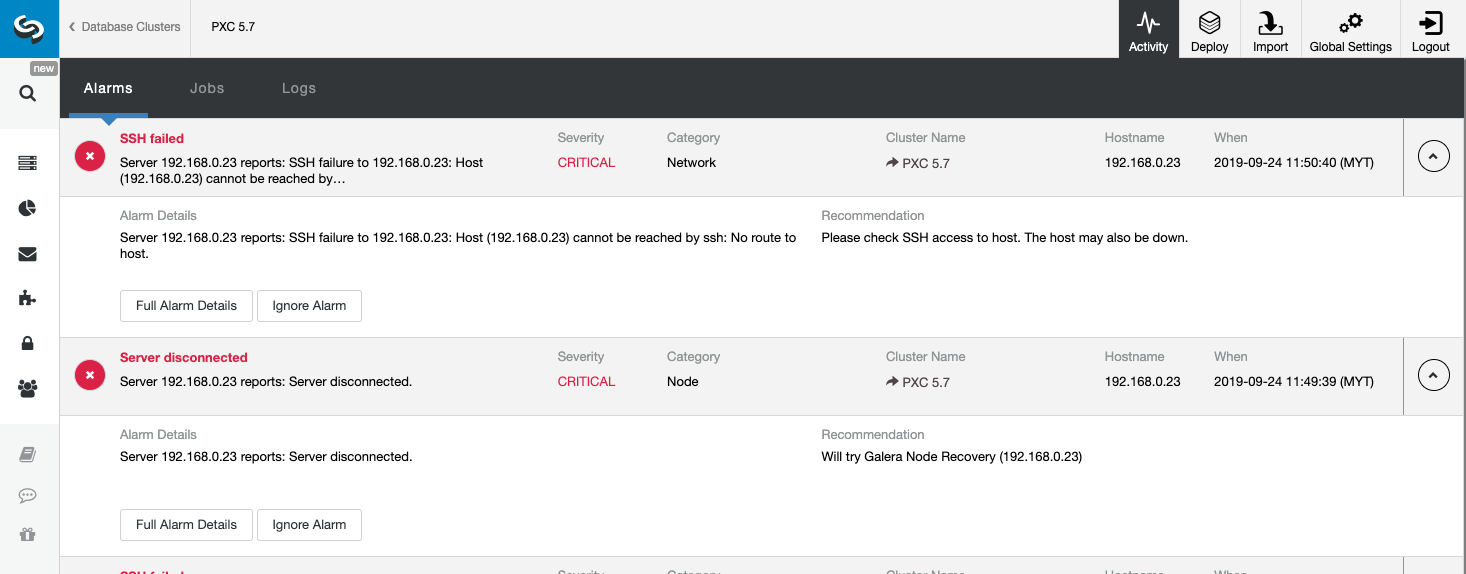
The above screenshot shows an example of a server unreachable event, with severity CRITICAL, detected by two components, Network and Node. If you have configured the email notifications setting, you should get a copy of these alarms in your mailbox.
When clicking on the “Full Alarm Details,” you can get the important details of the alarm like hostname, timestamp, cluster name and so on. It also provides the next recommended step to take. You can also send out this alarm as an email to other recipients configured under the Email Notification Settings.
You may also opt to silence an alarm by clicking the “Ignore Alarm” button and it will not appear in the list again. Ignoring an alarm might be useful if you have a low severity alarm and know how to handle or work around it. For example if ClusterControl detects a duplicate index in your database, where in some cases would be needed by your legacy applications.
By looking at this page, we can obtain an immediate understanding of what is going on with our database cluster and what the next step is to do to solve the problem. As in this case, one of the database nodes went down and became unreachable via SSH from the ClusterControl host. Even a beginner SysAdmin would now know what to do next if this alarm appears.
Centralized Database Log Files
This is where we can drill down what was wrong with our database server. Under ClusterControl -> Logs -> System Logs, you can see all log files related to the database cluster. As for MySQL-based database cluster, ClusterControl pulls the ProxySQL log, MySQL error log and backup logs:
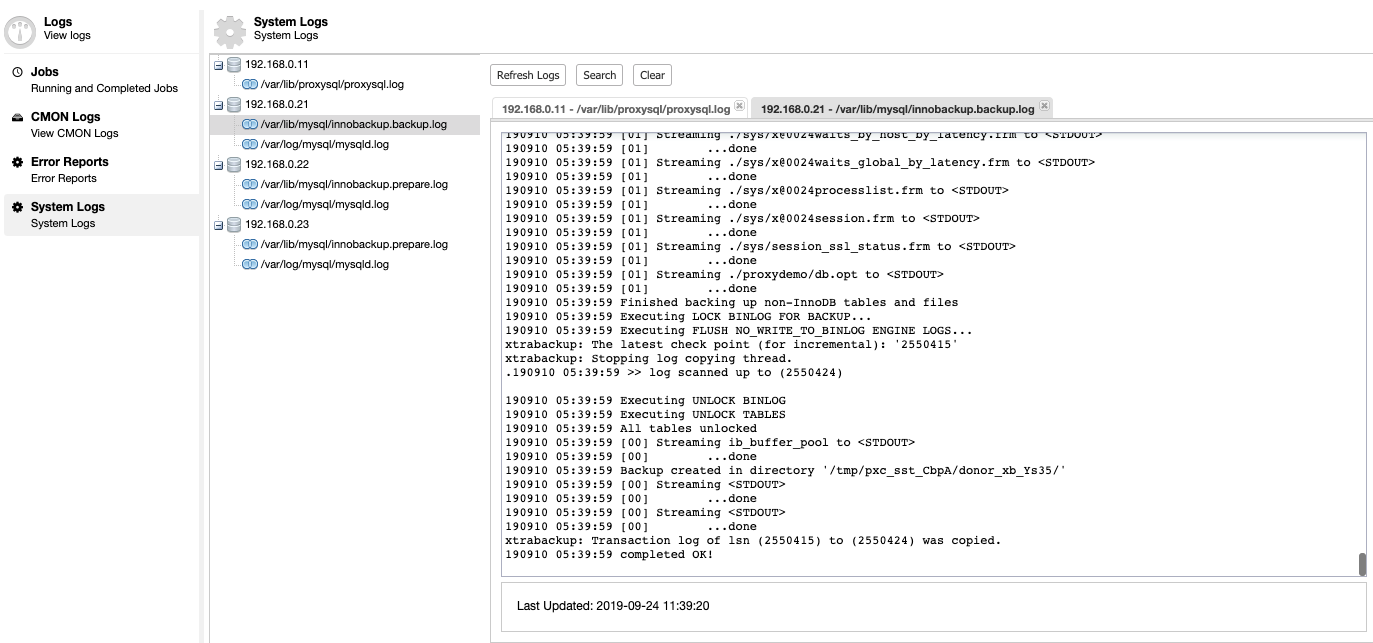
Click on “Refresh Log” to retrieve the latest log from all hosts that are accessible at that particular time. If a node is unreachable, ClusterControl will still view the outdated log in since this information is stored inside the CMON database. By default ClusterControl keeps retrieving the system logs every 10 minutes, configurable under Settings -> Log Interval.
ClusterControl will trigger the job to pull the latest log from each server, as shown in the following “Collect Logs” job:
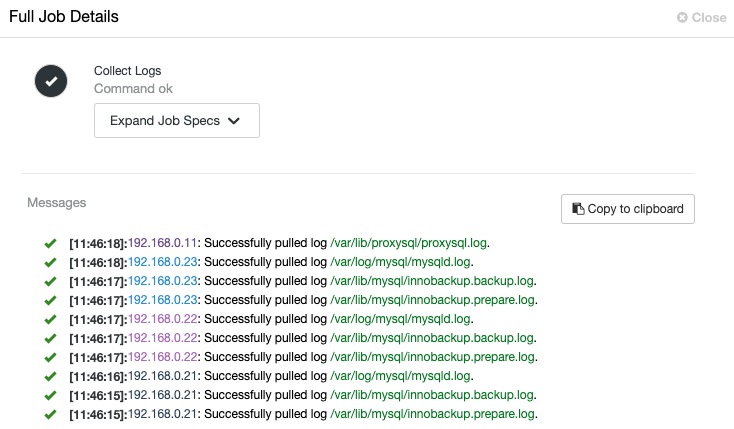
A centralized view of log file allows us to have faster understanding on what went wrong. For a database cluster which commonly involves multiple nodes and tiers, this feature will greatly improve the log reading where a SysAdmin can compare these logs side-by-side and pinpoint critical events, reducing the total troubleshooting time.
Web SSH Console
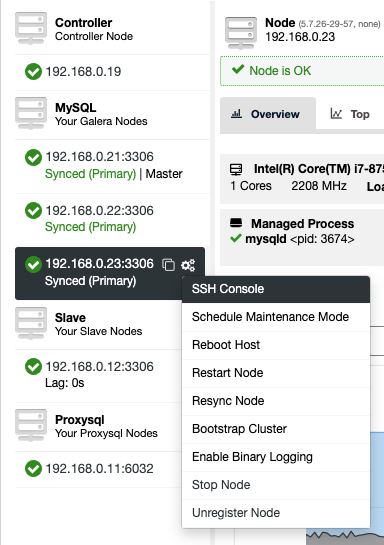
ClusterControl provides a web-based SSH console so you can access the DB server directly via the ClusterControl UI (as the SSH user is configured to connect to the database hosts). From here, we can gather much more information which allows us to fix the problem even faster. Everyone knows when a database issue hits the production system, every second of downtime counts.
To access the SSH console via web, simply pick the nodes under Nodes -> Node Actions -> SSH Console, or simply click on the gear icon for a shortcut:
Due to security concern that might be imposed with this feature, especially for multi-user or multi-tenant environment, one can disable it by going to /var/www/html/clustercontrol/bootstrap.php on ClusterControl server and set the following constant to false:
define('SSH_ENABLED', false);Refresh the ClusterControl UI page to load the new changes.
Database Performance Issues
Apart from monitoring and trending features, ClusterControl proactively sends you various alarms and advisors related to database performance, for example:
- Excessive usage – Resource that passes certain thresholds like CPU, memory, swap usage and disk space.
- Cluster degradation – Cluster and network partitioning.
- System time drift – Time difference among all nodes in the cluster (including ClusterControl node).
- Various other MySQL related advisors:
- Replication – replication lag, binlog expiration, location and growth
- Galera – SST method, scan GRA logfile, cluster address checker
- Schema check – Non-transactional table existance on Galera Cluster.
- Connections – Threads connected ratio
- InnoDB – Dirty pages ratio, InnoDB log file growth
- Slow queries – By default ClusterControl will raise an alarm if it finds a query running for more than 30 seconds. This is of course configurable under Settings -> Runtime Configuration -> Long Query.
- Deadlocks – InnoDB transactions deadlock and Galera deadlock.
- Indexes – Duplicate keys, table without primary keys.
Check out the Advisors page under Performance -> Advisors to get the details of things that can be improved as suggested by ClusterControl. For every advisor, it provides justifications and advice as shown in the following example for “Checking Disk Space Usage” advisor:
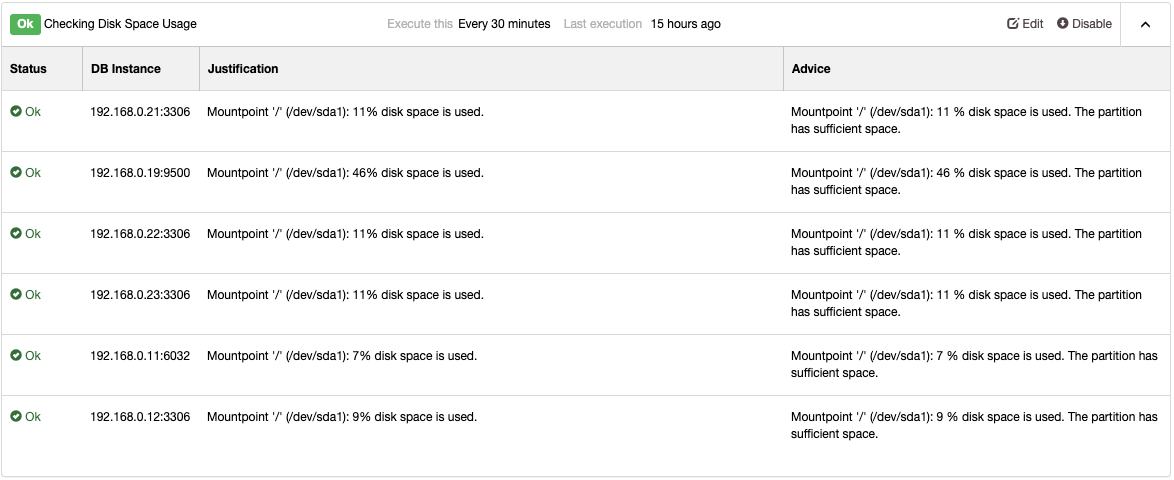
When a performance issue occurs you will get “Warning” (yellow) or “Critical” (red) status on these advisors. Further tuning is commonly required to overcome the problem. Advisors raise alarms, which means, users will get a copy of these alarms inside the mailbox if Email Notifications are configured accordingly. For every alarm raised by ClusterControl or its advisors, users will also get an email if the alarm has been cleared. These are pre-configured within ClusterControl and require no initial configuration. Further customization is always possible under Manage -> Developer Studio. You can check out this blog post on how to write your own advisor.
ClusterControl also provides a dedicated page in regards to database performance under ClusterControl -> Performance. It provides all sorts of database insights following the best-practices like centralized view of DB Status, Variables, InnoDB status, Schema Analyzer, Transaction Logs. These are pretty self-explanatory and straightforward to understand.
For query performance, you can inspect Top Queries and Query Outliers, where ClusterControl highlights queries which performed significantly differ from their average query. We have covered this topic in detail in this blog post, MySQL Query Performance Tuning.
Database Error Reports
ClusterControl comes with an error report generator tool, to collect debugging information about your database cluster to help understand the current situation and status. To generate an error report, simply go to ClusterControl -> Logs -> Error Reports -> Create Error Report:
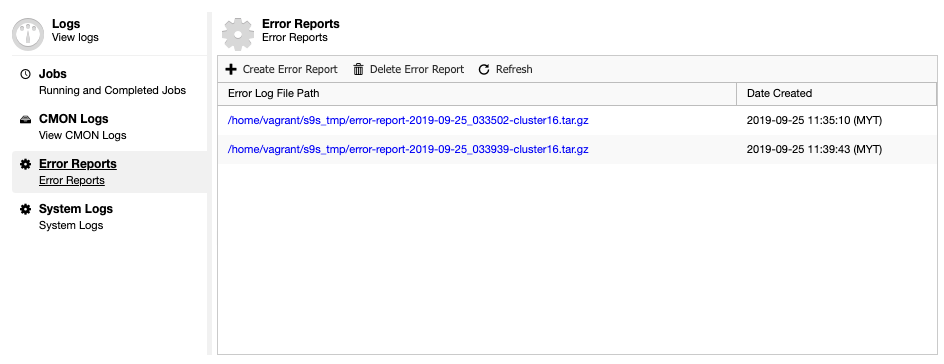
The generated error report can be downloaded from this page once ready. This generated report will be in TAR ball format (tar.gz) and you may attach it to a support request. Since the support ticket has the limit of 10MB of file size, if the tarball size is bigger than that, you could upload it into a cloud drive and only share with us the download link with proper permission. You may remove it later once we already got the file. You can also generate the error report via command line as explained in the Error Report documentation page.
In the event of an outage, we highly recommend that you generate multiple error reports during and right after the outage. Those reports will be very useful to try to understand what went wrong, the consequences of the outage, and to verify that the cluster is in-fact back to operational status after a disastrous event.
Conclusion
ClusterControl proactive monitoring, together with a set of troubleshooting features, provide an efficient platform for users to troubleshoot any kind of MySQL database issues. Long gone is the legacy way of troubleshooting where one has to open multiple SSH sessions to access multiple hosts and execute multiple commands repeatedly in order to pinpoint the root cause.
If the above mentioned features are not helping you in solving the problem or troubleshooting the database issue, you always contact the Severalnines Support Team to back you up. Our 24/7/365 dedicated technical experts are available to attend your request at anytime. Our average first reply time is usually less than 30 minutes.


