blog
Write Your First Advisor

Did you ever wonder what triggers the advice in ClusterControl that your disk is filling up? Or the advice to create primary keys on InnoDB tables if they don’t exist? These advisors are mini scripts written in the ClusterControl Domain Specific Language (DSL) that is a Javascript-like language. These scripts can be written, compiled, saved, executed and scheduled in ClusterControl. That is what the ClusterControl Developer Studio blog series will be about.
Today we will cover the Developer Studio basics and show you how to create your very first advisor where we will pick two status variables and give advice about their outcome.
The Advisors
Advisors are mini scripts that are executed by ClusterControl, either on-demand or after a schedule. They can be anything from simple configuration advice, warning on thresholds or more complex rules for predictions or cluster-wide automation tasks based on the state of your servers or databases. In general, advisors perform more detailed analysis, and produce more comprehensive recommendations than alerts.
The advisors are stored inside the ClusterControl database and you can add new or alter/modify existing advisors. We also have an advisor Github repository where you can share your advisors with us and other ClusterControl users.
The language used for the advisors is the so called ClusterControl DSL and is an easy to comprehend language. The semantics of the language can be best compared to Javascript with a couple of differences, where the most important differences are:
- Semicolons are mandatory
- Various numeric data types like integers and unsigned long long integers.
- Arrays are two dimensional and single dimensional arrays are lists.
You can find the full list of differences in the ClusterControl DSL reference.
The Developer Studio Interface
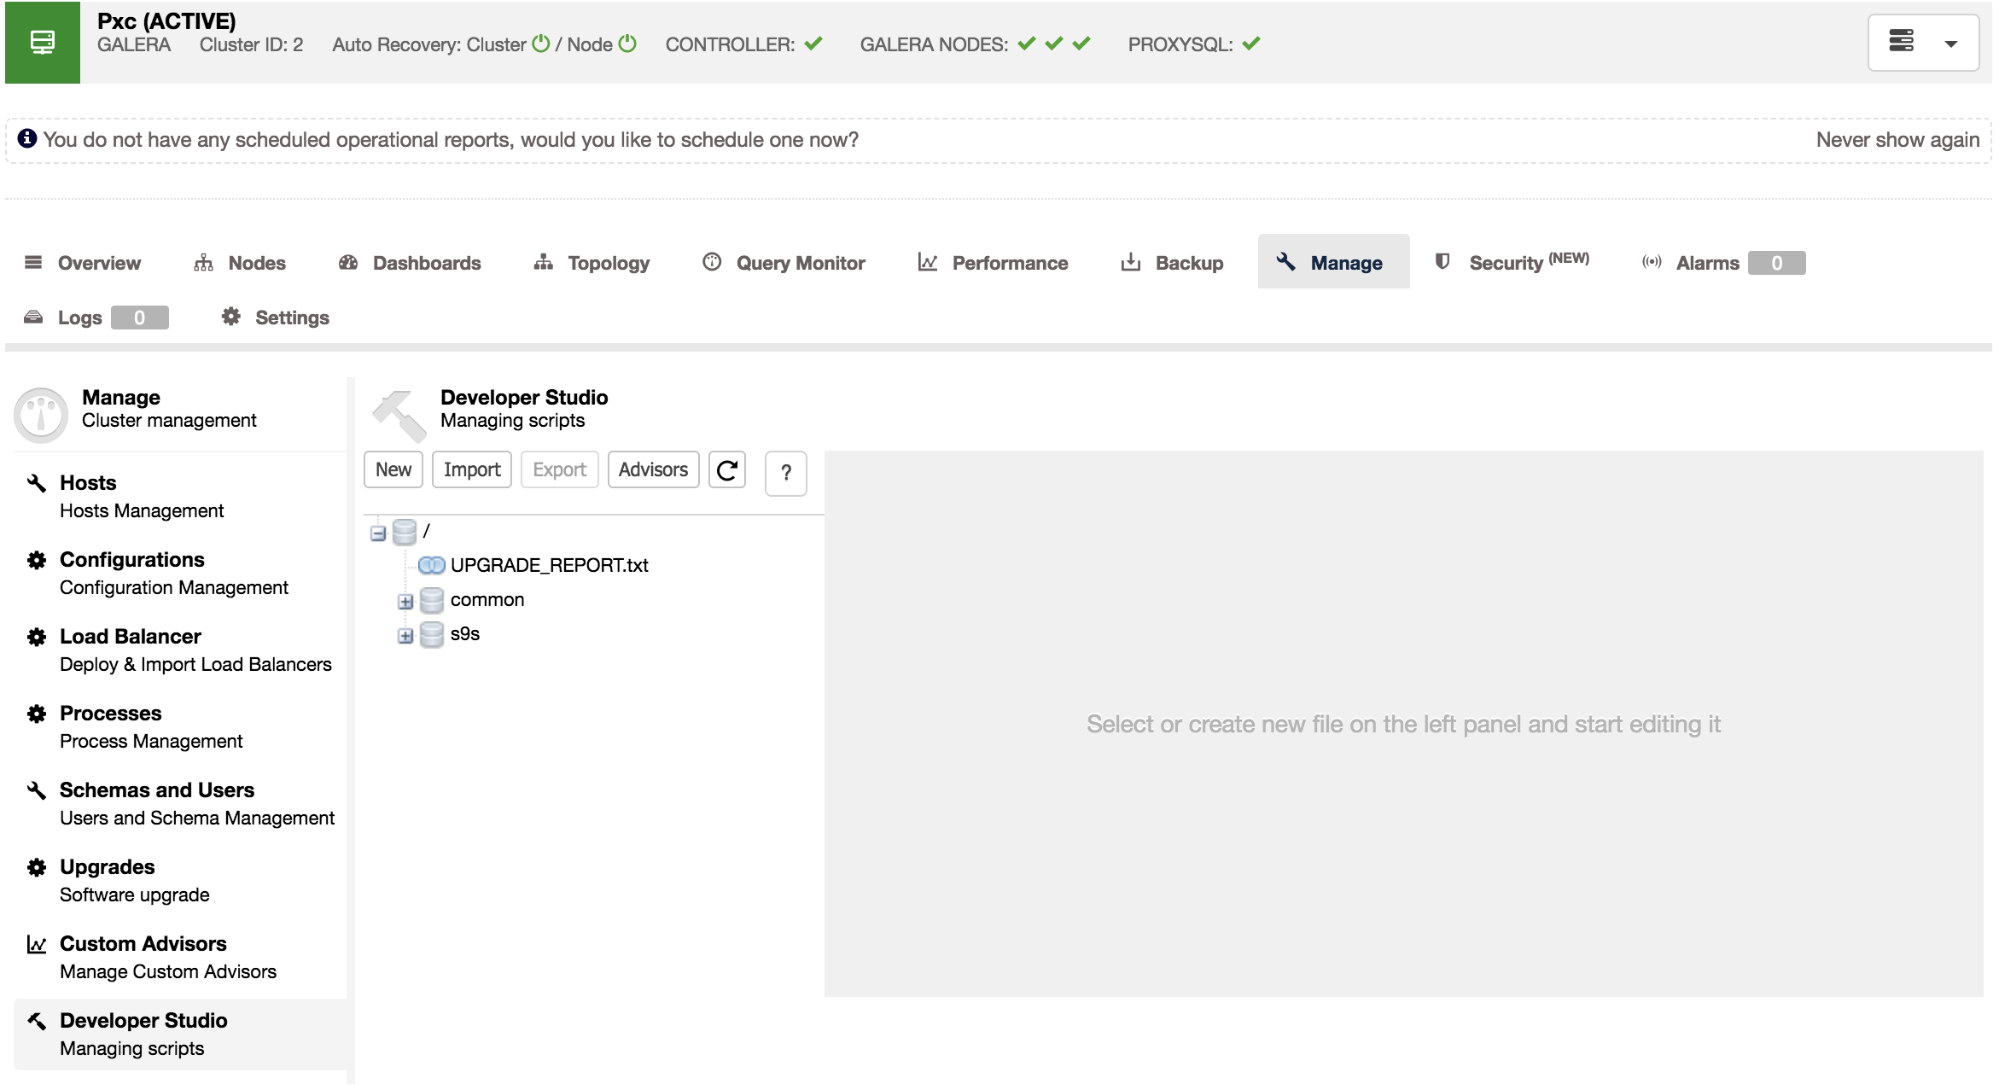
The Developer Studio interface can be found under Cluster > Manage > Developer Studio. This will open an interface like this:
Advisors
The advisors button will generate an overview of all advisors with their output since the last time they ran:
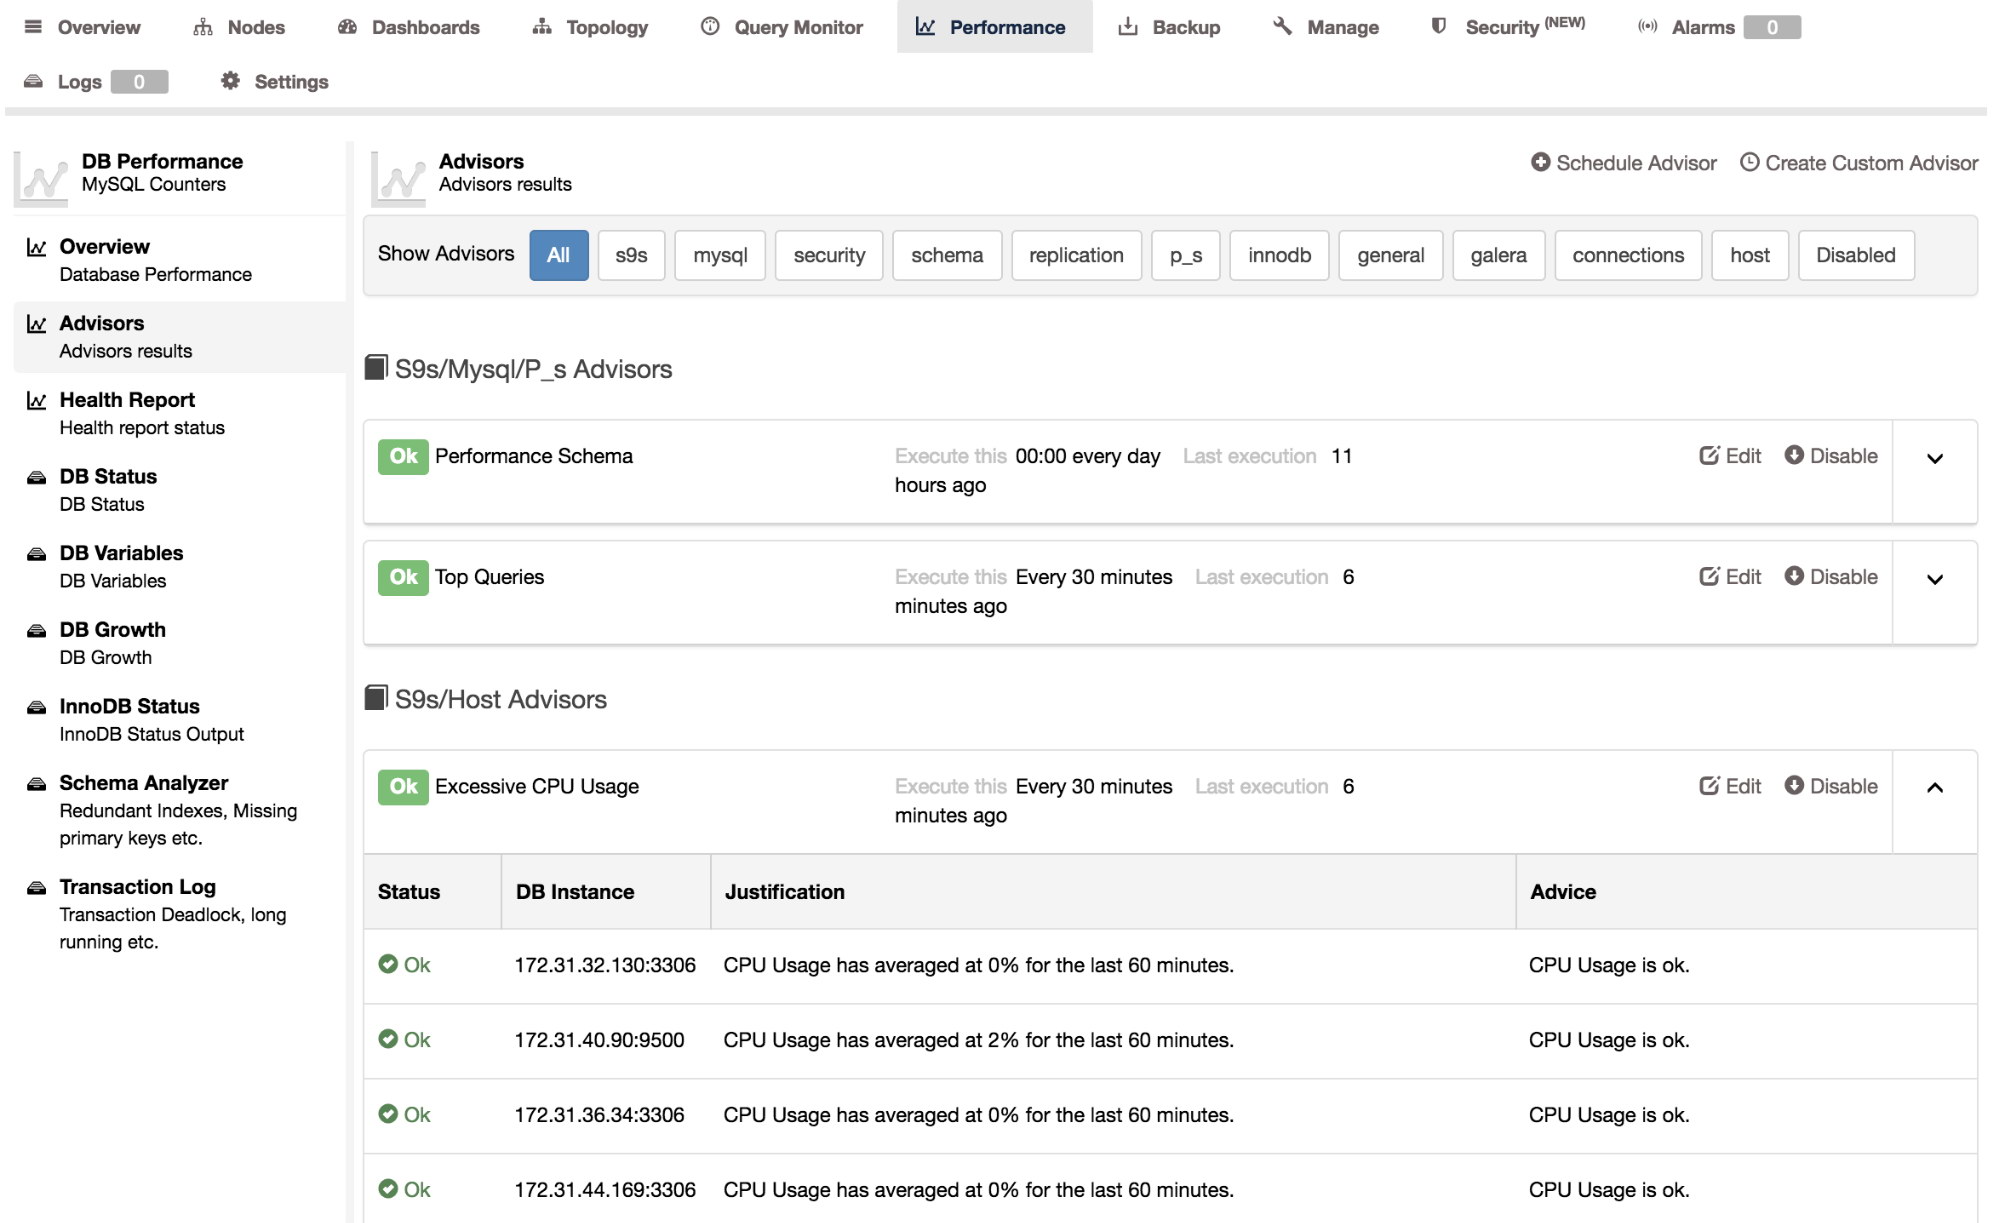
You can also see the schedule of the advisor in crontab format and the date/time since the last update. Some advisors are scheduled to run only once a day so their advice may no longer reflect the reality, for instance if you already resolved the issue you were warned about. You can manually re-run the advisor by selecting the advisor and run it. Go to the “compile and run” section to read how to do this.
Importing advisors
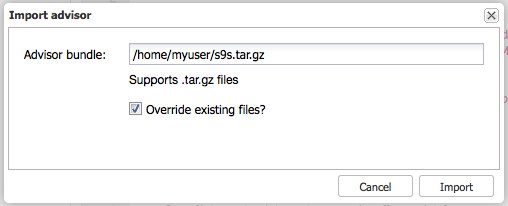
The Import button will allow you to import a tarball with new advisors in them. The tarball has to be created relative to the main path of the advisors, so if you wish to upload a new version of the MySQL query cache size script (s9s/mysql/query_cache/qc_size.js) you will have to make the tarball starting from the s9s directory.
Exporting advisors
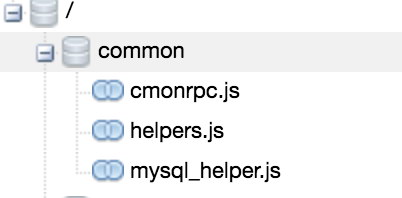
You can export the advisors or a part of them by selecting a node in the tree and pressing the Export button. This will create a tarball with the files in the full path of the structure presented. Suppose we wish to make a backup of the s9s/mysql advisors prior to making a change, we simply select the s9s/mysql node in the tree and press Export:
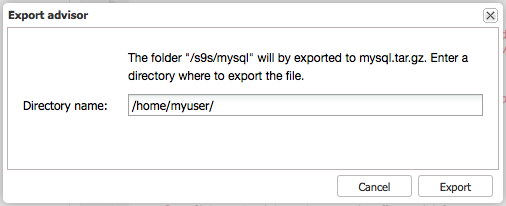
Note: make sure the s9s directory is present in /home/myuser/.
This will create a tarball called /home/myuser/s9s/mysql.tar.gz with an internal directory structure s9s/mysql/*
Creating a new advisor
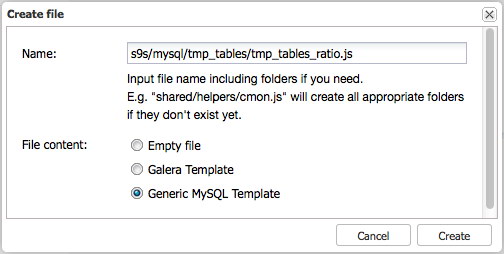
Since we have covered exports and imports, we can now start experimenting. So let’s create a new advisor! Click on the New button to get the following dialogue:
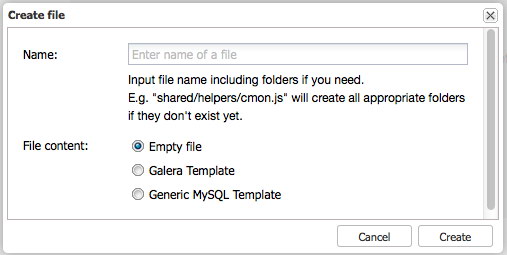
In this dialogue, you can create your new advisor with either an empty file or pre fill it with the Galera or MySQL specific template. Both templates will add the necessary includes (common/mysql_helper.js) and the basics to retrieve the Galera or MySQL nodes and loop over them.
Creating a new advisor with the Galera template looks like this:
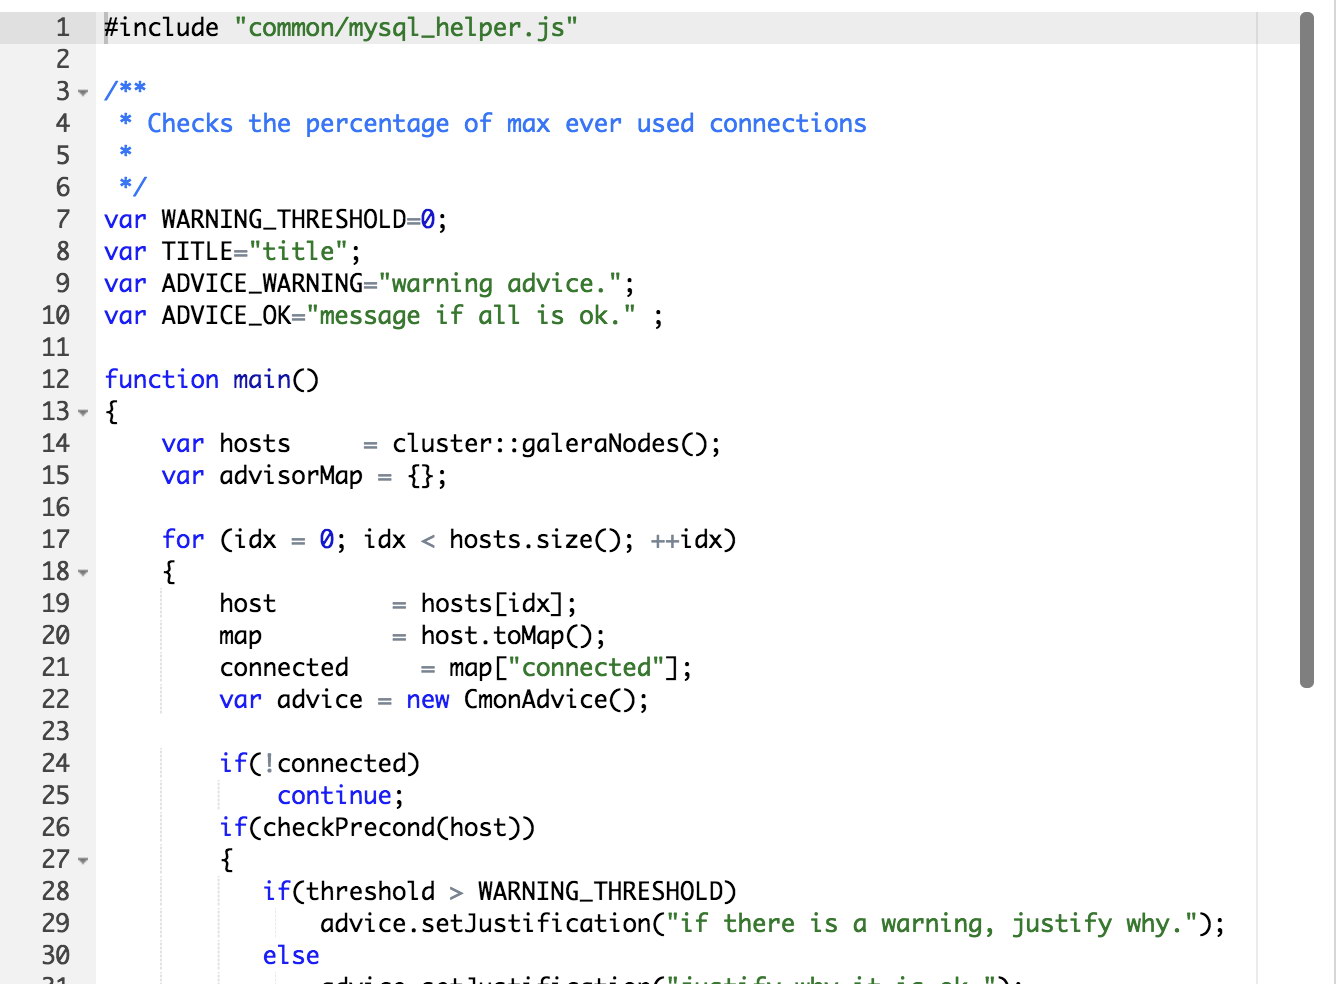
#include "common/mysql_helper.js"Here you can see that the mysql_helper.js gets included to provide the basis for connecting and querying MySQL nodes.
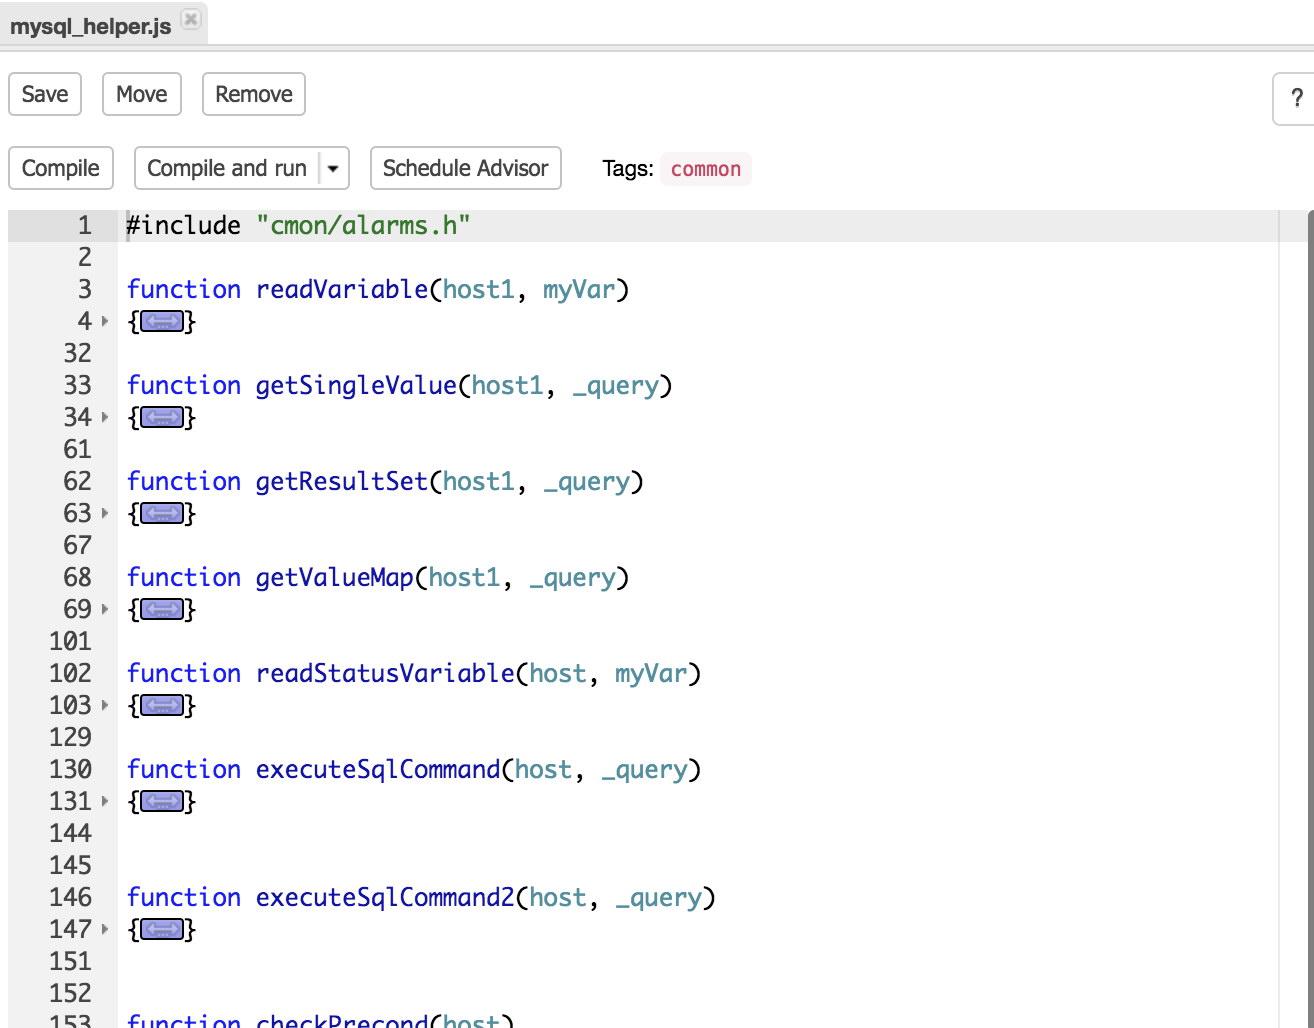
This file contains functions which you can invoke if needed like for example readVariable(
var WARNING_THRESHOLD=0;
…
if(threshold > WARNING_THRESHOLD)
The warning threshold is currently set to 0, meaning if the measured threshold is greater than the warning threshold, the advisor should warn the user. Note that the variable threshold is not set/used in the template yet as it is a kickstart for your own advisor.
var hosts     = cluster::Hosts();
var hosts     = cluster::mySqlNodes();
var hosts     = cluster::galeraNodes();
The statements above will fetch the hosts in the cluster and you can use this to loop over them. The difference between them is that the first statement includes all non-MySQL hosts (also the CMON host), the second all MySQL hosts and the last one only the Galera hosts. So if your Galera cluster has MySQL asynchronous read slaves attached, those hosts will not be included.
Other than that, these objects will all behave the same and feature the ability to read their variables, status and query against them.
Advisor buttons
Now that we have created a new advisor there are six new button available for this advisor:
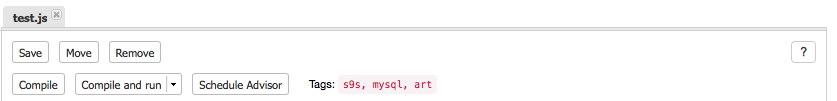
Save will save your latest modifications to the advisor (stored in the CMON database), Move will move the advisor to a new path and Remove will obviously remove the advisor.
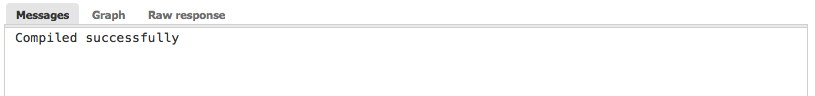
More interesting is the second row of buttons. Compiling the advisor will compile the code of the advisor. If the code compiles fine, you will see this message in the Messages dialogue below the code of the advisor:
While if the compilation failed, the compiler will give you a hint where it failed:

In this case the compiler indicates a syntax error was found on line 24.
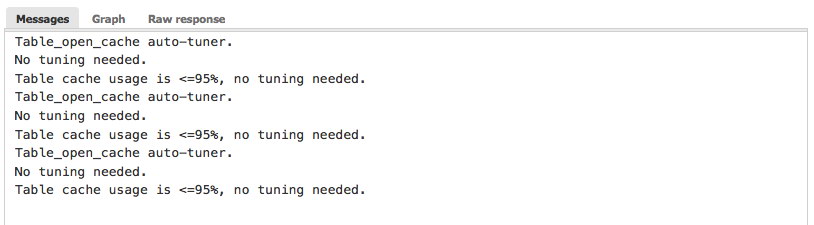
The compile and run button will not only compile the script but also execute it and its output will be shown in the Messages, Graph or Raw dialogue. If we compile and run the table cache script from the auto_tuners, we will get output similar to this:
Last button is the schedule button. This allows you to schedule (or unschedule) your advisors and add tags to it. We will cover this at the end of this post when we have created our very own advisor and want to schedule it.
My first advisor
Now that we have covered the basics of the ClusterControl Developer Studio, we can now finally start to create a new advisor. As an example we will create a advisor to look at the temporary table ratio. Create a new advisor as following:
The theory behind the advisor we are going to create is simple: we will compare the number of temporary tables created on disk against the total number of temporary tables created:
tmp_disk_table_ratio = Created_tmp_disk_tables / (Created_tmp_tables + Created_tmp_disk_tables) * 100;First we need to set some basics in the head of the script, like the thresholds and the warning and ok messages. All changes and additions are applied below:
var WARNING_THRESHOLD=20;
var TITLE="Temporary tables on disk ratio";
var ADVICE_WARNING="More than 20% of temporary tables are written to disk. It is advised to review your queries, for example, via the Query Monitor.";
var ADVICE_OK="Temporary tables on disk are not excessive." ;
We set the threshold here to 20 percent which is considered to be pretty bad already. But more on that topic once we have finalised our advisor.
Next we need to get these status variables from MySQL. Before we jump to conclusions and execute some “SHOW GLOBAL STATUS LIKE ‘Created_tmp_%’” query, there is already a function to retrieve the status variable of a MySQL instance, as what we described above where this function is located in common/mysql_helper.js:
statusVar = readStatusVariable(, We can use this function in our advisor to fetch the Created_tmp_disk_tables and Created_tmp_tables.
    for (idx = 0; idx < hosts.size(); ++idx)
    {
        host        = hosts[idx];
        map         = host.toMap();
        connected     = map["connected"];
        var advice = new CmonAdvice();
        var tmp_tables = readStatusVariable(host, ‘Created_tmp_tables’);
        var tmp_disk_tables = readStatusVariable(host, ‘Created_tmp_disk_tables’);
And now we can calculate the temporary disk tables ratio:
var tmp_disk_table_ratio = tmp_disk_tables / (tmp_tables + tmp_disk_tables) * 100;And alert if this ratio is greater than the threshold we set in the beginning:
        if(checkPrecond(host))
        {
           if(tmp_disk_table_ratio > WARNING_THRESHOLD) {
               advice.setJustification("Temporary tables written to disk is excessive");
               msg = ADVICE_WARNING;
           }
           else {
               advice.setJustification("Temporary tables written to disk not excessive");
               msg = ADVICE_OK;
           }
        }
It is important to assign the Advice to the msg variable here as this will be added later on into the advice object with the setAdvice() function. The full script for completeness:
#include "common/mysql_helper.js"

/**
 * Checks the percentage of max ever used connections
 *
 */
var WARNING_THRESHOLD=20;
var TITLE="Temporary tables on disk ratio";
var ADVICE_WARNING="More than 20% of temporary tables are written to disk. It is advised to review your queries, for example, via the Query Monitor.";
var ADVICE_OK="Temporary tables on disk are not excessive.";

function main()
{
    var hosts     = cluster::mySqlNodes();
    var advisorMap = {};

    for (idx = 0; idx < hosts.size(); ++idx)
    {
        host        = hosts[idx];
        map         = host.toMap();
        connected     = map["connected"];
        var advice = new CmonAdvice();
        var tmp_tables = readStatusVariable(host, 'Created_tmp_tables');
        var tmp_disk_tables = readStatusVariable(host, 'Created_tmp_disk_tables');
        var tmp_disk_table_ratio = tmp_disk_tables / (tmp_tables + tmp_disk_tables) * 100;

        if(!connected)
            continue;
        if(checkPrecond(host))
        {
           if(tmp_disk_table_ratio > WARNING_THRESHOLD) {
               advice.setJustification("Temporary tables written to disk is excessive");
               msg = ADVICE_WARNING;
               advice.setSeverity(0);
           }
           else {
               advice.setJustification("Temporary tables written to disk not excessive");
               msg = ADVICE_OK;
           }
        }
        else
        {
            msg = "Not enough data to calculate";
            advice.setJustification("there is not enough load on the server or the uptime is too little.");
            advice.setSeverity(0);
        }
        advice.setHost(host);
        advice.setTitle(TITLE);
        advice.setAdvice(msg);
        advisorMap[idx]= advice;
    }
    return advisorMap;
}
Now you can play around with the threshold of 20, try to lower it to 1 or 2 for instance and then you probably can see how this advisor will actually give you advice on the matter.
As you can see, with a simple script you can check two variables against each other and report/advice based upon their outcome. But is that all? There are still a couple of things we can improve!
Improvements on my first advisor
The first thing we can improve is that this advisor doesn’t make a lot of sense. What the metric actually reflects is the total number of temporary tables on disk since the last FLUSH STATUS or startup of MySQL. What it doesn’t say is at what rate it actually creates temporary tables on disk. So we can convert the Created_tmp_disk_tables to a rate using the uptime of the host:
var tmp_disk_table_rate = tmp_disk_tables / uptime;This should give us the number of temporary tables per second and combined with the tmp_disk_table_ratio, this will give us a more accurate view on things. Again, once we reach the threshold of two temporary tables per second, we don’t want to immediately send out an alert/advice.
Another thing we can improve is to not use the readStatusVariable(
In this case we can optimize this by retrieving the status variables in a map using the host.sqlInfo() function and retrieve everything at once as a map. This function contains the most important information of the host, but it does not contain all. For instance the variable uptime that we need for the rate is not available in the host.sqlInfo() map and has to be retrieved with the readStatusVariable(
This is what our advisor will look like now, with the changes/additions marked in bold:
#include "common/mysql_helper.js"

/**
 * Checks the percentage of max ever used connections
 *
 */
var RATIO_WARNING_THRESHOLD=20;
var RATE_WARNING_THRESHOLD=2;
var TITLE="Temporary tables on disk ratio";
var ADVICE_WARNING="More than 20% of temporary tables are written to disk and current rate is more than 2 temporary tables per second. It is advised to review your queries, for example, via the Query Monitor.";
var ADVICE_OK="Temporary tables on disk are not excessive.";

function main()
{
    var hosts     = cluster::mySqlNodes();
    var advisorMap = {};

    for (idx = 0; idx < hosts.size(); ++idx)
    {
        host        = hosts[idx];
        map         = host.toMap();
        connected     = map["connected"];
        var advice = new CmonAdvice();
        var hostStatus = host.sqlInfo();
        var tmp_tables = hostStatus['CREATED_TMP_TABLES'];
        var tmp_disk_tables = hostStatus['CREATED_TMP_DISK_TABLES'];
        var uptime = readStatusVariable(host, 'uptime');
        var tmp_disk_table_ratio = tmp_disk_tables / (tmp_tables + tmp_disk_tables) * 100;
        var tmp_disk_table_rate = tmp_disk_tables / uptime;

        if(!connected)
            continue;
        if(checkPrecond(host))
        {
           if(tmp_disk_table_rate > RATE_WARNING_THRESHOLD && tmp_disk_table_ratio > RATIO_WARNING_THRESHOLD) {
               advice.setJustification("Temporary tables written to disk is excessive: " + tmp_disk_table_rate + " tables per second and overall ratio of " + tmp_disk_table_ratio);
               msg = ADVICE_WARNING;
               advice.setSeverity(0);
           }
           else {
               advice.setJustification("Temporary tables written to disk not excessive");
               msg = ADVICE_OK;
           }
        }
        else
        {
            msg = "Not enough data to calculate";
            advice.setJustification("there is not enough load on the server or the uptime is too little.");
            advice.setSeverity(0);
        }
        advice.setHost(host);
        advice.setTitle(TITLE);
        advice.setAdvice(msg);
        advisorMap[idx]= advice;
    }
    return advisorMap;
}
Scheduling my first advisor
After we have saved this new advisor, compiled it and run, we now can schedule this advisor. Since we don’t have an excessive workload, we will probably run this advisor once per day.
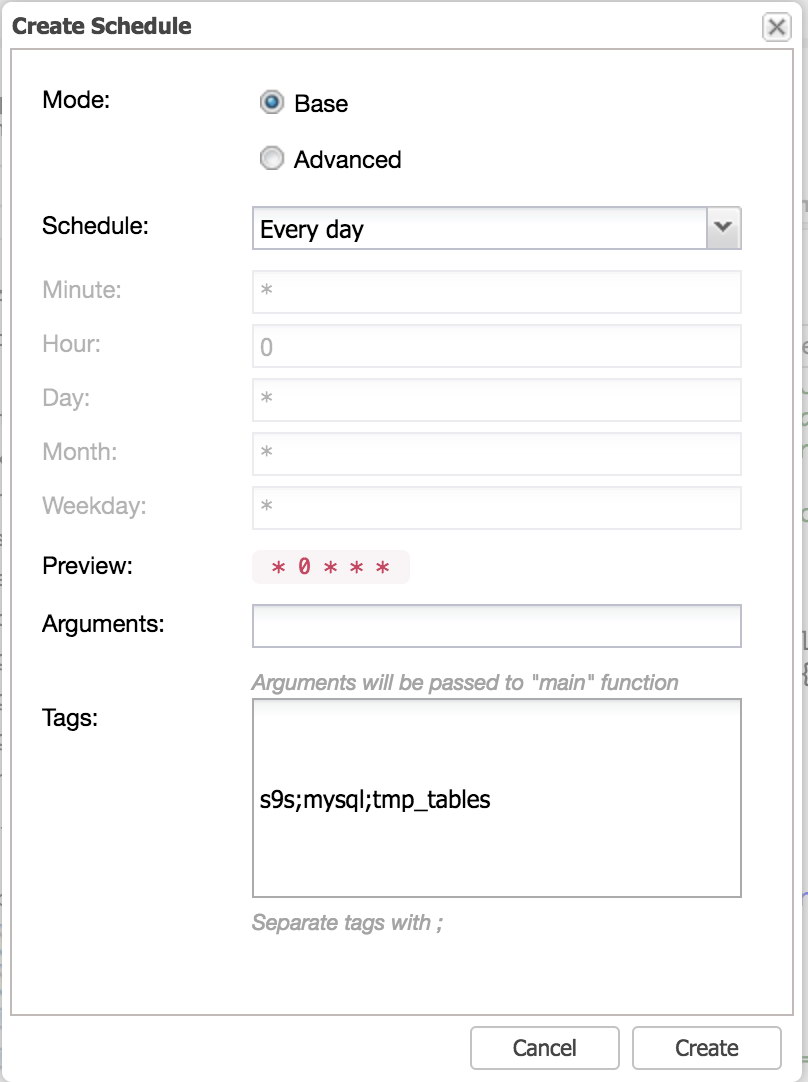
The base scheduling mode is similar to Cron which has every minute, 5 minutes, hour, day, month preset and this is exactly what we need and is very easy to manage the scheduling. Changing this to advanced will unlock the other greyed out input fields. These input fields work exactly the same as a crontab, so you can even schedule for a particular day, day of the month or even set it on weekdays.
Following this blog, we will create a checker for SELinux or security checks for Spectre and Meltdown if nodes are affected. Stay tuned!


