blog
What is a Query Outlier and How to Fix It

The MySQL database workload is determined by the number of queries that it processes. There are several situations in which MySQL slowness can originate. The first possibility is if there are any queries that are not using proper indexing. When a query cannot make use of an index, the MySQL server has to use more resources and time to process that query. By monitoring queries, you have the ability to pinpoint SQL code that is the root cause of a slowdown and fix it before the overall performance degrades.
In this blog post, we are going to highlight the Query Outlier feature available in ClusterControl and see how it can help us improve the database performance. In general, ClusterControl performs MySQL query sampling in two ways:
- Fetch the queries from the Performance Schema (recommended).
- Parse the content of MySQL Slow Query.
If the Performance Schema is disabled, ClusterControl will then default to the Slow Query log. To learn more on how ClusterControl performs this, check out this blog post, How to use the ClusterControl Query Monitor for MySQL, MariaDB and Percona Server.
What are Query Outliers?
An outlier is a query that takes a longer time than the normal query time of that type. Do not literally take this as “badly written” queries. It should be treated as potential suboptimal common queries that could be improved. After a number of samples and when ClusterControl has had enough stats, it can determine if latency is higher than normal (2 sigmas + average_query_time) then it is an outlier and will be added into the Query Outlier.
This feature is dependent on the Top Queries feature. If Query Monitoring is enabled and Top Queries are captured and populated, the Query Outliers will summarize these and provide a filter based on timestamp. To see the list of queries that require attention, go to ClusterControl -> Query Monitor -> Query Outliers and should see some queries listed (if any):
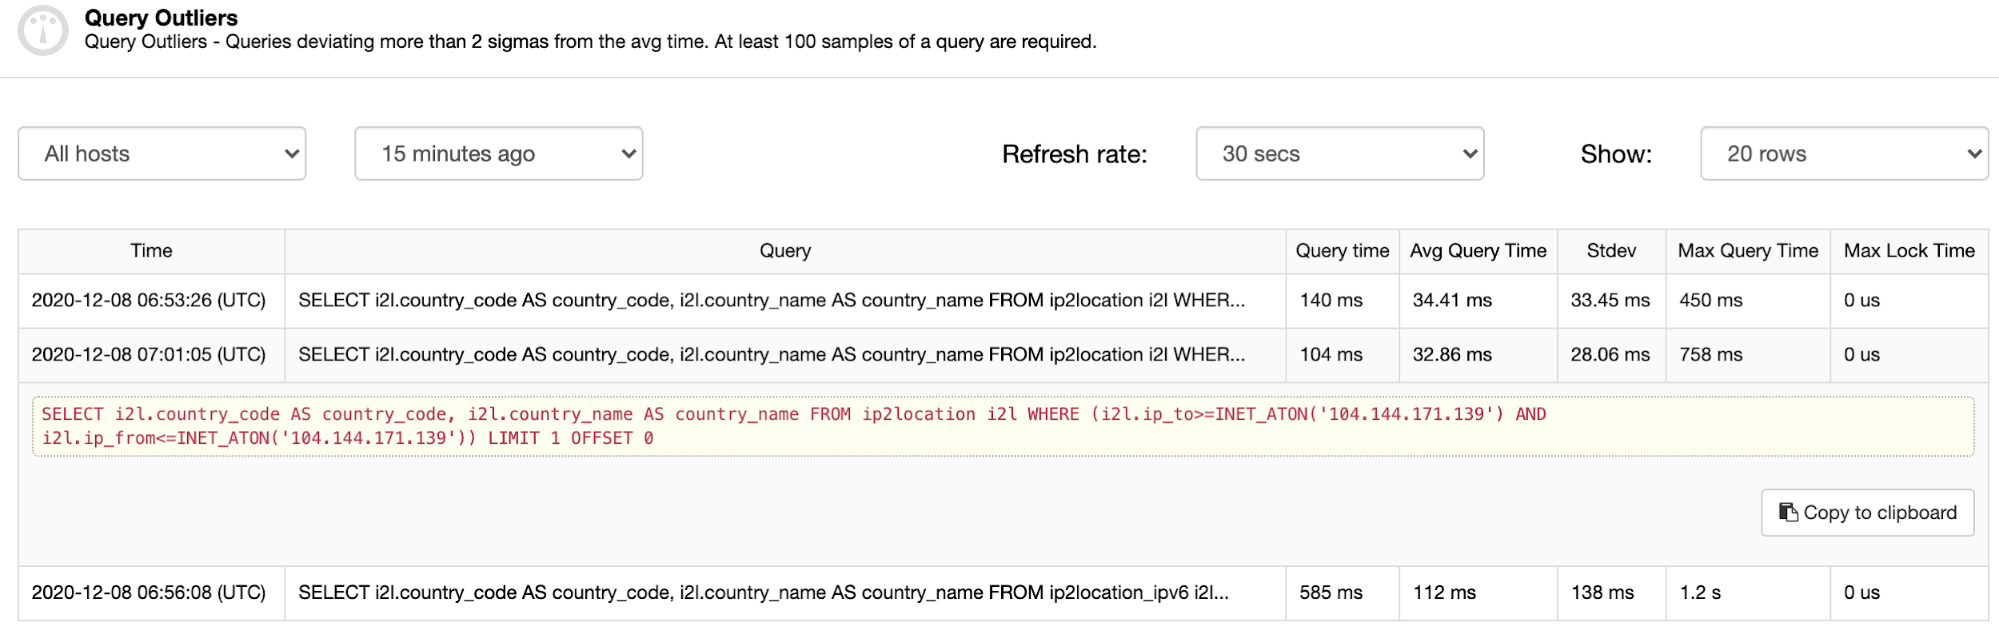
As you can see from the screenshot above, the outliers are basically queries that took at least 2 times longer than the average query time. First the first entry, the average time is 34.41 ms while the outlier’s query time is 140 ms (more than 2 times higher than the average time). Similarly, for the next entries, the Query Time and Avg Query Time columns are two important things to justify the outstandings of a particular outlier query.
It is relatively easy to find a pattern of a particular query outlier by looking at a bigger time period, like a week ago, as highlighted in the following screenshot:
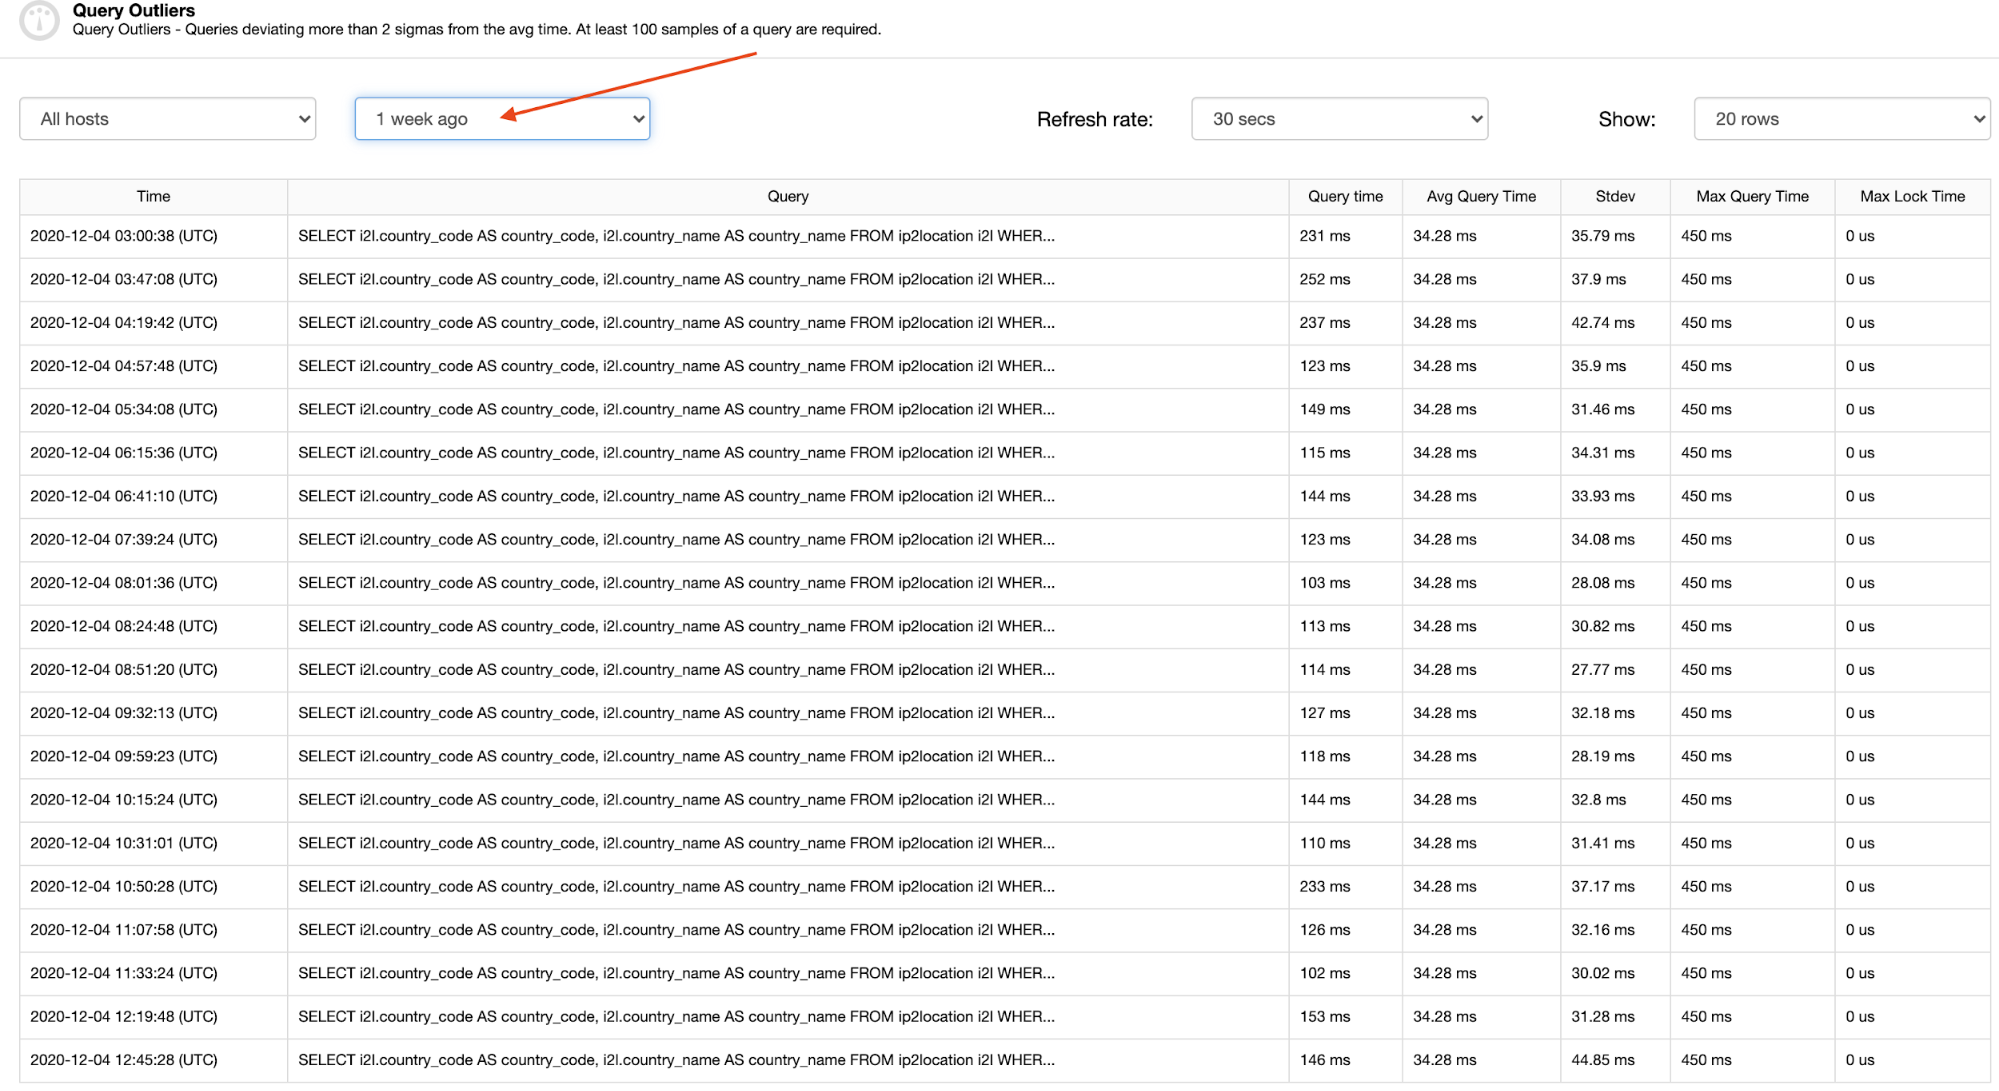
By clicking on each row, you can see the full query which is really helpful to pinpoint and understand the problem, as shown in the next section.
Fixing the Query Outliers
To fix the outliers, we need to understand the nature of the query, the tables’ storage engine, the database version, clustering type and how impactful the query is. In some cases, the outlier query is not really degrading to the overall database performance. As in this example, we have seen that the query has been standing out for the whole week and it was the only query type being captured so it is probably a good idea to fix or improve this query if possible.
As in our case, the outlier query is:
SELECT i2l.country_code AS country_code, i2l.country_name AS country_name
FROM ip2location i2l
WHERE (i2l.ip_to >= INET_ATON('104.144.171.139')
AND i2l.ip_from <= INET_ATON('104.144.171.139'))
LIMIT 1
OFFSET 0;
And the query result is:
+--------------+---------------+
| country_code | country_name  |
+--------------+---------------+
| US           | United States |
+--------------+---------------+
Using EXPLAIN
The query is a read-only range select query to determine the user’s geographical location information (country code and country name) for an IP address on table ip2location. Using the EXPLAIN statement can help us understand the query execution plan:
mysql> EXPLAIN SELECT i2l.country_code AS country_code, i2l.country_name AS country_name
FROM ip2location i2l
WHERE (i2l.ip_to>=INET_ATON('104.144.171.139')
AND i2l.ip_from<=INET_ATON('104.144.171.139'))
LIMIT 1 OFFSET 0;
+----+-------------+-------+------------+-------+--------------------------------------+-------------+---------+------+-------+----------+------------------------------------+
| id | select_type | table | partitions | type  | possible_keys                        | key         | key_len | ref  | rows  | filtered | Extra                              |
+----+-------------+-------+------------+-------+--------------------------------------+-------------+---------+------+-------+----------+------------------------------------+
|  1 | SIMPLE      | i2l   | NULL       | range | idx_ip_from,idx_ip_to,idx_ip_from_to | idx_ip_from | 5       | NULL | 66043 |    50.00 | Using index condition; Using where |
+----+-------------+-------+------------+-------+--------------------------------------+-------------+---------+------+-------+----------+------------------------------------+
The query is executed with a range scan on the table using index idx_ip_from with 50% potential rows (filtered).
Proper Storage Engine
Looking at the table structure of ip2location:
mysql> SHOW CREATE TABLE ip2locationG
*************************** 1. row ***************************
       Table: ip2location
Create Table: CREATE TABLE `ip2location` (
  `ip_from` int(10) unsigned DEFAULT NULL,
  `ip_to` int(10) unsigned DEFAULT NULL,
  `country_code` char(2) COLLATE utf8_bin DEFAULT NULL,
  `country_name` varchar(64) COLLATE utf8_bin DEFAULT NULL,
  KEY `idx_ip_from` (`ip_from`),
  KEY `idx_ip_to` (`ip_to`),
  KEY `idx_ip_from_to` (`ip_from`,`ip_to`)
) ENGINE=InnoDB DEFAULT CHARSET=utf8 COLLATE=utf8_bin
This table is based on the IP2location database and it is seldomly being updated/written, usually only on the first day of the calendar month (recommended by the vendor). So one option is to convert the table to MyISAM (MySQL) or Aria (MariaDB) storage engine with fixed row format to get better read-only performance. Note that this is only applicable if you are running on MySQL or MariaDB standalone or replication. On Galera Cluster and Group Replication, please stick to the InnoDB storage engine (unless you know what you are doing).
Anyway, to convert the table from InnoDB to MyISAM with fixed row format, simply run the following command:
ALTER TABLE ip2location ENGINE=MyISAM ROW_FORMAT=FIXED;In our measurement, with 1000 random IP address lookup tests, the query performance improved around 20% with MyISAM and fixed row format:
- Average time (InnoDB): 21.467823 ms
- Average time (MyISAM Fixed): 17.175942 ms
- Improvement: 19.992157565301 %
You can expect this result to be immediate after the table is altered. No modification on the higher tier (application/load balancer) is necessary.
Tuning the Query
Another way is to inspect the query plan and use a more efficient approach for a better query execution plan. The same query can also be written using subquery as below:
SELECT `country_code`, `country_name` FROM
  (SELECT `country_code`, `country_name`, `ip_from`
   FROM `ip2location`
   WHERE ip_to >= INET_ATON('104.144.171.139')
   LIMIT 1)
AS temptable
WHERE ip_from <= INET_ATON('104.144.171.139');
The tuned query has the following query execution plan:
mysql> EXPLAIN SELECT `country_code`,`country_name` FROM
(SELECT `country_code`, `country_name`, `ip_from`
FROM `ip2location`
WHERE ip_to >= INET_ATON('104.144.171.139')
LIMIT 1)
AS temptable
WHERE ip_from <= INET_ATON('104.144.171.139');
+----+-------------+--------------+------------+--------+---------------+-----------+---------+------+-------+----------+-----------------------+
| id | select_type | table        | partitions | type   | possible_keys | key       | key_len | ref  | rows  | filtered | Extra                 |
+----+-------------+--------------+------------+--------+---------------+-----------+---------+------+-------+----------+-----------------------+
|  1 | PRIMARY     |    | NULL       | system | NULL          | NULL      | NULL    | NULL |     1 |   100.00 | NULL                  |
|  2 | DERIVED     | ip2location  | NULL       | range  | idx_ip_to     | idx_ip_to | 5       | NULL | 66380 |   100.00 | Using index condition |
+----+-------------+--------------+------------+--------+---------------+-----------+---------+------+-------+----------+-----------------------+
Using subquery, we can optimize the query by using a derived table that focuses on one index. The query should return only 1 record where the ip_to value is greater than or equal to the IP address value. This allows the potential rows (filtered) to reach 100% which is the most efficient. Then, check that the ip_from is less than or equal to the IP address value. If it is, then we should find the record. Otherwise, the IP address does not exist in the ip2location table.
In our measurement, the query performance improved around 99% using a subquery:
- Average time (InnoDB + range scan): 22.87112 ms
- Average time (InnoDB + subquery): 0.14744 ms
- Improvement: 99.355344207017 %
With the above optimization, we can see a sub-millisecond query execution time of this type of query, which is a massive improvement considering the previous average time is 22 ms. However, we need to make some modifications to the higher tier (application/load balancer) in order to benefit from this tuned query.
Patching or Query Rewriting
Patch your applications to use the tuned query or rewrite the outlier query before it reaches the database server. We can achieve this by using a MySQL load balancer like ProxySQL (query rules) or MariaDB MaxScale (statement rewriting filter), or using the MySQL Query Rewriter plugin. In the following example, we use ProxySQL in front of our database cluster and we can simply create a rule to rewrite the slower query into the faster one, for example:
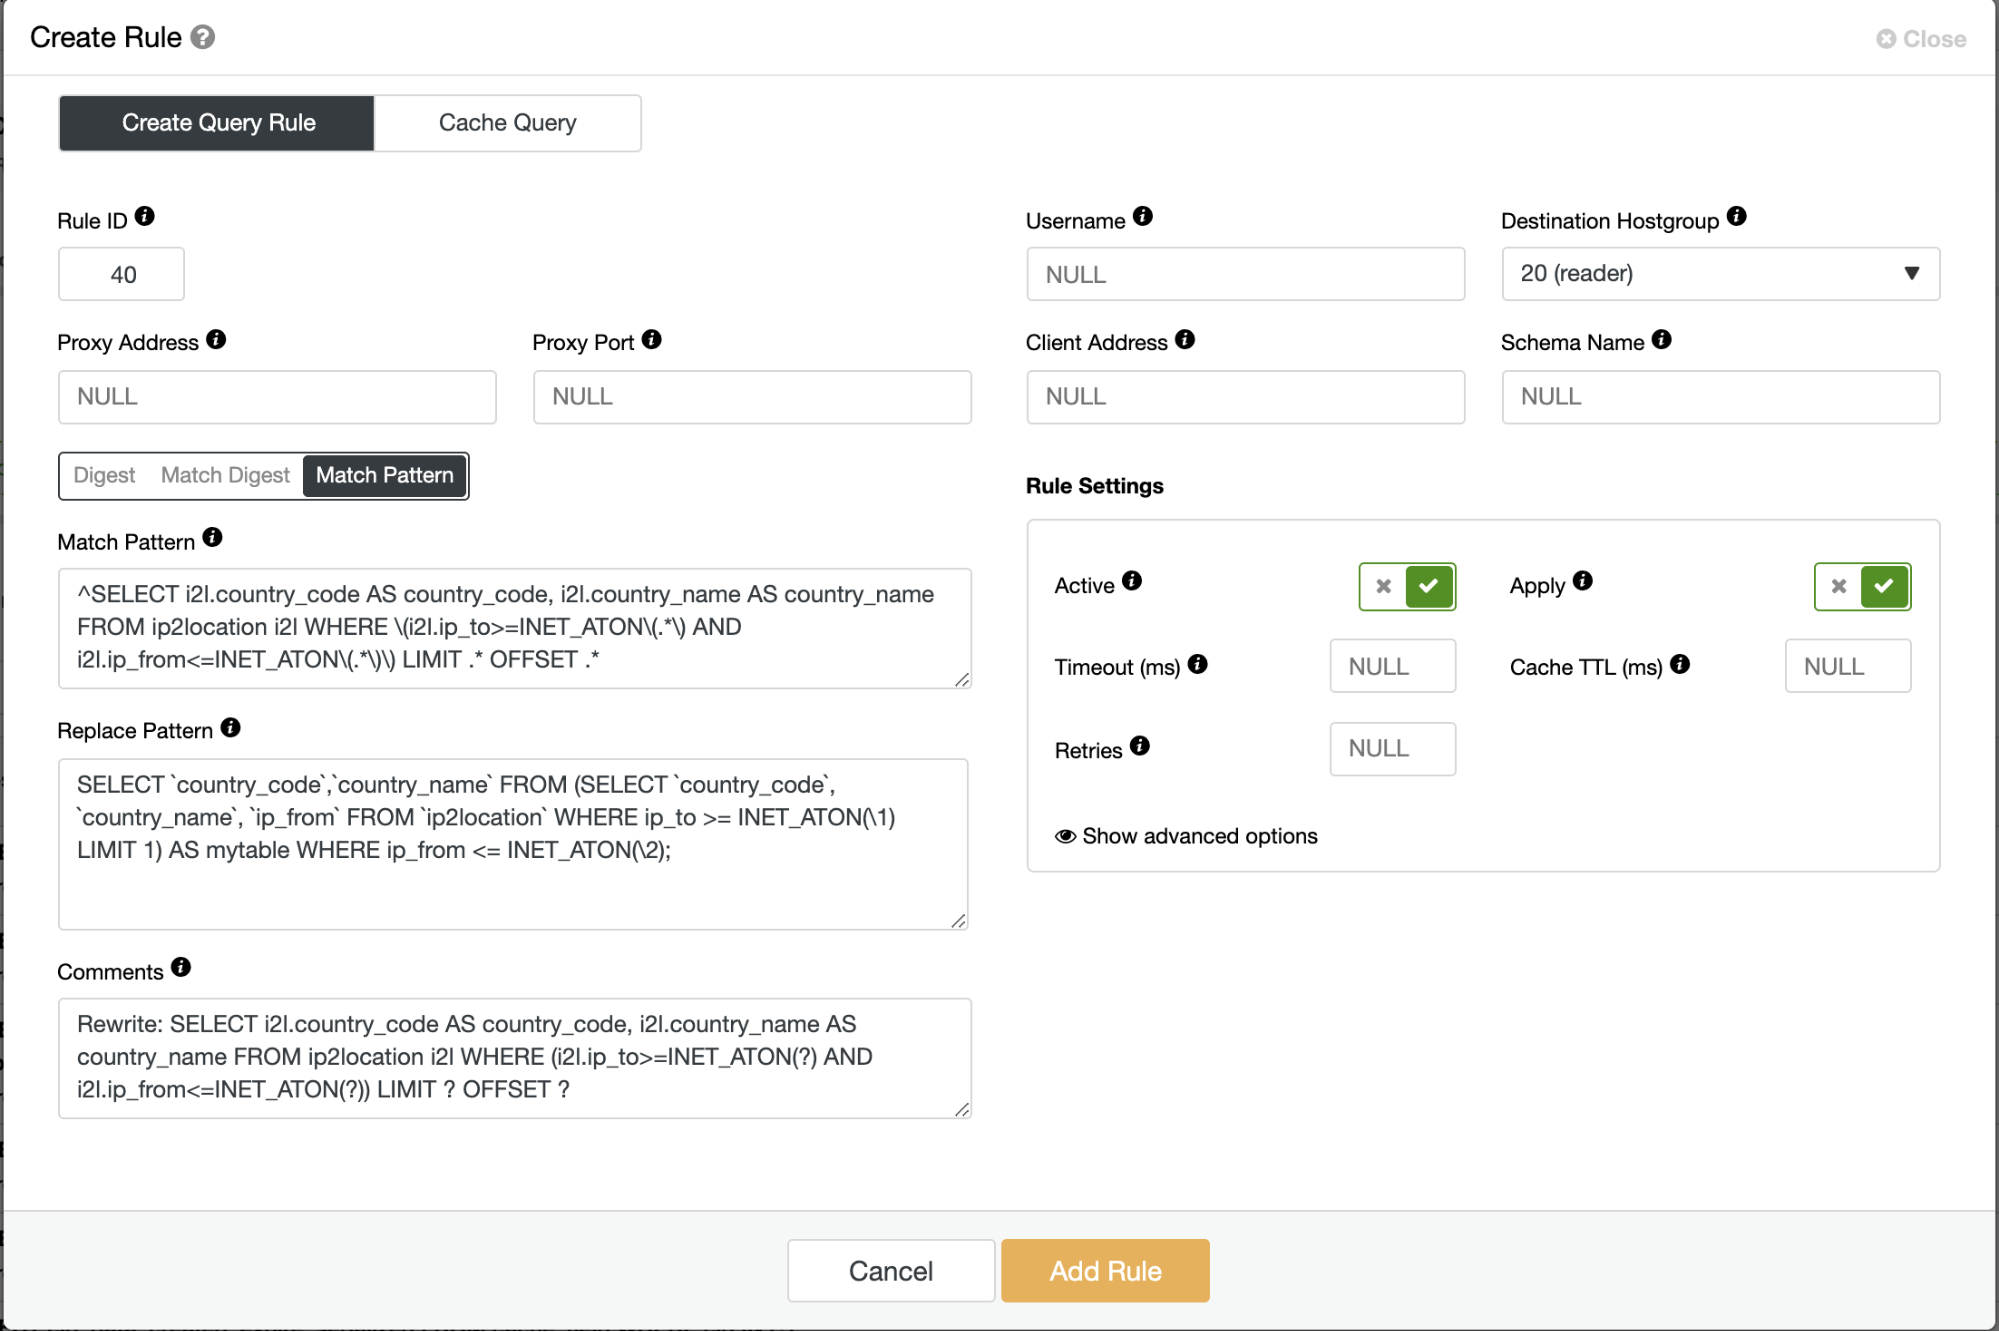
Save the query rule and monitor the Query Outliers page in ClusterControl. This fix will obviously remove the outlier queries from the list after the query rule is activated.
Conclusion
Query outliers is a proactive query monitoring tool that can help us understand and fix the performance problem before it is getting way out of control. As your application grows and becomes more demanding, this tool can help you maintain a decent database performance along the way.


