blog
Managing ClickHouse Resources in Multi-Tenant Environments

When people first deploy ClickHouse, their initial reaction is often surprise. Queries that used to take minutes now finish in seconds. Dashboards feel instant even when reading billions of rows.
To see this in action, here is a simple aggregation query running against a 200 million row events table:
SELECT customer_id, count()
FROM my_db.events GROUP BY customer_id ORDER BY count() DESC;
ClickHouse delivers exceptional speed, scanning 200 million rows in under a second on a 3-node cluster. This efficiency powers real-time analytics and observability platforms.
However, production environments are often multi-tenant, where dashboards, ETL pipelines, and background processes share CPU, memory, and disk resources. Without proper resource management, greedy workloads can saturate the system, causing performance degradation across all tasks.
This post explores operational strategies for managing ClickHouse in shared environments. Using a live 3-node replicated cluster with 200 million rows, we demonstrate how to identify contention, implement workload scheduling, and validate system stability.
Understanding Resource Contention in ClickHouse
ClickHouse is built for analytical processing. It scans large datasets fast by spreading work across many CPU threads at the same time. That design is what makes it so quick. But it also means that when multiple workloads run together, they start competing for the same resources at the same time.
This is different from databases like MySQL or PostgreSQL. In those systems, contention usually shows up as lock waits or transaction conflicts. In ClickHouse, the problem is almost always infrastructure saturation.
Take this query running against our 200 million row events table:
SELECT customer_id, count()
FROM my_db.events GROUP BY customer_id ORDER BY count() DESC;
This query looks simple but it scans all 200 million rows, builds aggregation buffers in memory, uses multiple CPU threads in parallel, and reads a significant amount of data from disk. Run one and the cluster handles it fine. Run several at the same time and things start to break down. You can verify this directly by checking the query log:
SELECT query_duration_ms, read_rows, read_bytes, memory_usage
FROM system.query_log
WHERE type = 'QueryFinish' AND query LIKE '%customer_id%'
ORDER BY event_time DESC LIMIT 5;
This gets even more complicated in multi-tenant environments. A tenant can be a different team, a different application, or a different customer all sharing the same cluster at the same time. The challenges are real. One heavy query slows down everyone else.
Without proper row policies data can leak between tenants. Without resource controls one tenant can consume everything and leave nothing for others. And without careful schema design, performance problems become very hard to fix later. These are not just performance problems. In multi-tenant environments they become operational risks.
When contention builds up, operators start noticing these symptoms: CPU stays near 100% even between queries, dashboard responses get slower, replication starts falling behind, merge queues keep growing, insert throughput drops, and network pressure is also real. In our 3 node setup every insert gets replicated to two other nodes at the same time.
During heavy inserts, replication traffic and query traffic compete for the same network interface and replication lag starts climbing:
SELECT replica_name, absolute_delay, queue_size, inserts_in_queue
FROM system.replicas
ORDER BY absolute_delay DESC;
ClickHouse is not broken when this happens. It is doing exactly what it was designed to do, which is use every available resource to finish analytical work as fast as possible. The job of the operator is to make sure no single workload takes more than its fair share.
That is what the rest of this article is about.
CPU Contention and Thread Management
In shared ClickHouse environments, CPU contention is frequent because the system defaults to using maximum threads for speed. While effective for single queries, concurrent workloads compete for threads, overwhelming the CPU.
A common way to control this is with the max_threads setting: SET max_threads = 4;
The first reaction most people have is, “Why would I want to make my queries slower?” The honest answer is that fewer threads does not always mean slower. Sometimes it means faster.
We tested this directly on our 3 node cluster with 200 million rows. We ran the same query under different conditions and checked the query log:
SELECT query_duration_ms, read_rows, Settings['max_threads'] AS max_threads
FROM system.query_log
WHERE type = 'QueryFinish' AND query LIKE '%customer_id%' ORDER BY event_time DESC LIMIT 4;
In a shared cluster the benefit becomes even more obvious. When 10 analysts run queries at the same time on a 32 core server and each query tries to use 16 threads, that is 160 threads competing for 32 cores. The CPU scheduler gets overwhelmed and everything slows down together. By giving each query fewer threads the cluster stays stable and responsive for everyone.
Think of it this way. A single lane highway moves fast until everyone tries to use it at once. Splitting into more lanes and slowing everyone down slightly keeps traffic moving for all users.
When lowering max_threads makes sense:
- A shared cluster where many users run queries at the same time
- Dashboard workloads that need consistent low latency
- Environments where insert pipelines and merges need to keep running alongside analytical queries
When raising max_threads makes sense:
- A dedicated batch environment running a small number of heavy jobs
- Overnight ETL workloads where the cluster is mostly idle
- Single user environments where there is no competition for resources
The most important thing to understand is that more threads is not always better. The right value always depends on your hardware, your data, and how many workloads are sharing the cluster at the same time.
Memory Management and Query Stability
Memory is the next resource that gets squeezed in a shared ClickHouse environment. Analytical queries are hungry for memory. Operations like GROUP BY, JOIN, sorting, DISTINCT, and distributed aggregations all need to build large temporary buffers while they run.
The setting that controls this is SET max_memory_usage = '1G';
This limits how much memory a single query can use. Most people assume that giving queries more memory is always better because they finish faster. In practice that thinking is one of the fastest ways to destabilize a shared cluster.
Our 3 node cluster is a good real world example of this. Each node has 4GB of total RAM with no swap configured. Here is the actual memory picture on each node:
               total        used        free
available
Mem:           4.0Gi       1.7Gi       2.1Gi
2.3Gi
Swap:             0B          0B          0B
ClickHouse is already consuming around 415MB just to keep the server running. That leaves roughly 2.3GB actually available for queries, merges, replication, and the operating system to share.
The default max_memory_usage is set to 0 which means unlimited. On a node with no swap that is dangerous. If a query tries to allocate more memory than the node has available, the operating system will immediately kill the ClickHouse process. There is no swap to fall back on. The process just dies. You can verify your current memory usage and limit with these queries:
SELECT metric, value FROM system.metrics WHERE metric LIKE '%Memory%';
SELECT name, value FROM system.settings WHERE name = 'max_memory_usage';
On our cluster the result looks like this:

The fix is a per query limit in the user config and a server wide cap in /etc/clickhouse-server/config.d/memory.xml. For our environment we set max_memory_usage to 1GB per query and max_server_memory_usage to 3GB total. This leaves 1GB free for the OS, Keeper, and background processes.
When the limit is hit users will see MEMORY_LIMIT_EXCEEDED. That error is actually a good sign. It means the limit is working and protecting the node from going down entirely.
But setting limits too low creates the opposite problem. Some workloads genuinely need large buffers. If limits are too tight legitimate queries start failing.
When lowering max_memory_usage makes sense:
- A shared cluster with many concurrent users
- Nodes with limited RAM and no swap like our environment
- Environments prone to sudden traffic spikes
When raising max_memory_usage makes sense:
- Isolated reporting workloads running on a schedule
- Heavy ETL jobs running during off peak hours
- Dedicated nodes with higher memory capacity
On our 4GB nodes with no swap, keeping memory limits tight is not optional; it is what keeps the cluster alive.
Disk I/O and Merge Pressure
Disk behavior in ClickHouse is very different from most traditional databases because of how the MergeTree engine works. Every insert gets written as a new immutable part on disk. A background process continuously merges these small parts into larger ones to keep storage efficient and queries fast. Without merges, parts accumulate, queries slow down, and storage becomes fragmented.
The most common way operators create merge problems without realizing it is by inserting data in very small batches. We simulated this on our cluster by running 1000 single row inserts in a loop. The parts count jumped significantly with each insert. You can see this directly by checking parts before and after:
SELECT database, table, count() AS parts_count, sum(rows) AS total_rows
FROM system.parts
WHERE active = 1 AND database = 'my_db'
GROUP BY database, table;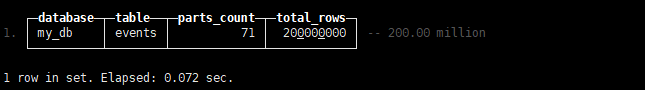
Each tiny insert creates a new part on disk. This is what people call a merge explosion. The merge queue builds up faster than ClickHouse can clear it, disk I/O gets saturated from background merges competing with foreground queries, replication falls behind, and query performance drops because ClickHouse has to scan many more physical files.
The fix is simple. Insert data in large batches instead of small ones. Instead of 1 row at a time, insert at least 10,000 rows per batch. When we loaded 200 million rows in large batches the part count stayed manageable throughout.
You can monitor merge activity at any time with:
SELECT database, table, elapsed, progress, num_parts
FROM system.merges
ORDER BY elapsed DESC;
Operators can also tune background merge concurrency with background_pool_size. Higher values help clear backlogs faster but on our 4GB nodes with no swap, more merge threads means more memory and disk I/O competing with foreground queries at the same time.
When increasing background_pool_size makes sense:
- Merge queues are growing consistently and not clearing
- Disks have spare I/O capacity
- Nodes have enough RAM to handle additional merge threads
When keeping background_pool_size lower makes sense:
- Disks are already saturated
- Nodes have limited RAM like our 4GB environment
- Query latency is more important than insert throughput
Higher values do not automatically mean better performance. On constrained hardware like ours, keeping merge concurrency modest is what keeps queries responsive while background work continues steadily.
Workload Scheduling and Prioritization
Even with thread and memory limits in place, a shared cluster still struggles when different workload types compete for the same resources at the same time. Dashboard queries need millisecond responses. ETL jobs can take minutes. Without scheduling, both are treated equally and dashboards suffer. ClickHouse solves this with a workload scheduling system that controls how disk IO, CPU threads, and query slots are shared between workloads.
root
├── realtime
│   ├── dashboards
│   └── api_queries
├── batch
│   ├── etl
│   └── exports
└── background
   ├── merges
   └── replication
Scheduling Hierarchy and Resource Definitions
The foundation of workload scheduling in ClickHouse is the concept of a resource. A resource represents a shared physical asset that multiple workloads compete for. ClickHouse supports three types: disk IO, CPU threads, and query slots.
Start by defining what resources exist on your cluster:
CREATE RESOURCE disk_read (READ ANY DISK);
CREATE RESOURCE disk_write (WRITE ANY DISK);
CREATE RESOURCE cpu (MASTER THREAD, WORKER THREAD);
CREATE RESOURCE query (QUERY);
The READ and WRITE disk definitions are important. They let you control read and write IO separately. In a shared cluster, dashboard read traffic and insert write traffic compete for the same disk bandwidth. Separating them gives you independent control over each.
Once resources are defined, build a workload hierarchy on top of them. The root workload sits at the top and distributes resources down to everything below it:
CREATE WORKLOAD root
SETTINGS
    max_concurrent_threads = 50,
    max_concurrent_queries = 50,
    max_queries_per_second = 20;

CREATE WORKLOAD realtime IN root SETTINGS priority = 1;
CREATE WORKLOAD batch IN root SETTINGS priority = 10;
CREATE WORKLOAD background IN root SETTINGS priority = 100;
You can also apply bandwidth limits per resource directly on a workload. This caps read bandwidth at 100 MB/s and write bandwidth at 50 MB/s:
CREATE WORKLOAD all IN root
SETTINGS
    max_bytes_per_second = 104857600 FOR disk_read,
    max_bytes_per_second = 52428800 FOR disk_write;
The root workload manages resource distribution across the hierarchy. High-priority “realtime” traffic like dashboards requires fast, consistent responses. The “batch” branch handles latency-tolerant tasks such as ETL pipelines, while “background” operations like replication run steadily without impacting foreground performance.
You can verify which workloads exist on your cluster:
SELECT * FROM system.workloads;
SELECT * FROM system.resources;
In ClickHouse lower priority numbers mean higher priority. Realtime gets served first, then batch, then background. Assign users to workloads by creating dedicated users:
CREATE USER dashboard_user IDENTIFIED BY 'dashboard123'
SETTINGS workload = 'realtime';

CREATE USER analyst IDENTIFIED BY 'analyst123'
SETTINGS workload = 'batch';
You can also assign workloads through the user config file for existing users. Add the workload setting to /etc/clickhouse-server/users.d/default-password.xml
N.B. A common mistake is giving all workloads equal priority. When a heavy batch job and a lightweight dashboard query compete equally, the batch job almost always wins because it consumes more resources per query. Proper prioritization flips this; the batch job still runs, it just waits its turn when realtime traffic needs resources first.
Memory Overcommit and Query Queueing
Memory overcommit controls what happens when total memory demand from all running queries exceeds what is physically available. On our 4GB nodes with no swap this is critical. Without overcommit controls, if multiple queries simultaneously try to allocate more memory than is available the OS kills the ClickHouse process immediately.
ClickHouse handles this by waiting briefly for other queries to release memory before terminating the most overcommitted query first. This is much safer than having no limit at all:
SET max_memory_usage = 1073741824;
SET memory_usage_overcommit_max_wait_microseconds = 5000000;
Instead of the entire node going down, only the most memory hungry query gets cancelled. Everything else keeps running. On our 4GB nodes this is the difference between a graceful query failure and a full cluster crash.
Query queueing handles overload at the concurrency level. When more queries arrive than the cluster can handle they queue up instead of all running at once. You can set this at the server level in /etc/clickhouse-server/config.d/cluster.xml. Or via workload scheduling:
CREATE OR REPLACE WORKLOAD root SETTINGS
    max_concurrent_threads = 50,
    max_concurrent_queries = 50,
    max_queries_per_second = 20;
On our 4GB nodes, 50 concurrent queries is a safe ceiling. New queries that arrive when the limit is hit wait for a slot instead of crashing the node. Monitor active and queued queries at any time:
SELECT query, elapsed, memory_usage, read_rows
FROM system.processes
ORDER BY elapsed DESC;
When lowering max_concurrent_queries makes sense:
- Nodes with limited RAM like our 4GB environment
- Clusters with no swap configured
- Environments where query stability matters more than raw throughput
When raising max_concurrent_queries makes sense:
- Nodes with large amounts of RAM and fast disks
- Clusters serving many lightweight queries simultaneously
- Environments where queries are short and memory usage per query is low
A cluster managing a queue is more often more stable than one where unlimited queries run simultaneously. On constrained hardware, queueing is not a limitation but what keeps the cluster alive under pressure. When workload scheduling makes the most difference:
- Customer facing dashboards sharing a cluster with internal ETL jobs
- Clusters serving multiple teams with different SLA requirements
- Environments where insert pipelines and analytical queries run simultaneously
N.B. The goal is not to make batch jobs slow. The goal is to make sure realtime workloads stay fast even when the cluster is under pressure.
Isolation Strategies in Multi-Tenant Environments
Everything we have covered so far assumes different workloads share the same cluster. That works well up to a point; but, some organizations eventually reach a scale where sharing creates too much risk. One bad query from one tenant can still affect everyone else no matter how carefully the limits are tuned — this is the noisy neighbor problem. The solution depends on how much isolation you actually need. There are three main ways organizations handle this depending on their scale and operational maturity.
Approach 1: Shared Cluster with Schema Level Isolation
This is the most common starting point. All tenants share the same cluster and the same table. Isolation is handled through schema design and row policies.
The most important thing to get right is the schema. Including tenant_id in the sorting key makes a significant difference:
CREATE TABLE my_db.events ON CLUSTER my_cluster
(
    tenant_id       UInt32,
    event_date      Date,
    event_id        UInt64,
    customer_id     UInt32,
    event_type      LowCardinality(String),
    event_timestamp DateTime,
    metadata        String
)
ENGINE = ReplicatedMergeTree('/clickhouse/tables/{shard}/events', '{replica}')
PARTITION BY toYYYYMM(event_date)
ORDER BY (tenant_id, event_date, customer_id, event_id);
With tenant_id first in the sort key, ClickHouse physically stores each tenant’s data together on disk. A query filtering by tenant_id only reads that tenant’s data and skips everything else.
For dashboard workloads, pre-aggregate data per tenant into materialized views instead of letting tenants query the raw table directly:
CREATE MATERIALIZED VIEW my_db.events_tenant1_mv
ENGINE = SummingMergeTree()
ORDER BY (event_date, customer_id)
AS SELECT
    event_date,
    customer_id,
    count() AS event_count
FROM my_db.events
WHERE tenant_id = 1
GROUP BY event_date, customer_id;
This keeps tenant queries physically separated and pre-computed so one tenant’s heavy scan cannot slow down another’s dashboard.
Then enforce data isolation with restrictive row policies:
-- Grant access
GRANT SELECT ON my_db.events TO tenant1_user;
GRANT SELECT ON my_db.events TO tenant2_user;

-- Create restrictive row policies
CREATE ROW POLICY tenant1_policy ON my_db.events
AS RESTRICTIVE
FOR SELECT USING tenant_id = 1
TO tenant1_user;

CREATE ROW POLICY tenant2_policy ON my_db.events
AS RESTRICTIVE
FOR SELECT USING tenant_id = 2
TO tenant2_user;

-- Verify policies
SELECT short_name, select_filter, is_restrictive, apply_to_list
FROM system.row_policies
WHERE table = 'events';
On our cluster with 200 million rows distributed across 5 tenants, each tenant user can only see their own 40 million rows and gets zero results when querying other tenant data.
Approach 2: Database Level Isolation
A step up from row policies. Each tenant gets their own database but shares the same cluster infrastructure:
CREATE DATABASE tenant1_db ON CLUSTER my_cluster;
CREATE DATABASE tenant2_db ON CLUSTER my_cluster;
CREATE TABLE tenant1_db.events ON CLUSTER my_cluster
(
    event_date      Date,
    event_id        UInt64,
    customer_id     UInt32,
    event_type      LowCardinality(String),
    event_timestamp DateTime,
    metadata        String
)
ENGINE = ReplicatedMergeTree('/clickhouse/tables/{shard}/tenant1/events', '{replica}')
PARTITION BY toYYYYMM(event_date)
ORDER BY (event_date, customer_id, event_id);
This gives cleaner separation and makes per tenant storage, backups, and access controls easier to manage. The tradeoff is more tables to maintain as tenant count grows.
Approach 3: Cluster Level Isolation
The strongest form of isolation. Different workload types get entirely separate clusters:
| Ingestion cluster | handles high throughput data loading |
| Dashboard cluster | optimized for low latency concurrent reads |
| ETL cluster | reserved for heavy transformation jobs |
This eliminates the noisy neighbor problem completely. The tradeoff is higher infrastructure cost and more operational complexity.
Using Settings to Prioritize Workloads
Beyond isolation approach, individual query settings give operators per query control over resource consumption per tenant without changing global settings:
-- Heavy report query - limit resources
SELECT customer_id, count()
FROM my_db.events
WHERE tenant_id = 1
GROUP BY customer_id
SETTINGS max_threads = 4, max_memory_usage = 1073741824, workload = 'batch';

-- Dashboard query - allow more resources
SELECT count()
FROM my_db.events
WHERE tenant_id = 1
AND event_date = today()
SETTINGS max_threads = 8, workload = 'realtime';
A heavy analytical report from one tenant can be throttled while their dashboard queries remain fast.
Choosing the Right Approach
| Approach | Best for | Tradeoff |
| Shared cluster with row policies | Small tenant count, limited hardware | Noisy neighbor risk remains |
| Separate databases per tenant | Medium tenant count, cleaner isolation | More tables to manage |
| Dedicated clusters | Large scale, strict SLAs | Higher cost and complexity |
Most organizations start with Approach 1, move to Approach 2 as tenant count grows, and only adopt Approach 3 when SLA requirements become strict enough to justify the cost. For our 3 node cluster with 4GB RAM per node, Approach 1 with row policies, materialized views, and workload assignment is the most practical starting point.
Operational Best Practices
Resource issues in ClickHouse rarely announce themselves immediately. A cluster can look perfectly healthy from the outside while merge queues, memory pressure, or replication lag quietly build up internally. By the time users start complaining the problem has usually been growing for a while. This is why operational visibility and proper configuration are just as important as the tuning settings we covered in earlier sections.
Setting Up Workload Classes and Assigning Quotas
CREATE WORKLOAD realtime IN root SETTINGS priority = 1;
CREATE WORKLOAD batch IN root SETTINGS priority = 10;
CREATE WORKLOAD background IN root SETTINGS priority = 100;
Then assign users to workloads:
CREATE USER dashboard_user IDENTIFIED BY 'dashboard123'
SETTINGS workload = 'realtime';

CREATE USER analyst IDENTIFIED BY 'analyst123'
SETTINGS workload = 'batch';
Quotas add a second layer of control on top of workload priority. Even if a user has high priority, quotas prevent them from consuming unlimited resources over time:
-- Tenant users: 1000 queries per hour, max 10 billion rows read
CREATE QUOTA tenant_quota
    FOR INTERVAL 1 HOUR
    MAX queries = 1000,
    MAX read_rows = 10000000000
    TO tenant1_user, tenant2_user;

-- Analysts: 100 queries per hour, max 5 billion rows read
CREATE QUOTA analyst_quota
    FOR INTERVAL 1 HOUR
    MAX queries = 100,
    MAX read_rows = 5000000000
    TO analyst;
Monitoring Resource Usage
Good monitoring practices catch problems before they become visible to users. On our 3 node cluster with 200 million rows we focus on five key signals.
Query latency is usually the first visible sign of contention:
SELECT query_duration_ms, read_rows, memory_usage, query
FROM system.query_log
WHERE type = 'QueryFinish'
AND event_time >= now() - INTERVAL 10 MINUTE
ORDER BY query_duration_ms DESC
LIMIT 10;
Replication lag signals network pressure or overloaded replicas:
SELECT replica_name, absolute_delay, queue_size, inserts_in_queue
FROM system.replicas
ORDER BY absolute_delay DESC;
Parts growth indicates merge pressure from small inserts:
SELECT database, table, count() AS parts_count, sum(rows) AS total_rows
FROM system.parts
WHERE active = 1 AND database = 'my_db'
GROUP BY database, table
ORDER BY parts_count DESC;
For a full cluster health snapshot combine all signals into one query:
SELECT
    (SELECT count() FROM system.processes) AS active_queries,
    (SELECT count() FROM system.merges) AS active_merges,
    (SELECT max(absolute_delay) FROM system.replicas) AS max_replication_delay,
    (SELECT max(queue_size) FROM system.replicas) AS max_replication_queue,
    (SELECT count() FROM system.parts WHERE active = 1 AND database = 'my_db') AS parts_count,
    (SELECT value FROM system.metrics WHERE metric = 'MemoryTracking' LIMIT 1) AS memory_used_bytes;
Run this regularly and you will catch problems before they reach users.
One important thing to keep in mind is that tuning ClickHouse rarely eliminates a bottleneck completely. It usually just moves it somewhere else. Increasing background_pool_size may clear the merge queue faster but adds more disk I/O pressure. Lowering max_memory_usage may stabilize the cluster but some queries will start failing. The system tables covered in this section are your best tool for observing exactly what changed after each adjustment.
The best way to understand ClickHouse resource management is not to read about it but to test it directly on a real cluster with real data and watch what happens.
Integrating with Ops Tooling
Running ClickHouse in production is not just about tuning settings and writing good queries. At some point the cluster needs to integrate with the broader operational infrastructure that the rest of your organization already uses. Alerts need to fire before users notice problems. Capacity needs to grow before resource pressure becomes a crisis. And in organizations running multiple database technologies, policies need to be enforced consistently across all of them.
Alerts for Resource Exhaustion
ClickHouse exposes metrics via its HTTP interface that can be scraped by Prometheus or any compatible monitoring system: curl http://server1:8123/metrics
| Metric | Warning | Critical |
| Memory usage | > 2.5GB | > 3GB |
| Replication delay | > 30s | > 300s |
| Active merges | > 10 | > 20 |
| Concurrent queries | > 40 | > 50 |
| Parts count | > 500 | > 1000 |
Scaling Out Nodes and Shards When Resource Pressure Builds
Our current setup is 1 shard with 3 replicas. When pressure builds consistently across all nodes it is a signal to grow. Scale up by adding more CPU or memory to existing nodes. Scale out by adding more shards to distribute data and query load across more hardware.
Signs it is time to scale out:
- CPU stays above 80% consistently,
- memory errors appear regularly,
- merge queues keep growing despite tuning,
- and replication lag keeps climbing.
Using Unified Management to Enforce Policies Across Databases
Organizations running ClickHouse alongside MySQL or PostgreSQL face the challenge of managing resource policies, backups, and monitoring separately for each technology. Purpose built database management tools provide a unified management layer across heterogeneous database environments. From a single interface operators can monitor ClickHouse alongside other databases, enforce consistent backup policies, manage user access across multiple clusters, and get unified alerting across all database technologies. The goal is not to replace ClickHouse native tooling. It is to reduce operational overhead when running ClickHouse as part of a larger database fleet.
Conclusion
ClickHouse is genuinely fast. But in shared environments, speed without governance becomes a liability. Throughout this article we ran real workloads against 200 million rows on constrained 4GB nodes to show exactly how contention happens and how to control it.
The key takeaways are simple.
Lower max_threads in shared clusters. Set max_memory_usage explicitly especially on nodes with no swap. Insert in large batches to avoid merge explosions. Assign workload classes so dashboards always get priority over batch jobs. Put your primary identifier column first in the sort key and enforce row policies per tenant.
Before going to production with a shared cluster run through this quick checklist:
Primary identifier column is first in the sort key
Row policies are set to AS RESTRICTIVEmax_memory_usage and max_server_memory_usage are explicitly set
Workload hierarchy is defined with realtime, batch, and background
Quotas are assigned per user type
Inserts are batched at minimum 10,000 rows
Health snapshot query is running regularly
Good ClickHouse operations are not about maximizing every resource. They are about finding the right balance between throughput, latency, fairness, and stability for your specific workload.