blog
Building a Modern Analytics Stack Around ClickHouse

Historically, relational databases did double duty. The same PostgreSQL / MySQL instance that handled your application’s writes also answered your business questions. A well-indexed schema, a few GROUP BY reports, done. And that works, right up until it doesn’t: the reports get slower, the dashboards start eating the same I/O budget as the application; or, the sheer volume of events buries a row-oriented engine that was designed for point lookups, not scans over a billion rows.
The industry’s answer has been polyglot persistence — pick the right engine for each job. Caching went to Redis. Telemetry went to Prometheus. And analytics, increasingly, goes to a columnar OLAP engine, and among the open-source options, ClickHouse is the one that keeps coming up. This post covers where ClickHouse sits in a modern data stack, how it coexists with the relational systems you already run, and what actually changes for the team that has to keep it all healthy.
ClickHouse Primer
Introduced by Yandex, it’s an open-source, column-oriented DBMS built for analytical workloads, not for managing transactional records. Its core characteristics center around data structure, processing architecture and ingestion model.
Columnar storage
A row store reads entire rows even when your query only touches two columns out of fifty. ClickHouse stores each column as its own compressed file on disk, so a query over event_date and revenue reads exactly those two columns and nothing else. Combine that with vectorized execution, processing column values in batches using SIMD instructions, and you get the headline numbers ClickHouse is known for: billions of rows per second scanned on ordinary hardware.
Distributed processing
Scaling out works through sharding and replication. A distributed table engine fans queries out across shards and merges the results, while a Keeper-based coordination layer, Apache ZooKeeper or ClickHouse Keeper, keeps replicas consistent. That said, don’t reach for a cluster on day one. A single node with plenty of RAM and fast NVMe storage goes a surprisingly long way; bring in sharding when query latency or ingest volume actually demands it.
Real-time ingestion
This is where ClickHouse separates itself from the nightly-batch warehouse model: it can ingest millions of rows per second and make them queryable almost immediately. The MergeTree engine family writes incoming data as immutable parts on disk and merges them asynchronously in the background, conceptually similar to an LSM tree. Variants like ReplacingMergeTree and AggregatingMergeTree handle deduplication and pre-aggregation during those merges, without the lock contention you’d fight in an MVCC row store.
The Modern Analytics Stack: Components
Before placing ClickHouse on the map, it helps to name the layers of the map itself. The diagram below is the reference architecture we’ll use for the rest of the post.
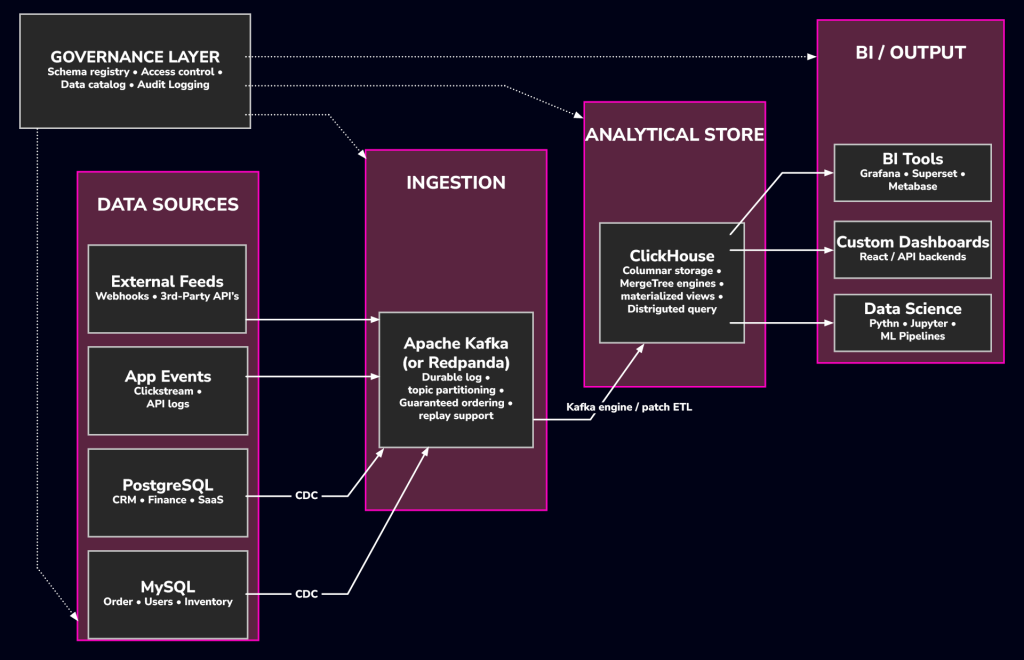
Data ingestion and streaming
Data arrives through two channels. The first is Change Data Capture: tools like Debezium or PeerDB read your OLTP database’s replication log, MySQL’s binlog, PostgreSQL’s logical replication, and publish row-level change events to Kafka. The second is direct instrumentation: clickstream events, API logs, telemetry, and IoT data that applications push straight to Kafka without touching a relational database at all.
Storage and compute engine
ClickHouse sits in the middle as the analytical store. It’s not a data lake; it manages its own storage rather than querying files in object storage, and it’s not a cloud-only warehouse either; it runs on-prem just as happily. Think of it as the query engine closest to your data consumers: low latency, high concurrency, and able to absorb high-velocity inserts from Kafka or batch pipelines without falling behind.
Visualization and BI layer
ClickHouse speaks a MySQL-compatible wire protocol and exposes a native HTTP interface, so nearly any BI tool with a SQL data source can connect to it. Grafana, Apache Superset, Metabase, Tableau, Looker, DBeaver. In most cases, the setup is nothing more than a JDBC/ODBC driver or the HTTP endpoint URL.
Governance, metadata, and security
A fast query engine alone doesn’t make a production stack. Schema registries, e.g., Confluent Schema Registry, Apicurio, enforce contract compatibility on Kafka topics and data catalogs, e.g. DataHub, track lineage and ownership. On the ClickHouse side, you get TLS for client and inter-replica traffic, row-level access policies, and column-level access control.
Database Type Comparison
Before continuing, it’s worth grounding all of this in a side-by-side comparison: a traditional OLTP store, a conventional OLAP warehouse, and ClickHouse.
| Characteristic | OLTP | Traditional OLAP | ClickHouse |
| Primary workload | Transactional reads/writes, point lookups | Batch analytics, historical reporting | Real-time and historical analytics |
| Storage model | Row-oriented | Columnar | Columnar (MergeTree family) |
| Ingestion latency | Sub-millisecond per row | Minutes to hours (batch COPY/LOAD) | Sub-second (streaming inserts) |
| Query latency (analytical) | Seconds to minutes (degrades with row count) | Seconds to tens of seconds | Milliseconds to low seconds |
| Concurrent write/read isolation | Full MVCC / ACID | Limited; primarily append-only | Eventual consistency; no row-level locking |
| UPDATE / DELETE support | Native, row-level | Supported but costly | Supported via ALTER mutations (async, expensive) |
| Typical row scale | Millions–low billions | Billions–trillions (with partitioning) | Billions–trillions (single node to cluster) |
| Horizontal scaling | Read replicas; sharding is complex | Native MPP / auto-scaling | Distributed tables with sharding + replication |
| Compression ratio | 1–2× (page-level compression) | 3–8× | 5–20× (per-column codec selection) |
| Joins | Full join support, optimised for FK lookups | Full join support | Supported; large-scale joins require careful schema design (denormalization preferred) |
| Full-text search | Basic LIKE / full-text indexes | Minimal | Bloom filters; not a replacement for dedicated search engines |
| Deployment options | Self-managed, RDS/Cloud SQL, etc. | Managed cloud only (typically) | Self-managed, ClickHouse Cloud, or local binary |
| Operational tooling | Mature: ClusterControl, Percona, pg_upgrade | Vendor-managed | Growing: ClusterControl, Altinity Operator for K8s |
| Best fit | Application state, financial records, user data | Compliance reporting, long-retention warehousing | Real-time dashboards, event analytics, observability |
How ClickHouse Co-exists with Other Databases
ClickHouse is additive. Your OLTP database keeps doing what it does best; the work is in getting data from one to the other cleanly.
OLTP stores → ETL/CDC → ClickHouse
CDC-based replication is the standard pattern. MySQL or PostgreSQL remains the source of truth for transactional integrity. Debezium (or an equivalent) tails the transaction log and pushes change events into Kafka, and from there, ClickHouse picks them up, either through its native Kafka engine or through a pipeline built on something like Flink or dbt.
One design decision deserves real thought here: do you replicate raw CDC events, or pre-aggregated facts? Raw events keep every aggregation option open downstream, but they cost more storage, and you’ll need to manage ReplacingMergeTree carefully to handle upserts. Pre-aggregating on its way in keeps ClickHouse lean and queries simple, but locks you into whatever aggregation schema you chose. There’s no universally right answer; just be deliberate about it.
Handling slow and fast lanes
Not all analytics data moves at the same speed. A typical e-commerce platform has both:
- Fast lane: clickstream events (page views, add-to-cart, checkout steps) arriving at 10,000 to 100,000 events per second through Kafka, ingested directly by ClickHouse and queryable within seconds.
- Slow lane: order records replicated from MySQL through Debezium, a few hundred per minute. Volume is low enough that pipeline latency barely matters.
The payoff of landing both in ClickHouse is that a single SQL query can join real-time funnel data against historical order revenue. Try that against the production MySQL instance, and you’ll be waiting a while, and so will your application.
Hybrid workloads and real-time dashboards
The usual end state: ClickHouse takes all analytical queries, and the OLTP database keeps all transactional reads and writes. A dashboard showing orders in the last five minutes or conversion by funnel step runs entirely on ClickHouse, with data that’s maybe 5–30 seconds behind the actual transactions. For almost any business analytics use case, that lag is a non-issue, and the queries come back orders of magnitude faster than the equivalent aggregation on MySQL would.
Operational Implications for Support and Ops Teams
Adding ClickHouse to a heterogeneous environment creates new responsibilities. Here’s what actually changes for the team on call.
Data pipelines, latency, and data freshness
Once analytics moves to ClickHouse, queries no longer hit the authoritative source. Every dashboard now carries an implicit freshness guarantee, and that guarantee is only as good as the pipeline behind it. Define the SLA explicitly, “metrics are at most 60 seconds stale”, and write it down. Then monitor end-to-end lag, not just whether each component is up. If Kafka consumer lag creeps up because ClickHouse inserts are slowing down, your dashboards quietly go stale without a single error being thrown.
Worth watching:
- Kafka consumer group lag
- ClickHouse insert latency and the asynchronous insert logs
- Debezium connector status and CDC production rate
- The time delta between the Debezium source timestamp and arrival in ClickHouse
Schema evolution, partitions, and materialized views
ClickHouse is forgiving about schema changes, with one exception. Adding, dropping, or renaming columns is fast and cheap because columnar storage means each column lives in its own files. Changing a column’s type is the expensive one: it triggers a mutation that rewrites that column’s data in every part. Plan type changes; don’t sweat the rest.
Partitioning is a first-class operational lever. Partition by a date truncation, and old data can be dropped instantly with DROP PARTITION; retention policies become nearly free. Just don’t make partitions too wide; if you partition by year instead of month, you lose the precision that makes the technique useful.
Materialized views deserve respect. In ClickHouse they’re insert triggers: every insert into the source table fires the view and writes pre-aggregated results to a target table, incrementally and in real time, no manual REFRESH like PostgreSQL. Extremely useful for running aggregates, but a badly written view sits directly in the insert path, so it can drag down ingest throughput on the source table. Test them under load.
Resource isolation and multi-tenant considerations
Resource control works through user profiles and quotas: max memory per query, concurrent queries per user, and CPU threads. If multiple teams share one cluster, per-team profiles are what stop someone’s unoptimized ad-hoc query from starving the dashboards everyone else depends on. There’s no per-query isolation at the container or cgroup level, though. If you need hard isolation, the boundary is a separate instance, or, a separate service on ClickHouse Cloud. For most teams starting out, one instance with sensible profiles is plenty.
Tools and Management in Multi-Database Operations
Run MySQL, PostgreSQL, and ClickHouse side by side, and you’re suddenly maintaining three backup toolchains, three monitoring integrations, and three sets of alert rules, unless something unifies them. That’s the operational case for ClusterControl: one management plane across relational and analytical clusters.
Why unified management matters in heterogeneous stacks
Every engine has its own backup format, replication model, and metrics vocabulary. MySQL backups mean binary logs and snapshot tooling; PostgreSQL means WAL archiving; ClickHouse has its own BACKUP commands. Run each from its own toolchain, and you can’t answer a question as basic as “is everything in my estate backed up and verified within the last 24 hours?” without stitching together data from three places.
ClusterControl pulls that into one plane:
- Unified backup scheduling and verification for MySQL, MariaDB, PostgreSQL, ClickHouse, and more
- Centralized metrics collection with dashboards per database type
- Alert routing to Slack, PagerDuty, email, etc, regardless of which engine fired the alert
- Topology visualization, health, lag, and failover state across every cluster
Implementation checklist for operational readiness
- Document data freshness SLAs for every ClickHouse table fed by a pipeline
- Monitor Kafka consumer lag, e.g. Prometheus or Kafka Exporter
- Set per-profile memory and execution-time limits in ClickHouse
- Automate partition retention with DROP PARTITION jobs
- Test ClickHouse backup and restore, including materialized view recovery
- Write down schema change procedures and their cost implications
- Track CDC pipeline health and binlog positions
- Route ClickHouse alerts through the same channels as everything else
- Write runbooks for the predictable failures: Kafka leader elections, CDC connector restarts, and merge backlogs
Ingestion Example
The following examples show two common patterns for getting data into ClickHouse: reading directly from a Kafka topic using the Kafka table engine, and bulk-loading from a CSV file.
Pattern 1: Real-time ingestion from Kafka
ClickHouse’s Kafka engine acts as a consumer of a Kafka topic. You create a Kafka engine table that describes the topic connection, and then a materialized view that pipes rows from that engine table into a MergeTree storage table. The Kafka engine table itself does not store data; it is only a consumer interface.
ClickHouse SQL – Kafka engine and materialized view
1. Create the destination storage table (MergeTree)
CREATE TABLE events.pageviews
(
    event_time   DateTime,
    session_id   UUID,
    user_id      UInt64,
    page_path    String,
    referrer     String,
    device_type  LowCardinality(String)
)
ENGINE = MergeTree()
PARTITION BY toYYYYMM(event_time)
ORDER BY (user_id, event_time);
2. Create the Kafka engine table (consumer interface, no data stored here)
CREATE TABLE events.pageviews_kafka
(
    event_time   DateTime,
    session_id   UUID,
    user_id      UInt64,
    page_path    String,
    referrer     String,
    device_type  String
)
ENGINE = Kafka
SETTINGS
    kafka_broker_list     = 'kafka-broker1:9092,kafka-broker2:9092',
    kafka_topic_list      = 'analytics.pageviews',
    kafka_group_name      = 'clickhouse-analytics-consumer',
    kafka_format          = 'JSONEachRow',
    kafka_num_consumers   = 4,
    kafka_skip_broken_messages = 5;
3. Materialized view: pipes rows from Kafka engine into MergeTree
CREATE MATERIALIZED VIEW events.pageviews_mv
TO events.pageviews
AS
SELECT
    event_time,
    session_id,
    user_id,
    page_path,
    referrer,
    device_type
FROM events.pageviews_kafka;
Once the materialized view is created, ClickHouse begins polling the Kafka topic automatically. Consumed messages are inserted into events.pageviews as MergeTree parts. Consumer offset tracking is handled by the Kafka consumer group; restart tolerance and at-least-once delivery are built in. Set kafka_skip_broken_messages to a non-zero value in production to prevent a malformed message from stalling the consumer.
Pattern 2: Bulk load from CSV
For historical data migrations or batch loads, ClickHouse accepts CSV input directly from the command line or via its HTTP interface.
Shell – bulk insert from CSV via clickhouse-client
1. Insert a CSV file with a header row into an existing table
clickhouse-client \
    --host ch-server.internal \
    --port 9000 \
    --user analytics_writer \
    --password ”${CH_PASSWORD}” \
    --query ”INSERT INTO events.pageviews FORMAT CSVWithNames” \
    < /data/exports/pageviews_2024.csv
2. Alternatively, using the HTTP interface (suitable for remote or scripted loads)
curl -X POST \
”http://ch-server.internal:8123/?query=INSERT+INTO+events.pageviews+FORMAT+CSVWithNames&user=analytics_writer&password=${CH_PASSWORD}” \
--data-binary @/data/exports/pageviews_2024.csv
For large CSV loads, prefer splitting the file into chunks of 1–10 million rows and inserting each chunk as a separate INSERT batch. ClickHouse performs optimal part creation at insert batch sizes in this range. Very large single inserts, i.e. hundreds of millions of rows can produce oversized initial parts that take a long time to merge, potentially impacting query performance during the load.
Case Study: E-Commerce Analytics Stack
An e-commerce example of integrating ClickHouse with MySQL and Kafka. A mid-sized platform uses this production stack:
- MySQL 8.0 (via ClusterControl) for transactional core data
- Redis for session and cart state
- Kafka for microservices event routing
The challenge: analytical queries cause production latency in MySQL. The solution adds ClickHouse as a dedicated tier for real-time dashboards without altering existing deployments.
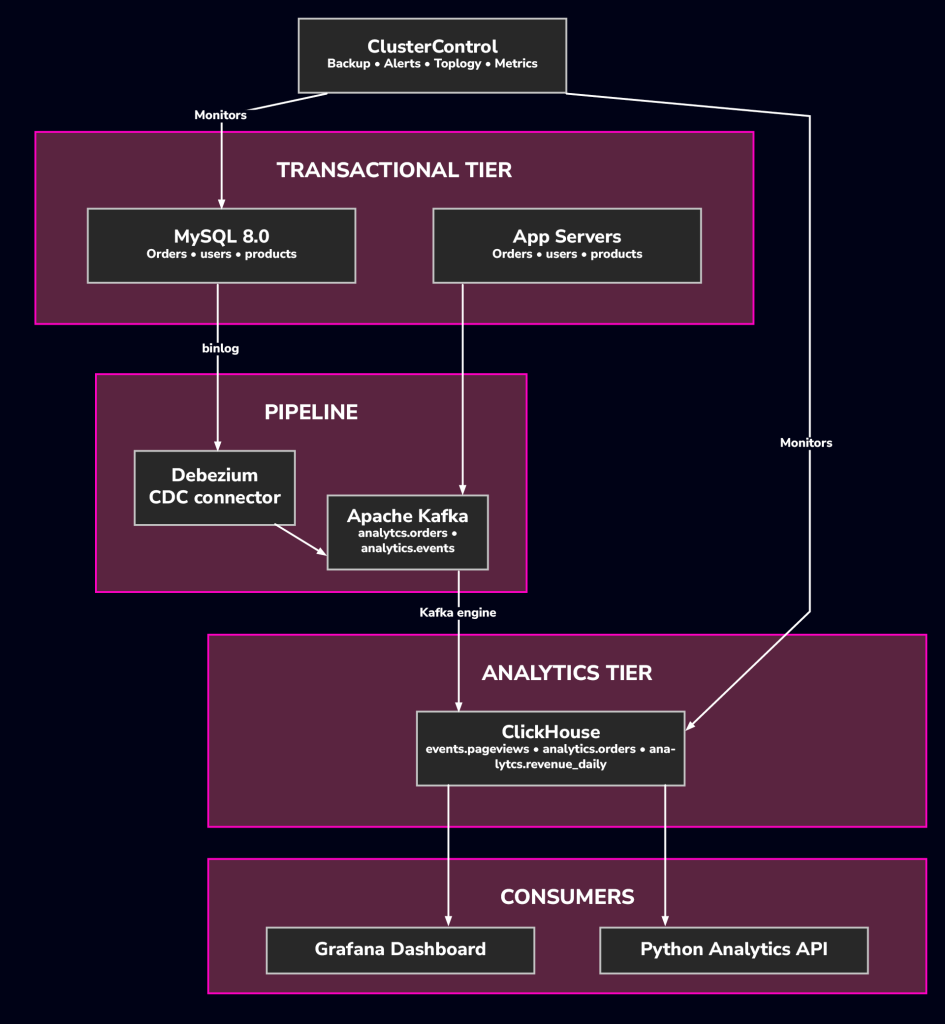
What changes for the operations team
Adding ClickHouse introduces a new cluster to the managed estate. Since ClusterControl already handles the MySQL cluster, bringing ClickHouse under the same management plane ensures:
- ClickHouse and MySQL backups are configured and verified through a single interface.
- Performance metrics for both ClickHouse and MySQL share the same Grafana dashboards.
- Alerting for disk usage, replication lag, and Kafka consumer lag is centrally managed.
While the platform engineering team oversees the Debezium connector and Kafka cluster, their performance remains critical for ClickHouse data freshness.
Conclusion
ClickHouse fills a real gap: fast, scalable analytics over high-volume event data, at query latencies no row-oriented database can reach at scale. It doesn’t replace MySQL or PostgreSQL; it sits beside them, consuming their change streams and your application events, and takes the analytical load off your transactional tier. For ops teams, four principles carry most of the weight:
- Treat pipeline health as a first-class concern. Your query results are only as fresh as the pipeline feeding them. Watch Kafka lag and CDC health with the same rigor you give replication lag.
- Model for analytics, not normalization. Wide, denormalized tables are how ClickHouse wants to work. If denormalizing feels wrong to your relational instincts, that discomfort is usually the sign you’re doing it right.
- Plan for schema evolution early. Adding and dropping columns is cheap; changing column types is not. Have the procedure written before you need it.
- Centralize management. Fragmented tooling fragments visibility. One plane for backups, alerts, and monitoring across the whole fleet pays for its setup cost quickly.
ClickHouse isn’t the answer to every workload. But if your analytical queries have outgrown your OLTP tier, it’s one of the most direct and operationally manageable ways out. Start with a single node, replicate one or two high-value streams from Kafka, and measure. The added complexity is modest; the capability gained is not.