blog
ClickHouse Monitoring and Observability Decision Points
Given ClickHouse’s ability to execute complex analytical queries across terabytes of data in a single operation, proper monitoring and observability is critical. Its distributed architecture and scalability add layers of complexity, as multi-node clusters require careful coordination monitoring across shards and replicas to ensure data consistency and availability.
Adding to the operational pressure is users’ expectations of real-time analytics with sub-second response times. Meeting them requires staying ahead of performance issues rather than simply reacting to them. Therefore, monitoring isn’t enough for ClickHouse, you need full observability.
So what’s the difference? Observability gives you the complete picture by bringing together three essential components: metrics, logs, and traces. Combined with smart alerting, you can catch issues early and keep your system running smoothly. For sysadmins and ops teams managing large-scale data in ClickHouse, this approach makes all the difference.
In this post, I’ll lay out the strategies, techniques and tooling needed to proactively optimize ClickHouse performance and maintain peak efficiency. First up, why monitoring and observability are essential for ClickHouse.
Monitoring and observability is essential for ClickHouse
An efficient observability and monitoring strategy facilitates the following operations:
- Early detection of performance bottlenecks – identifying slow queries, resource contention, and inefficient table designs before they impact user experience.
- Maintaining and ensuring query optimization – tracking query execution patterns to fine-tune indexes, partitioning strategies, and materialized views for maximum throughput.
- Determining resource utilization – monitoring CPU, memory, disk, and network to prevent resource exhaustion and maintain consistent performance under heavy workloads.
- Observing data pipeline health – observing data ingestion rates, transforming / loading of data (ETL), replication lag, and merge operations to ensure data freshness and reliability
- Enabling proactive capacity planning – analyzing usage trends and growth patterns to scale infra before hitting limits, helping to determine horizontal vs. vertical scaling.
- Troubleshooting distributed queries – Gaining visibility into multi-node query execution, network latency, and inter-node communication in clustered environments
- Ensuring high availability – Monitoring replica synchronization, failover mechanisms, and cluster health to minimize downtime.
- Tracking data quality and consistency – Validating data integrity, detecting anomalies, and ensuring compliance with SLAs.
Without proper observability, even the most optimized ClickHouse deployment can suffer from hidden inefficiencies, unexpected failures, and degraded performance that only becomes apparent when it’s too late.
Key ClickHouse metrics to track
It’s worth noting that, without monitoring and observability in a ClickHouse cluster, you’re flying blind in an environment where the following scenario shall be the cluster’s state:
- A single poorly optimized query can consume cluster resources
- Silent data quality issues can corrupt analytics
- Replication lag can lead to inconsistent results
- Resource exhaustion can cascade across the entire cluster
Conversely, there are key areas that need to be tracked in order to monitor the database performance and analyze the health of your ClickHouse environment. We’ll go through them.
Key observability components in ClickHouse
There are extensive system tables for observability in ClickHouse which are very useful for observability to collect metrics, logs, and traces. These read-only tables are located in the system database and can be detached, but not dropped. The tables provide information about:
- Server states, processes (both internal and external), and environment.
- Options used when the ClickHouse binary was built.
The list of system tables below are commonly the source of insights you can rely for observability:
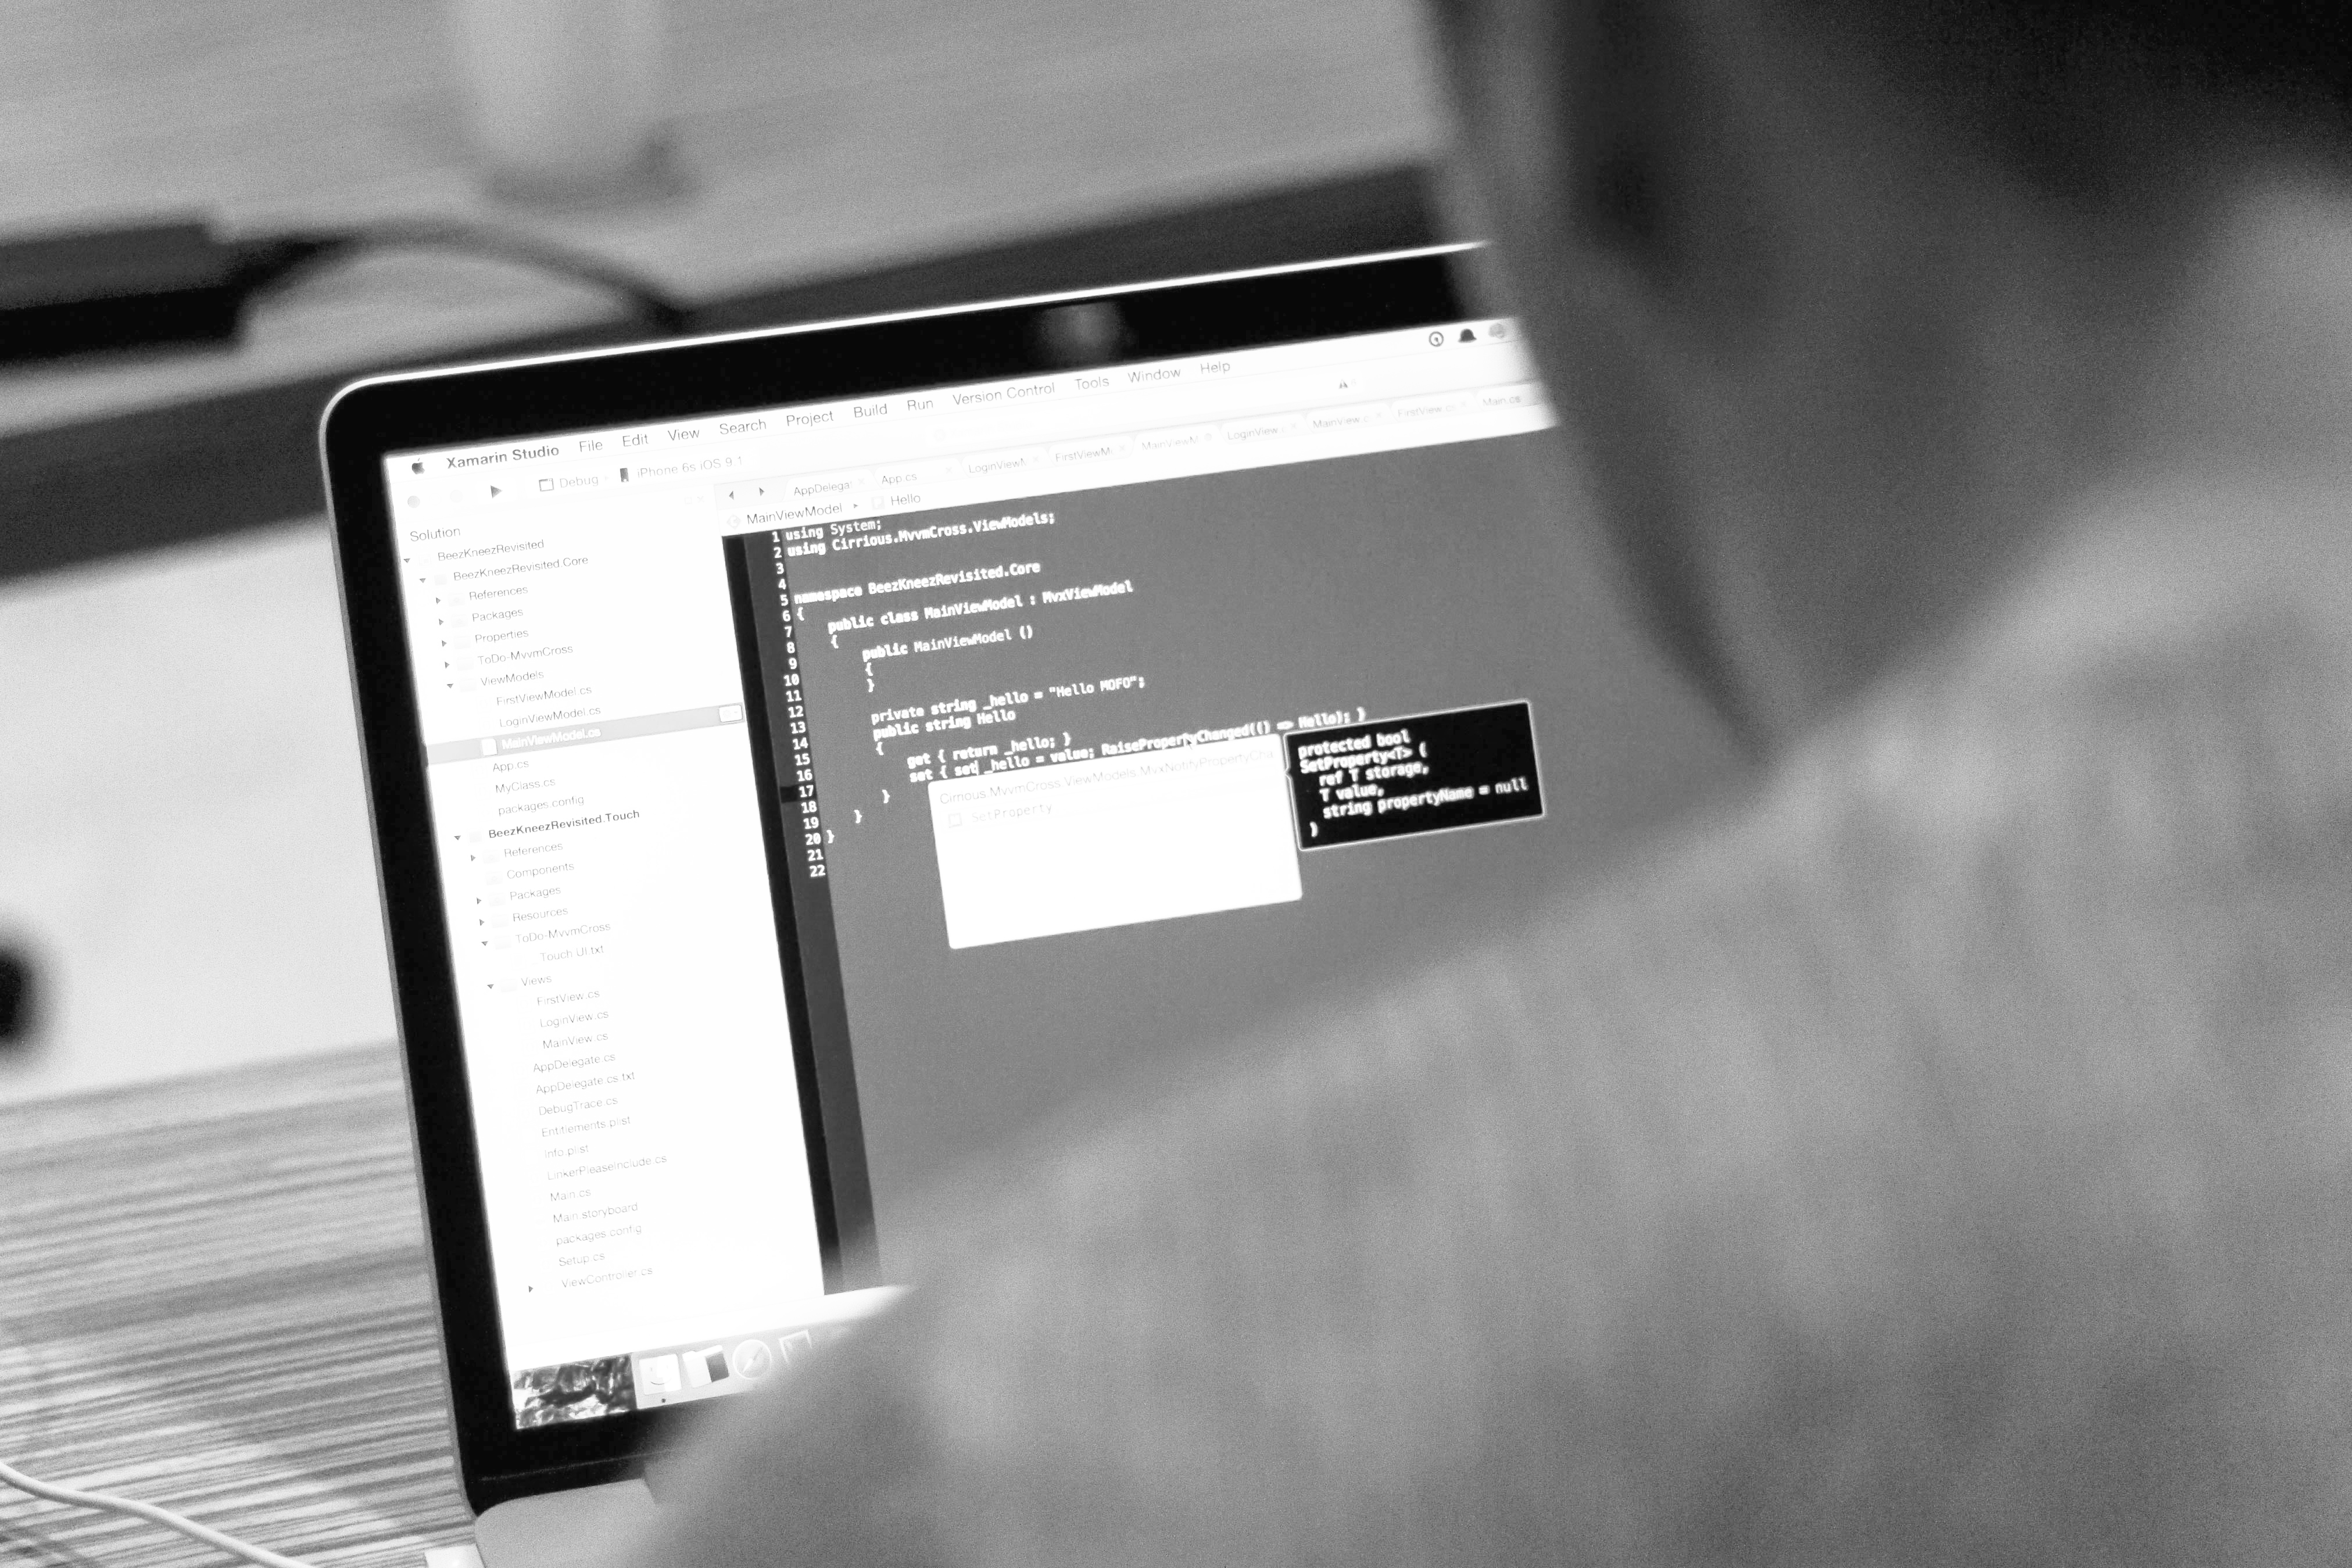
system.query_log– detailed query execution historysystem.processes– currently running queriessystem.events– cumulative event counterssystem.parts– information about data partssystem.metrics– real-time metrics (current values)system.dashboards– queries used by /dashboard page accessible though HTTPsystem.asynchronous_metrics– periodically calculated metricssystem.backups– all BACKUP or RESTORE operations and other details.system.disks– information about disks defined in the server configuration.system.replicas– replication statussystem.clusters– cluster configuration and health
Key areas to monitor in ClickHouse
Practices used to administer database clusters, especially OLAP databases, depend heavily on the key areas that are regularly examined and observed. Monitoring key metrics in ClickHouse is essential to achieving and maintaining fast, reliable, and cost efficient analytical workloads.
By tracking metrics such as query latency, error rates, insert throughput, number of parts, and replication lag, you gain early visibility into performance bottlenecks and operational risks before they impact users. The goal of maintaining and applying best practices is to troubleshoot incidents quickly and preserve predictable behavior as your data and traffic grow.
Hence, these are the areas and key metrics that need your eyes and attention:
Query performance
- Queries per second
- Query execution time
- Read / write throughput
- Number of rows processed
Performance & resource utilization
- CPU utilization based on the queries applied
- Query latency & throughput (by query type, user, or workload class)
- Memory consumption
- Disk I/O operations and latency
- Merge performance (queue size, merge times)
- Network bandwidth
Disk operations
- Insert rate and volume
- Merge operations frequency
- Number of active parts
- Data compression ratio
Cluster health
- Replica synchronization and replication queue status
- Coordination service (ZooKeeper / ClickHouse Keeper) session
- Quorum status
- Node availability and role health (ingest/query/background)
- Failed queries (rate, error types)
- Connection pool usage and connection failures
Network and topology (especially important for hybrid / on‑prem)
- Inter-replica and inter-shard latency and errors
- Cross‑DC / cross‑region traffic metrics
- Bandwidth utilization for replication and large reads / writes
Reliability and operations
- Backup and restore status
- Schema changes & mutation queue status
- Coordination service stability (leader elections, latency spikes)
Alerting strategy
An alerting strategy for ClickHouse should mainly prioritize those areas that are going to hit critical thresholds quickly e.g., resource exhaustion, query failures, etc. over noise. Using tools such as Prometheus / VictoriaMetrics + Grafana + Alertmanager + PagerDuty / Slack is ideal.
Critical metrics and alert thresholds
Below are good thresholds, organized by category that’ll get you started, as well their sources:
System usage resource
- CPU usage
- Set a threshold around >80% for 5min and throw a Warning alert.
- Source:
system.metrics
- Memory usage
- Consider a threshold of >90% then throw a Critical alert.
- Source:
system.metrics
- Disk space
- Consider a threshold of >85% used then throw a Critical alert.
- Source:
system.disks
- Disk I/O wait
- Set a threshold around >85% used then throw a Critical alert.
- Source: via
procfsorsysfs
Query performance
- Query duration (P95):
- Set a threshold for >10s and throw a Warning alert.
- Source:
system.query_log
- Failed queries
- Set a threshold for >5% rate and throw a Critical alert.
- Source:
system.query_log
- Concurrent queries
- Set a threshold when the total number reaches >100 and throw a Warning alert.
- Source:
system.metrics
- Query queue size
- Set a threshold when the total number reaches > 50 and throw a Critical alert.
- Source:
system.metrics
Data Ingestion
- Insert rate drop
- Set a threshold when the rate drops < 50% then throw a Warning alert.
- Source:
system.events
- Insert failures
- Set a threshold for >1% rate and throw a Critical alert.
- Source:
system.query_log
Merge operations (MergeTree / ReplicatedMergeTree)
- Parts count
- Set a threshold >300 per partition then throw a Warning alert.
- Source:
system.parts
- Merge queue size
- Set a threshold for >100 then throw a Warning alert.
- Source:
system.metrics
- Background tasks
- Set a threshold when Pool saturation >80% then throw a Warning alert.
- Source:
system.metrics
- Mutations running
- Set a threshold for mutations stuck > 1h then throw a Critical alert.
- Source:
system.mutations
Replication
- Replication lag
- Set a threshold >300 per partition then throw a Warning alert.
- Source:
system.parts
- Replication queue
- Set a threshold for >100 tasks then throw a Warning alert.
- Source:
system.replication_queue
- Replica status
- Set a threshold when is_readonly=1 (something went broke in the replication) then throw a Critical alert.
- Source:
system.replicas
Cluster health
- Node availability
- Throw Critical alert if node(s) goes down.
- Source: Prometheus or VictoriaMetrics
- Distributed query failures
- Set a threshold for >2% then throw a Critical alert.
- Source:
system.query_log
- Network latency
- Set a threshold when >100ms inter-node communication then throw a Warning alert.
- Source: via
procfsorsysfs
Dashboard best practices
It’s important to have a dashboard that is designed with a set of core principles that prioritize ease of use, performance, and flexibility and is easy to set up and configure. From open-source to enterprise-grade tools, there are options. Relying on open-source tools, it’s widely common to use Prometheus / VictoriaMetrics + Grafana + AlertManager integrated with other 3rd party tools, such as PagerDuty, Slack, OpsGenie, etc. to send high-severity alerts.
Any tool you are evaluating should have these functionalities:
- Scraping: Use the ClickHouse built-in Prometheus-friendly output or a dedicated exporter (like the official one) to collect metrics.
- Cardinality: ClickHouse metrics can have high cardinality e.g., many unique query IDs.
- Recording Rules: Pre-calculate frequently queried or computationally expensive metrics.
Managing alerts
Let’s look at Alertmanager as an example, which handles de-duplication, grouping, inhibition, and routing of alerts to receivers like Slack or PagerDuty. This allows to do the following:
Actionable and clear alerts
- Specificity: Use specific messages that are clear and specific to the intention of the alert such as ClickHouse: High Insert Latency on Cluster X.
- Context: Include labels (severity, instance, cluster) and annotations (summary, description, runbook links) in your Prometheus alert rules.
- Severity levels: Assign clear severity labels (critical, warning) to all alerts to ensure proper routing to PagerDuty (for on-call) versus Slack (for general awareness).
Reduce alert fatigue
- Grouping: Configure Alertmanager to group similar alerts e.g., group by alertname and cluster into a single notification. This prevents a cascade of alerts from overwhelming the on-call person.
- Inhibition: Use inhibition rules to suppress less critical alerts when a major one is firing. For example, if the ClickHouseInstanceDown alert is active for a host, inhibit alerts for DiskSpaceLow on the same host, as the host being down is the root cause.
- Throttling / timing: Utilize the for clause in Prometheus rules e.g., for: 5m to ensure a condition persists before an alert fires, avoiding alerts for transient issues (flapping). Configure
group_wait,group_interval, andrepeat_intervalin Alertmanager to control notification frequency.
Integration with third-party tooling
Using the example of Slack / PagerDuty for third-party integration tools, below are the recommendations and guidelines you can follow:
- Routing: Define routing tree in Alertmanager’s configuration to send high-severity alerts (critical) to PagerDuty for on-call immediate response and lower-severity alerts (warning, info) to Slack channels for visibility.
- PagerDuty: Integrate using the Events API V2. Set
send_resolved: trueto automatically resolve PagerDuty incidents when the Prometheus alert is cleared. Use event rules in PagerDuty to filter or enrich events. - Slack: Create a dedicated channel for incident coordination. Leverage notification templates to standardize the look and feel of alerts, including buttons for acknowledging / resolving incidents directly from Slack (especially if using the PagerDuty integration).
Commercial or enterprise-grade tools
ClickHouse also offers ClickStack which is a production-grade observability platform built specifically for ClickHouse. It features unifying logs, traces, metrics and sessions in a single high-performance solution. Designed for monitoring and debugging complex systems, ClickStack enables developers and SREs to trace issues end-to-end without switching between tools or manually stitching together data using timestamps or correlation IDs.
If it suits your budget, enterprise tools are highly advisable as it offers less headache, suitability for your environment, ease and comfortability to maintain the software as you rely on the maintainer itself plus the support mechanism that the software offers.
Conclusion
In the end, getting monitoring and observability right for ClickHouse is the difference between passively assuming the cluster is healthy and having hard, real-time data that tells you exactly what’s happening across queries, resources, and internals. When you focus on the right metrics, set up alerts that really matter, and build dashboards that answer real questions instead of just looking good, you put yourself in a much stronger position. You can catch issues early, understand what’s happening under the hood, and scale your cluster with a lot more confidence.
You also don’t need to have everything perfect on day one. Start simple: keep an eye on performance and resource usage, set alerts around the parts of the system you care about most, and build a few dashboards your team will actually check. As your ClickHouse workloads grow, you can refine what you track, adjust your alert thresholds, and evolve your setup over time.
By treating observability as an ongoing practice, ClickHouse becomes a system you understand, trust, and can tune as you go, instead of a blackbox you’re constantly second-guessing.