blog
How to Identify MySQL Performance Issues with Slow Queries

Performance issues are common problems when administering MySQL databases. Sometimes these problems are, in fact, due to slow queries. In this blog, we’ll deal with slow queries and how to identify these.
Checking Your Slow Query Logs
MySQL has the capability to filter and log slow queries. There are various ways you can investigate these, but the most common and efficient way is to use the slow query logs.
You need to determine first if your slow query logs are enabled. To deal with this, you can go to your server and query the following variable:
MariaDB [(none)]> show global variables like 'slow%log%';

+---------------------+-------------------------------+

| Variable_name       | Value           |

+---------------------+-------------------------------+

| slow_query_log      | ON           |

| slow_query_log_file | /var/log/mysql/mysql-slow.log |

+---------------------+-------------------------------+

2 rows in set (0.001 sec)
You must ensure that the variable slow_query_log is set to ON, while the slow_query_log_file determines the path where you need to place your slow query logs. If this variable is not set, it will use the DATA_DIR of your MySQL data directory.
Accompanied by the slow_query_log variable are the long_query_time and min_examined_row_limit which impacts how the slow query logging works. Basically, the slow query logs work as SQL statements that take more than long_query_time seconds to execute and also require at least min_examined_row_limit rows to be examined. It can be used to find queries that take a long time to execute and are therefore candidates for optimization and then you can use external tools to bring the report for you, which will talk later.
By default, administrative statements (ALTER TABLE, ANALYZE TABLE, CHECK TABLE, CREATE INDEX, DROP INDEX, OPTIMIZE TABLE, and REPAIR TABLE) do not fall into slow query logs. In order to do this, you need to enable variable log_slow_admin_statements.
Querying Process List and InnoDB Status Monitor
In a normal DBA routine, this step is the most common way to determine the long running queries or active running queries that causes performance degradation. It might even cause your server to be stuck followed by piled up queues that are slowly increasing due to a lock covered by a running query. You can just simply run,
SHOW [FULL] PROCESSLIST;or
SHOW ENGINE INNODB STATUS GIf you are using ClusterControl, you can find it by using just like below,
or using (which will discuss later) to view the active processes, just like how a SHOW PROCESSLIST works but with better control of the queries.
Analyzing MySQL Queries
The slow query logs will show you a list of queries that have been identified as slow, based on the given values in the system variables as mentioned earlier. The slow queries definition might differ in different cases since there are certain occasions that even a 10 second query is acceptable and still not slow. However, if your application is an OLTP, it’s very common that a 10 second or even a 5 second query is an issue or causes performance degradation to your database. MySQL query log does help you this but it’s not enough to open the log file as it does not provide you an overview of what are those queries, how they perform, and what are the frequency of their occurrence. Hence, third party tools can help you with these.
pt-query-digest
Using Percona Toolkit, which I can say the most common DBA tool, is to use pt-query-digest. pt-query-digest provides you a clean overview of a specific report coming from your slow query log. For example, this specific report shows a clean perspective of understanding the slow query reports in a specific node:
# A software update is available:


# 100ms user time, 100ms system time, 29.12M rss, 242.41M vsz

# Current date: Mon Feb  3 20:26:11 2020

# Hostname: testnode7

# Files: /var/log/mysql/mysql-slow.log

# Overall: 24 total, 14 unique, 0.00 QPS, 0.02x concurrency ______________

# Time range: 2019-12-12T10:01:16 to 2019-12-12T15:31:46

# Attribute          total min max     avg 95% stddev median

# ============     ======= ======= ======= ======= ======= ======= =======

# Exec time           345s 1s 98s   14s 30s 19s 7s

# Lock time             1s 0 1s 58ms    24ms 252ms 786us

# Rows sent          5.72M 0 1.91M 244.14k   1.86M 629.44k 0

# Rows examine      15.26M 0 1.91M 651.23k   1.86M 710.58k 961.27k

# Rows affecte       9.54M 0 1.91M 406.90k 961.27k 546.96k       0

# Bytes sent       305.81M 11 124.83M  12.74M 87.73M 33.48M 56.92

# Query size         1.20k 25 244   51.17 59.77 40.60 38.53


# Profile

# Rank Query ID                         Response time Calls R/Call V/M

# ==== ================================ ============= ===== ======= =====

#    1 0x00C8412332B2795DADF0E55C163... 98.0337 28.4%     1 98.0337 0.00 UPDATE sbtest?

#    2 0xDEF289292EA9B2602DC12F70C7A... 74.1314 21.5%     3 24.7105 6.34 ALTER TABLE sbtest? sbtest3

#    3 0x148D575F62575A20AB9E67E41C3... 37.3039 10.8%     6 6.2173 0.23 INSERT SELECT sbtest? sbtest

#    4 0xD76A930681F1B4CC9F748B4398B... 32.8019  9.5% 3 10.9340 4.24 SELECT sbtest?

#    5 0x7B9A47FF6967FD905289042DD3B... 20.6685  6.0% 1 20.6685 0.00 ALTER TABLE sbtest? sbtest3

#    6 0xD1834E96EEFF8AC871D51192D8F... 19.0787  5.5% 1 19.0787 0.00 CREATE

#    7 0x2112E77F825903ED18028C7EA76... 18.7133  5.4% 1 18.7133 0.00 ALTER TABLE sbtest? sbtest3

#    8 0xC37F2569578627487D948026820... 15.0177  4.3% 2 7.5088 0.00 INSERT SELECT sbtest? sbtest

#    9 0xDE43B2066A66AFA881D6D45C188... 13.7180  4.0% 1 13.7180 0.00 ALTER TABLE sbtest? sbtest3

# MISC 0xMISC                           15.8605 4.6% 5 3.1721 0.0 <5 ITEMS>


# Query 1: 0 QPS, 0x concurrency, ID 0x00C8412332B2795DADF0E55C1631626D at byte 5319

# Scores: V/M = 0.00

# Time range: all events occurred at 2019-12-12T13:23:15

# Attribute    pct total min     max avg 95% stddev  median

# ============ === ======= ======= ======= ======= ======= ======= =======

# Count          4 1

# Exec time     28 98s 98s     98s 98s 98s   0 98s

# Lock time      1 25ms 25ms    25ms 25ms 25ms       0 25ms

# Rows sent      0 0 0       0 0 0 0       0

# Rows examine  12 1.91M 1.91M   1.91M 1.91M 1.91M       0 1.91M

# Rows affecte  20 1.91M 1.91M   1.91M 1.91M 1.91M       0 1.91M

# Bytes sent     0 67 67      67 67 67   0 67

# Query size     7 89 89      89 89 89   0 89

# String:

# Databases    test

# Hosts        localhost

# Last errno   0

# Users        root

# Query_time distribution

#   1us

#  10us

# 100us

#   1ms

#  10ms

# 100ms

#    1s

#  10s+  ################################################################

# Tables

#    SHOW TABLE STATUS FROM `test` LIKE 'sbtest3'G

#    SHOW CREATE TABLE `test`.`sbtest3`G

update sbtest3 set c=substring(MD5(RAND()), -16), pad=substring(MD5(RAND()), -16) where 1G

# Converted for EXPLAIN

# EXPLAIN /*!50100 PARTITIONS*/

select  c=substring(MD5(RAND()), -16), pad=substring(MD5(RAND()), -16) from sbtest3 where  1G


# Query 2: 0.00 QPS, 0.01x concurrency, ID 0xDEF289292EA9B2602DC12F70C7A041A9 at byte 3775

# Scores: V/M = 6.34

# Time range: 2019-12-12T12:41:47 to 2019-12-12T15:25:14

# Attribute    pct total min     max avg 95% stddev  median

# ============ === ======= ======= ======= ======= ======= ======= =======

# Count         12 3

# Exec time     21 74s 6s     36s 25s 35s 13s     30s

# Lock time      0 13ms 1ms     8ms 4ms 8ms   3ms 3ms

# Rows sent      0 0 0       0 0 0 0       0

# Rows examine   0 0 0       0 0 0 0       0

# Rows affecte   0 0 0       0 0 0 0       0

# Bytes sent     0 144 44      50 48 49.17   3 49.17

# Query size     8 99 33      33 33 33   0 33

# String:

# Databases    test

# Hosts        localhost

# Last errno   0 (2/66%), 1317 (1/33%)

# Users        root

# Query_time distribution

#   1us

#  10us

# 100us

#   1ms

#  10ms

# 100ms

#    1s ################################

#  10s+  ################################################################

# Tables

#    SHOW TABLE STATUS FROM `test` LIKE 'sbtest3'G

#    SHOW CREATE TABLE `test`.`sbtest3`G

ALTER TABLE sbtest3 ENGINE=INNODBG
Using performance_schema
Slow query logs might be an issue if you don’t have direct access to the file such as using RDS or using fully-managed database services such Google Cloud SQL or Azure SQL. Although it might need you some variables to enable these features, it comes handy when querying for queries logged into your system. You can order it by using a standard SQL statement in order to retrieve a partial result. For example,
mysql> SELECT SCHEMA_NAME, DIGEST, DIGEST_TEXT, COUNT_STAR, SUM_TIMER_WAIT/1000000000000 SUM_TIMER_WAIT_SEC, MIN_TIMER_WAIT/1000000000000 MIN_TIMER_WAIT_SEC, AVG_TIMER_WAIT/1000000000000 AVG_TIMER_WAIT_SEC, MAX_TIMER_WAIT/1000000000000 MAX_TIMER_WAIT_SEC, SUM_LOCK_TIME/1000000000000 SUM_LOCK_TIME_SEC, FIRST_SEEN, LAST_SEEN FROM events_statements_summary_by_digest;

+--------------------+----------------------------------+-----------------------------------------------------------------------------------------------------------------------------------------------------------------------------------------------------------------------------------------------------------------------------------------------------------------------------------------------------------------+------------+--------------------+--------------------+--------------------+--------------------+-------------------+---------------------+---------------------+

| SCHEMA_NAME        | DIGEST               | DIGEST_TEXT                                                                                                                                                                                                                                                                                                                               | COUNT_STAR | SUM_TIMER_WAIT_SEC | MIN_TIMER_WAIT_SEC | AVG_TIMER_WAIT_SEC | MAX_TIMER_WAIT_SEC | SUM_LOCK_TIME_SEC | FIRST_SEEN | LAST_SEEN |

+--------------------+----------------------------------+-----------------------------------------------------------------------------------------------------------------------------------------------------------------------------------------------------------------------------------------------------------------------------------------------------------------------------------------------------------------+------------+--------------------+--------------------+--------------------+--------------------+-------------------+---------------------+---------------------+

| NULL               | 390669f3d1f72317dab6deb40322d119 | SELECT @@`skip_networking` , @@`skip_name_resolve` , @@`have_ssl` = ? , @@`ssl_key` , @@`ssl_ca` , @@`ssl_capath` , @@`ssl_cert` , @@`ssl_cipher` , @@`ssl_crl` , @@`ssl_crlpath` , @@`tls_version`                                                                                                                                                             | 1 | 0.0373 | 0.0373 | 0.0373 | 0.0373 | 0.0000 | 2020-02-03 20:22:54 | 2020-02-03 20:22:54 |

| NULL               | fba95d44e3d0a9802dd534c782314352 | SELECT `UNIX_TIMESTAMP` ( )                                                                                                                                                                                                                                                                                                                                     | 2 | 0.0002 | 0.0001 | 0.0001 | 0.0001 | 0.0000 | 2020-02-03 20:22:57 | 2020-02-03 20:23:00 |

| NULL               | 18c649da485456d6cdf12e4e6b0350e9 | SELECT @@GLOBAL . `SERVER_ID`                                                                                                                                                                                                                                                                                                                                   | 2 | 0.0001 | 0.0001 | 0.0001 | 0.0001 | 0.0000 | 2020-02-03 20:22:57 | 2020-02-03 20:23:00 |

| NULL               | dd356b8a5a6ed0d7aee2abd939cdb6c9 | SET @? = ?                                                                                                                                                                                                                                                                                                                                                      | 6 | 0.0003 | 0.0000 | 0.0001 | 0.0001 | 0.0000 | 2020-02-03 20:22:57 | 2020-02-03 20:23:00 |

| NULL               | 1c5ae643e930af6d069845d74729760d | SET @? = @@GLOBAL . `binlog_checksum`                                                                                                                                                                                                                                                                                                                           | 2 | 0.0001 | 0.0001 | 0.0001 | 0.0001 | 0.0000 | 2020-02-03 20:22:57 | 2020-02-03 20:23:00 |

| NULL               | ad5208ffa004a6ad7e26011b73cbfb4c | SELECT @?                                                                                                                                                                                                                                                                                                                                                       | 2 | 0.0001 | 0.0000 | 0.0000 | 0.0001 | 0.0000 | 2020-02-03 20:22:57 | 2020-02-03 20:23:00 |

| NULL               | ed0d1eb982c106d4231b816539652907 | SELECT @@GLOBAL . `GTID_MODE`                                                                                                                                                                                                                                                                                                                                   | 2 | 0.0001 | 0.0000 | 0.0000 | 0.0001 | 0.0000 | 2020-02-03 20:22:57 | 2020-02-03 20:23:00 |

| NULL               | cb47e22372fdd4441486b02c133fb94f | SELECT @@GLOBAL . `SERVER_UUID`                                                                                                                                                                                                                                                                                                                                 | 2 | 0.0001 | 0.0000 | 0.0000 | 0.0001 | 0.0000 | 2020-02-03 20:22:57 | 2020-02-03 20:23:00 |

| NULL               | 73301368c301db5d2e3db5626a21b647 | SELECT @@GLOBAL . `rpl_semi_sync_master_enabled`                                                                                                                                                                                                                                                                                                                | 2 | 0.0001 | 0.0000 | 0.0000 | 0.0000 | 0.0000 | 2020-02-03 20:22:57 | 2020-02-03 20:23:00 |

| NULL               | 0ff7375c5f076ba5c040e78a9250a659 | SELECT @@`version_comment` LIMIT ?                                                                                                                                                                                                                                                                                                                              | 1 | 0.0001 | 0.0001 | 0.0001 | 0.0001 | 0.0000 | 2020-02-03 20:45:59 | 2020-02-03 20:45:59 |

| NULL               | 5820f411e67a393f987c6be5d81a011d | SHOW TABLES FROM `performance_schema`                                                                                                                                                                                                                                                                                                                           | 1 | 0.0008 | 0.0008 | 0.0008 | 0.0008 | 0.0002 | 2020-02-03 20:46:11 | 2020-02-03 20:46:11 |

| NULL               | a022a0ab966c51eb820da1521349c7ef | SELECT SCHEMA ( )                                                                                                                                                                                                                                                                                                                                               | 1 | 0.0005 | 0.0005 | 0.0005 | 0.0005 | 0.0000 | 2020-02-03 20:46:29 | 2020-02-03 20:46:29 |

| performance_schema | e4833a7c1365b0b4492e9a514f7b3bd4 | SHOW SCHEMAS                                                                                                                                                                                                                                                                                                                                                    | 1 | 0.1167 | 0.1167 | 0.1167 | 0.1167 | 0.0001 | 2020-02-03 20:46:29 | 2020-02-03 20:46:29 |

| performance_schema | 1107f048fe6d970cb6a553bd4727a1b4 | SHOW TABLES                                                                                                                                                                                                                                                                                                                                                     | 1 | 0.0002 | 0.0002 | 0.0002 | 0.0002 | 0.0000 | 2020-02-03 20:46:29 | 2020-02-03 20:46:29 |

...
You can use the table performance_schema.events_statements_summary_by_digest. Although there are chances that the entries on the tables from performance_schema will be flush, you can decide to save this in a specific table. Take a look at this external post from Percona MySQL query digest with Performance Schema.
In case you’re wondering why we need to divide the wait time columns (SUM_TIMER_WAIT, MIN_TIMER_WAIT_SEC, AVG_TIMER_WAIT_SEC), these columns are using picoseconds so you might need to do some math or some round ups to make it more readable to you.
Analyzing Slow Queries Using ClusterControl
If you are using ClusterControl, there are different ways to deal with this. For example, in a MariaDB Cluster I have below, it shows you the following tab (Query Monitor) and it’s drop-down items (Top Queries, Running Queries, Query Outliers):
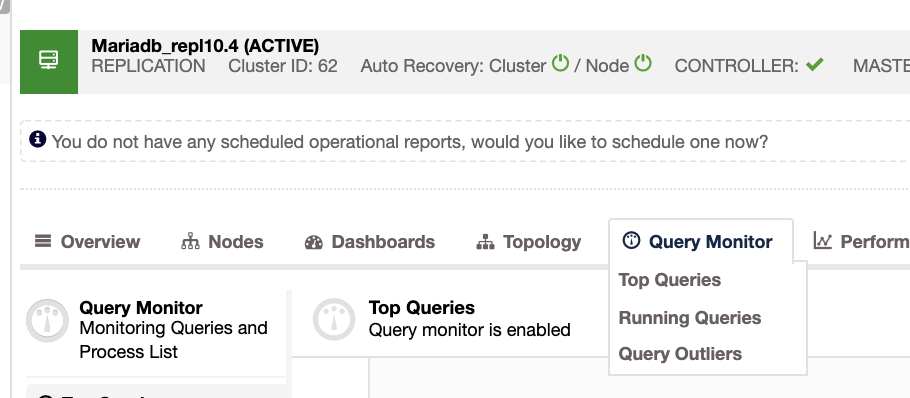
- Top Queries – aggregated list of all your top queries running on all the nodes of your database cluster
- Running Queries – View current running queries on your database cluster similar to SHOW FULL PROCESSLIST command in MySQL
- Query Outliers – Shows queries that are outliers. An outlier is a query taking longer time than the normal query of that type.
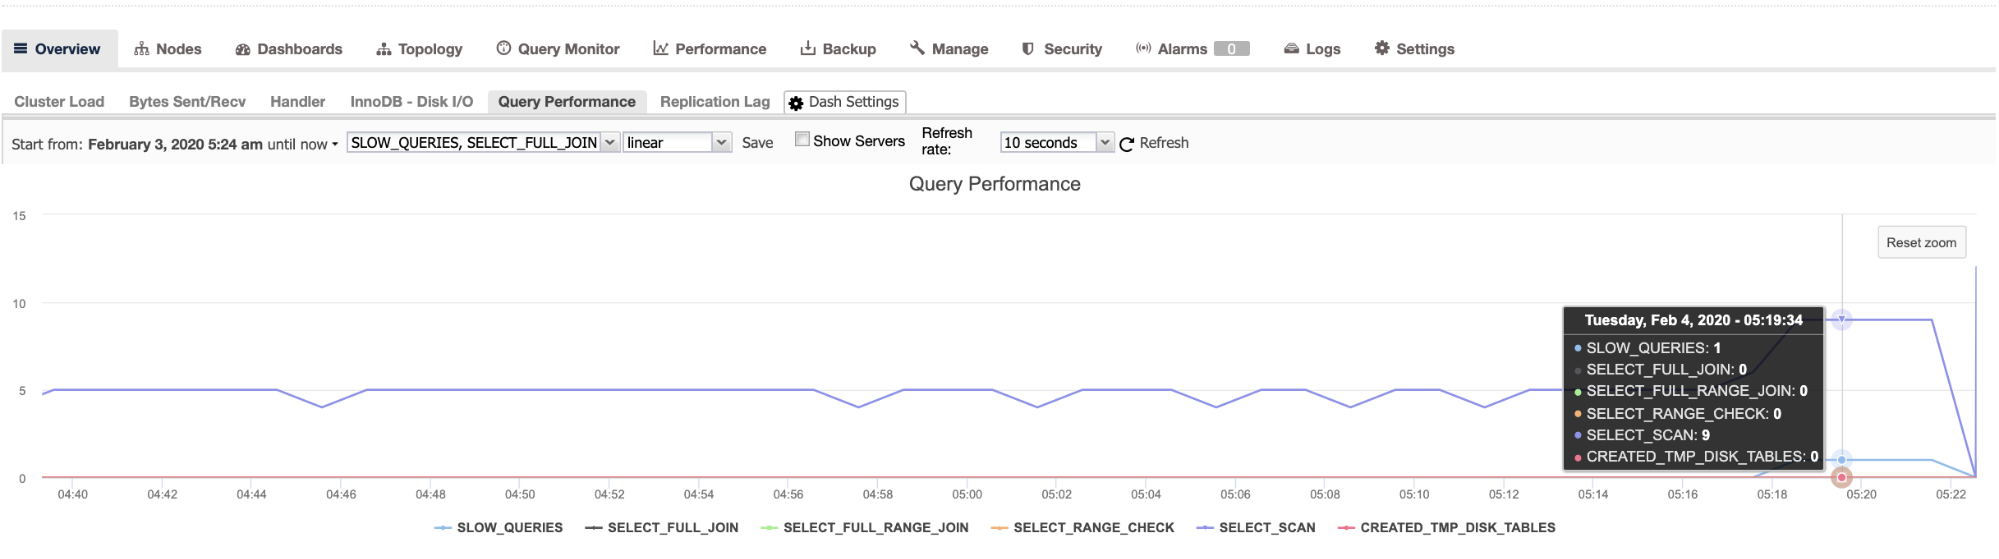
On top of that, ClusterControl also captures query performance using graphs which provides you a quick overlook of how your database system performs in relation to query performance. See below,
Wait, it’s not over yet. ClusterControl also offers a high resolution metric using Prometheus and showcases very detailed metrics and captures real-time statistics from the server. We have discussed this in our previous blogs which are divided into two part series of blog. Check out part 1 and then the part 2 blogs. It offers you on how to efficiently monitor not only the slow queries but the overall performance of your MySQL, MariaDB, or Percona database servers.
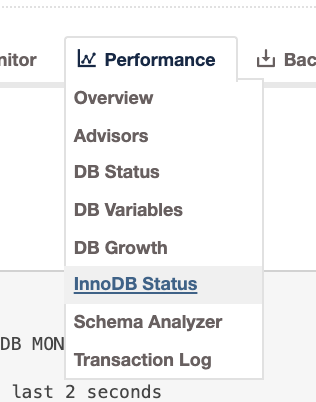
There are also other tools in ClusterControl which provide pointers and hints that can cause slow query performance even if it’s not yet occurred or captured by the slow query log. Check out the Performance Tab as seen below,
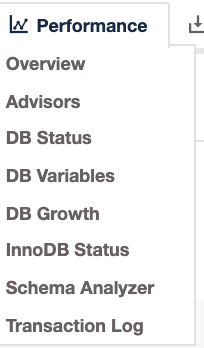
these items provides you the following:
- Overview – You can view graphs of different database counters on this page
- Advisors – Lists of scheduled advisors’ results created in ClusterControl > Manage > Developer Studio using ClusterControl DSL.
- DB Status – DB Status provides a quick overview of MySQL status across all your database nodes, similar to SHOW STATUS statement
- DB Variables – DB Variables provide a quick overview of MySQL variables that are set across all your database nodes, similar to SHOW GLOBAL VARIABLES statement
- DB Growth – Provides a summary of your database and table growth on daily basis for the last 30 days.
- InnoDB Status – Fetches the current InnoDB monitor output for selected host, similar to SHOW ENGINE INNODB STATUS command.
- Schema Analyzer – Analyzes your database schemas for missing primary keys, redundant indexes and tables using the MyISAM storage engine.
- Transaction Log – Lists out long-running transactions and deadlocks across database cluster where you can easily view what transactions are causing the deadlocks. The default query time threshold is 30 seconds.
Conclusion
Tracing your MySQL Performance issue is not really difficult with MySQL. There are various external tools that provide you the efficiency and capabilities that you are looking for. The most important thing is that, it’s easy to use and you are able to provide productivity at work. Fix the most outstanding issues or even avoid a certain disaster before it can happen.