blog
SCUMM: The Agent-Based Database Monitoring Infrastructure in ClusterControl

With the 1.7 release of our flagship product ClusterControl, we introduced our new agent-based monitoring infrastructure: SCUMM – which this blog discusses in more detail.
As a core element of our product, ClusterControl provides a complete monitoring system with real time data to know what is happening now, with high resolution metrics for better accuracy, pre-configured dashboards, and a wide range of third-party notification services for alerting.
On-premises and cloud systems can be monitored and managed from one single point.
Intelligent health-checks are implemented for distributed topologies, for instance detection of network partitioning by leveraging the load balancer’s view of the database nodes.
And … monitoring can be agentless via SSH or agent-based … which is where SCUMM comes in!
ClusterControl’s new SCUMM system is agent-based, with a server pulling metrics from agents that run on the same hosts as the monitored databases and uses Prometheus agents for greater accuracy and customization options while monitoring your database clusters.
But why SCUMM and what is it all about?
Introduction to SCUMM
SCUMM – Severalnines CMON Unified Monitoring and Management – is our new agent-based monitoring infrastructure.
This monitoring infrastructure consists of two main components:
The first component is the Prometheus server which acts as the time series database and stores the collected metrics.
The second component is the exporter. There can be one or more exporters responsible for collecting metrics from a node or a service. The Prometheus server collects these metrics (this is called scraping) from the exporters over HTTP. On top of this, we have created a set of dashboards to visualise the collected metrics.
The main benefits are:
- Collect metrics with community supported Prometheus exporters
- For example data from MySQL Performance Schema or ProxySQL
- A number of specialized dashboards showing the most important metrics and historical trending for each monitored service
- High frequency monitoring makes it possible to scrape the targets with a one second interval
- An architecture that scales with the number of database servers and clusters. A single Prometheus instance can ingest thousands of samples per second.
- No reliance on SSH connectivity for collecting host and process metrics, which means a more scalable system compared to an agentless monitoring solution
- The ability to create custom dashboards with custom rules (watch out for our upcoming releases)
The SCUMM Agents/Exporters that are installed on the monitored nodes are called Prometheus Exporters. The exporters collect metrics from the node (e.g CPU, RAM, Disk, and Network) and from services such as MySQL or PostgreSQL servers. The Prometheus server is installed on a server and scrapes (samples) the exporters with a custom interval.
Why Prometheus ?
Prometheus is a very popular time-series databases that has gained a large adoption with an active ecosystem. It offers a rich data model and a query language with a http based poll system. It is easy to install, maintain and configure in HA setup as well.
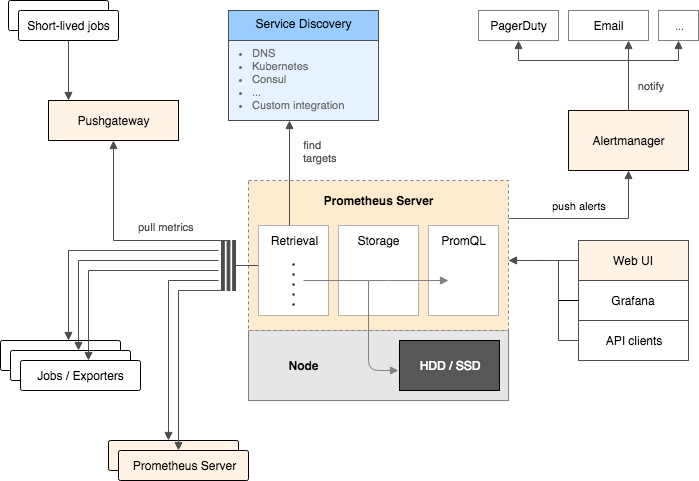
Prometheus scrapes metrics from instrumented jobs, either directly or via an intermediary push gateway for short-lived jobs. It stores all scraped samples locally and runs rules over this data to either aggregate and record new time series from existing data or generate alerts.
Prometheus works well for recording any purely numeric time series. It fits both machine-centric monitoring as well as monitoring of highly dynamic, service-oriented architectures. In a world of microservices, its support for multi-dimensional data collection and querying is a particular strength.
Prometheus is designed for reliability, to be the system you go to during an outage to allow you to quickly diagnose problems. Each Prometheus server is standalone, not depending on network storage or other remote services. You can rely on it when other parts of your infrastructure are broken, and you do not need to set up extensive infrastructure to use it. Thus for high-availability it is possible to simply install a second Prometheus server scraping the same data as the first Prometheus server.
Moreover, Prometheus is a very popular time series database and its adoption has grown very fast. It is possible for another Prometheus server that’s higher up in the organization to scrape the Prometheus servers closer to the database tier. This allows for a scalable monitoring infrastructure where on the database tier the data resolution is higher than further up in an organization.

Exporters
One or more exporters are installed on the monitored server and are responsible for collecting metrics about a specific part of the infrastructure. E.g, there may be one exporter to capture host specific information, an exporter to capture MySQL metrics, and ProxySQL metrics.
We have also created a specific process exporter that monitors the running processes of the server. This exporter is critical to the high availability features in ClusterControl, and allows ClusterControl to quickly react on process failures and process states. Using the process exporter (which is installed by default when Agent Based Monitoring is enabled) reduces the system load on the monitored servers.
Enabling Agent Based Monitoring In ClusterControl
Enabling Agent Based Monitoring is as simple as clicking on the Dashboard, and then click on “Enable Agent Based Monitoring.” Select a host where the Prometheus server will be installed. This Prometheus server can then be shared with other clusters.
With its 1.7.1 release, ClusterControl comes with the following dashboards:
- System Overview
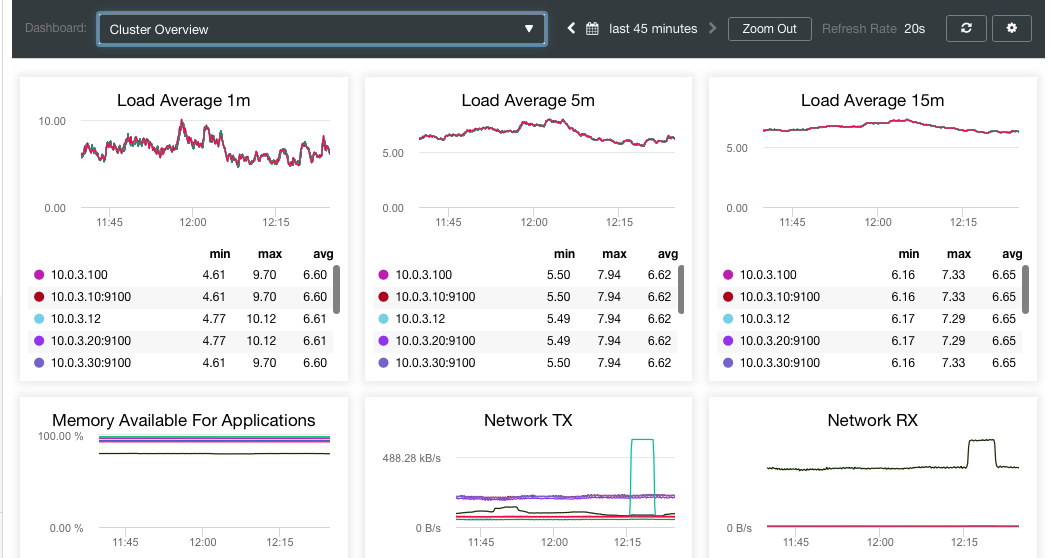
- Cluster Overview
- MySQL Server – General
- MySQL Server – Caches
- MySQL InnoDB Metrics
- Galera Cluster Overview
- Galera Server Overview
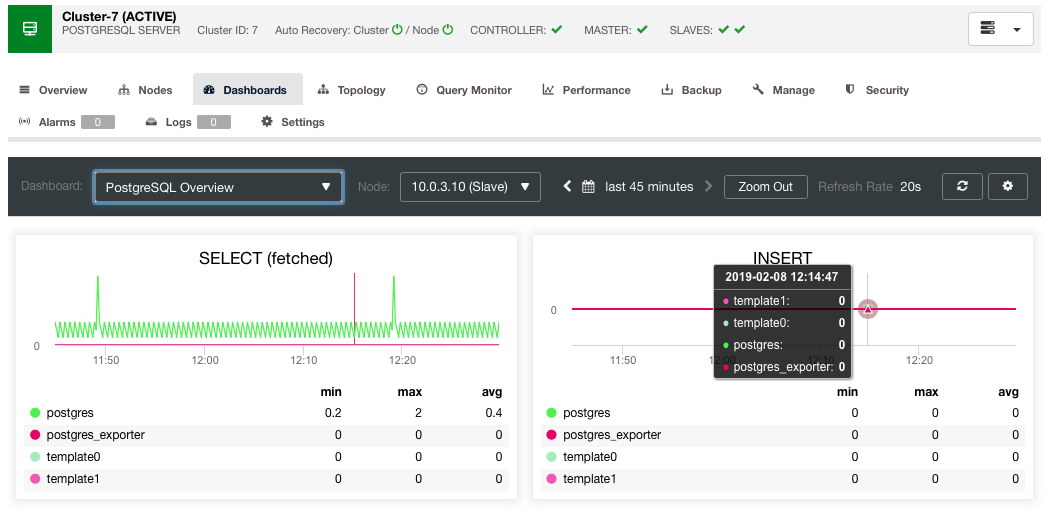
- PostgreSQL Overview
- ProxySQL Overview
- HAProxy Overview
- MongoDB Cluster Overview
- MongoDB ReplicaSet
- MongoDB Server
To Summarise …
Whether one wants to use a monitoring agent or go the agentless route is completely based on organizational policy requirements and custom needs. And although we love the simplicity of not having to install or manage agents on the monitored database hosts, an agent-based approach can provide higher resolution of monitoring data and has certain advantages in terms of security.
ClusterControl’s new SCUMM system uses Prometheus agents for greater accuracy and customization options while monitoring your database clusters.
Why not give it a try and see for yourself!
Install ClusterControl today (it’s free with our Community Edition) or download our new ClusterControl Guide if you’d like to read about our product more first.


