Whitepapers
Clustercontrol: The Guide

Clustercontrol differs from the usual approach of trying to bolt together performance monitoring, automatic failover and backup management tools by combining – in one product – everything you need to deploy and operate mission-critical databases in production. This Guide explains why Clustercontrol is the only database management system you’ll ever need to take control of your open source database infrastructure.
Introduction
Since our inception, it’s been our mission to provide easy-to-implement and use orchestration solutions to organizations so they can achieve optimal availability of their open-source database infrastructures at scale.
Today’s complex applications require polyglot, distributed data infrastructures that are extremely difficult to administer. Bringing new databases into an organization means a number of things for DevOps teams – from deployment, configuration and scaling to observability, backup and recovery, failover, security, and upgrades.
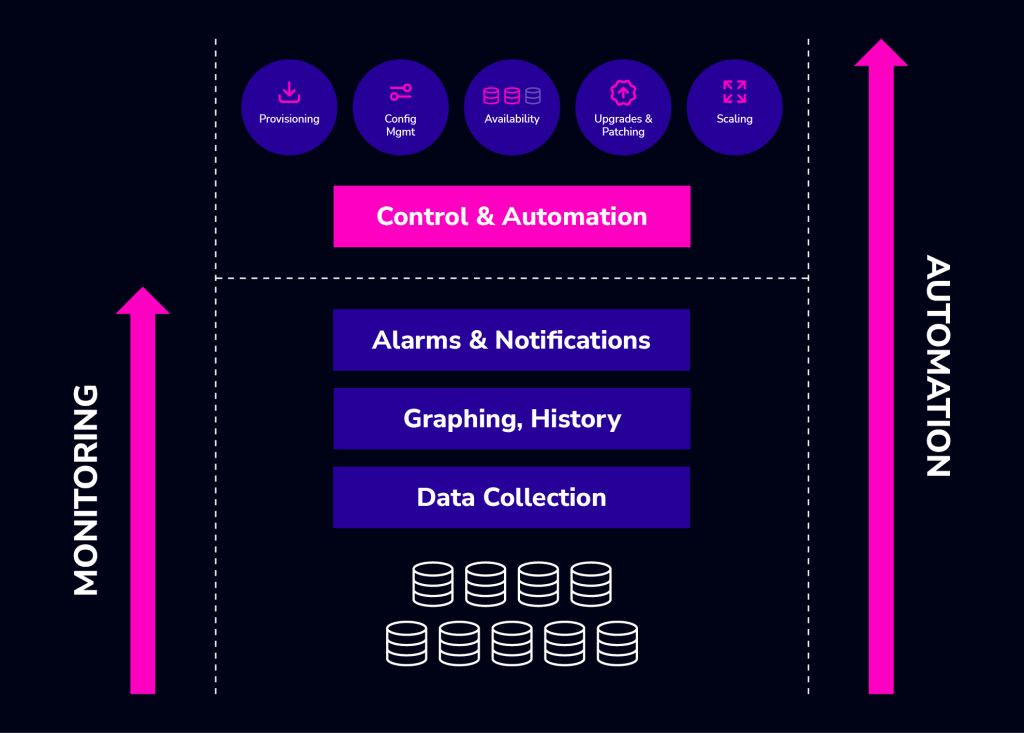
Incorporating best practices from thousands of customer deployments, Clustercontrol is an intuitive database orchestration platform providing holistic, real-time control of your open-source database operations in any environment, safely and securely.
What makes Clustercontrol different
Most organizations have two choices when it comes to orchestrating their database stacks, they can build using a mix of homegrown scripts and off-the-shelf tools or “rent” from traditional DBaaS providers.
Building gives you greater control and flexibility; you can choose best-of-breed tools and decide where and how you want to implement your stack. However, it can be quite an operational undertaking to cobble together complex ‘stacks’ of tools and utilities, expensive, and will require expertise in the databases and tools / utilities.
What about traditional DBaaS solutions? They are quick to set up, initially inexpensive, and are ideal for elastic workloads. They pose their own downsides, such as loss of control in terms of workload access and portability, cost inflation at scale, and vendor and environmental lock-in. It is also not as “set and forget” a proposition as vendors claim, sometimes requiring just as much expertise and time administering your stack through them.
Clustercontrol differs from these approaches by unifying operations under one platform: it combines the benefits of both while mitigating their costs — you won’t have to cobble together a patchwork of disparate tools to create your own DIY platform nor will you be confined to specific operating environments, subject to obnoxious license changes or surprise price jumps as you scale, nor will you be operationally dependent.
Clustercontrol provides operational orchestration for the following database technologies and flavors:

Clustercontrol is built around core Day 2 tasks (continue to read to learn about its full feature set):
- PostgreSQL (standalone, Streaming Replication)
pgaudit extension and pgvector extension
- PostgreSQL EnterpriseDB
- MongoDB Inc. (standalone, ReplicaSet, Sharded Cluster)
- Percona Server for MongoDB (standalone, ReplicaSet, Sharded Cluster)
- MongoDB Enterprise
- MySQL (standalone, MySQL Replication)
- Percona Server for MySQL (standalone, Percona XtraDB Cluster)
- MariaDB (standalone, Replication, Galera Cluster)
- TimescaleDB
- Elasticsearch
- Redis (Sentinel, Cluster)
- Microsoft SQL Server (Availability-groups)
Clustercontrol has the ability to tag clusters to quickly identify one or more clusters that are used for specific reasons: tags can be added when clusters are imported or deployed, you can also search for clusters that have specific tags.
Clustercontrol is built around core Day 2 tasks (continue to read to learn about its full feature set:
| Backup/Restore Management | Everything from scheduling backups, restoring data, managing retention policies, encryption/compression, restore verification and data archiving to the cloud. |
| Failover/Recovery and Switchover Management | Detecting server or data center failures and switching over to available healthy nodes – e.g. by promoting a new master and reslaving the other servers in the setup. Recovering failed nodes, e.g. rebuilding a corrupted slave from scratch or re-bootstrapping an entire cluster that crashed beyond repair. Ensuring load balancers are pointing to the right database instances, especially after topology changes, so applications can still access data. Shifting traffic to healthy instances while doing infrastructure maintenance, for instance when applying OS patches. |
| Security Management | Get an overview of which users are defined in the databases, what grants they have, when they last logged in. Identify inactive users, or users with too liberal permissions. Configure for security. Audit database access. LDAP and Role-Based Access Control for management staff.Compliance reporting and analytics. Create and manage SSL keys for encryption. |
| Configuration Changes | Perform changes of variables in a safe way from a single place. Config changes can be set on single or multiple servers at once, with the changes persisted to the configuration files on disk. User is informed if a restart of the node is needed, so the user can trigger a rolling restart. Be able to audit configuration changes to understand who did what. |
| Upgrades | Upgrades can be time consuming, and they usually require several steps – disabling monitoring on the node being upgraded, running the upgrade commands, rolling restart with switchover at the load balancer level. Track upgrade times so as to know how long each step takes to complete. |
| Management of jobs and external scripts | Managing a database usually means a number of small maintenance tasks that are executed regularly. A job scheduler can be used to keep track of these, and alert in case of issues. |
Let’s look at CC’s architecture now that you have an idea of Clustercontrol’s core themes.
Clustercontrol architecture
Clustercontrol is a standalone software product that can be installed on-prem, behind a firewall and even completely without internet access, or in the cloud. It is a small and lightweight stack which consists of an end-user web-based portal, a few backend services which provides the core functionality of the platform.
Clustercontrol uses agentless monitoring by default which requires no additional software to be installed on the nodes besides providing SSH connectivity.
In addition, the Command-Line and RPC – Remote Procedure Call API provides powerful and complete integration endpoints with configuration management software such as Ansible or Terraform.
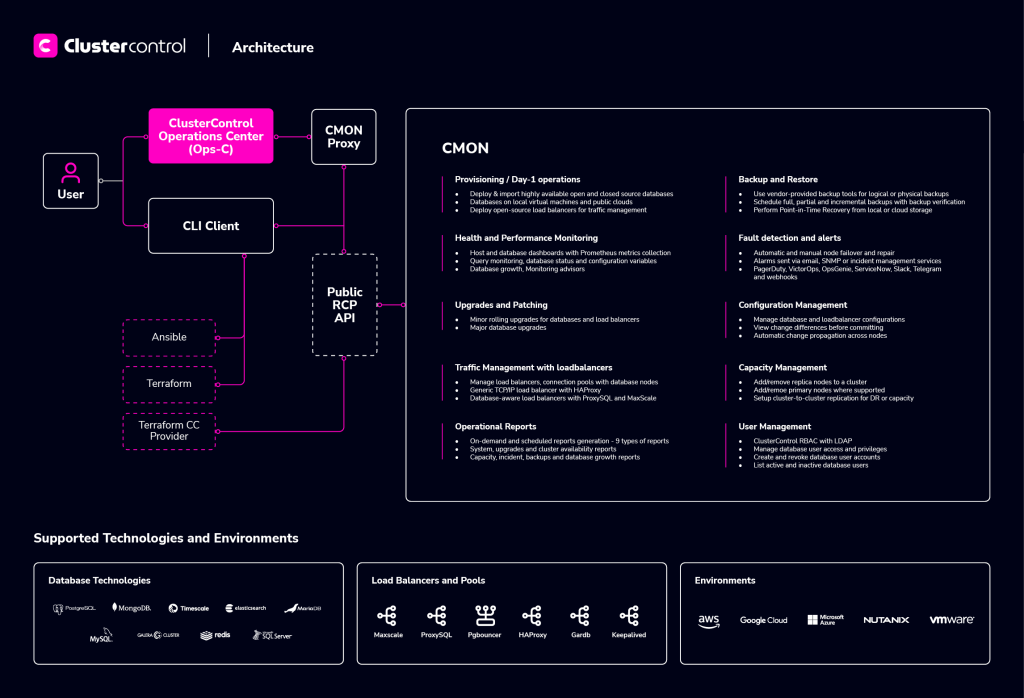
Clustercontrol consists of a number of components:
Component | Package naming | Role |
| Clustercontrol Controller (cmon) | clustercontrol-controller | The brain of Clustercontrol. A backend service performing automation, management, monitoring and scheduling tasks. All the collected data will be stored directly inside CMON database. |
| ClusterControl REST API | clustercontrol-cmonapi | Interprets request and response data between Clustercontrol UI and CMON database. |
| Clustercontrol UI v2 | Clustercontrol 2 | A modern web user interface to visualize and manage the cluster. It interacts with the CMON controller via remote procedure call (RPC) or REST API interface. |
| Clustercontrol SSH | clustercontrol-ssh | Optional package introduced in Clustercontrol 1.4.2 for Clustercontrol’s web SSH console. Only works with Apache 2.4+. |
| Clustercontrol Notifications | clustercontrol-notifications | Optional package introduced in Clustercontrol 1.4.2 providing a service and user interface for notification services and integration with third party tools. |
| Clustercontrol Cloud | clustercontrol-cloud | Optional package introduced in Clustercontrol 1.5 providing a service and user interface for integration with cloud providers. |
| Clustercontrol Cloud File Manager | clustercontrol-clud | Optional package introduced in Clustercontrol 1.5 providing a command-line interface to interact with storage objects on cloud. |
| Clustercontrol CLI | s9s-tools | Open-source command line tool to manage and monitor clusters provisioned by Clustercontrol. |
Clustercontrol performs its monitoring, alerting and trending duties by using the following methods:
- SSH – Host metrics collection (process, load balancers stats, resource usage and consumption, etc.) using SSH library.
- Database client – Database metrics collection (status, queries, variables, usage etc) using the respective database client library.
- Advisor – Mini programs written using Clustercontrol Domain Specific Language (DSL) and running within Clustercontrol itself, for monitoring, tuning and alerting purposes. The DSL syntax is based on JavaScript, with extensions to provide access to Clustercontrol internal data structures and functions. The DSL allows you to execute SQL statements, run shell commands/programs across all your cluster hosts, and retrieve results to be processed for advisors/alerts or any other actions.
- Agent based – Uses Prometheus exporters to capture metrics data from the system it monitors. Statistics are then stored in the time series DB.
The controller connects to the managed database nodes via SSH in order to perform management procedures, e.g. recovering a broken database node or performing a rolling upgrade.
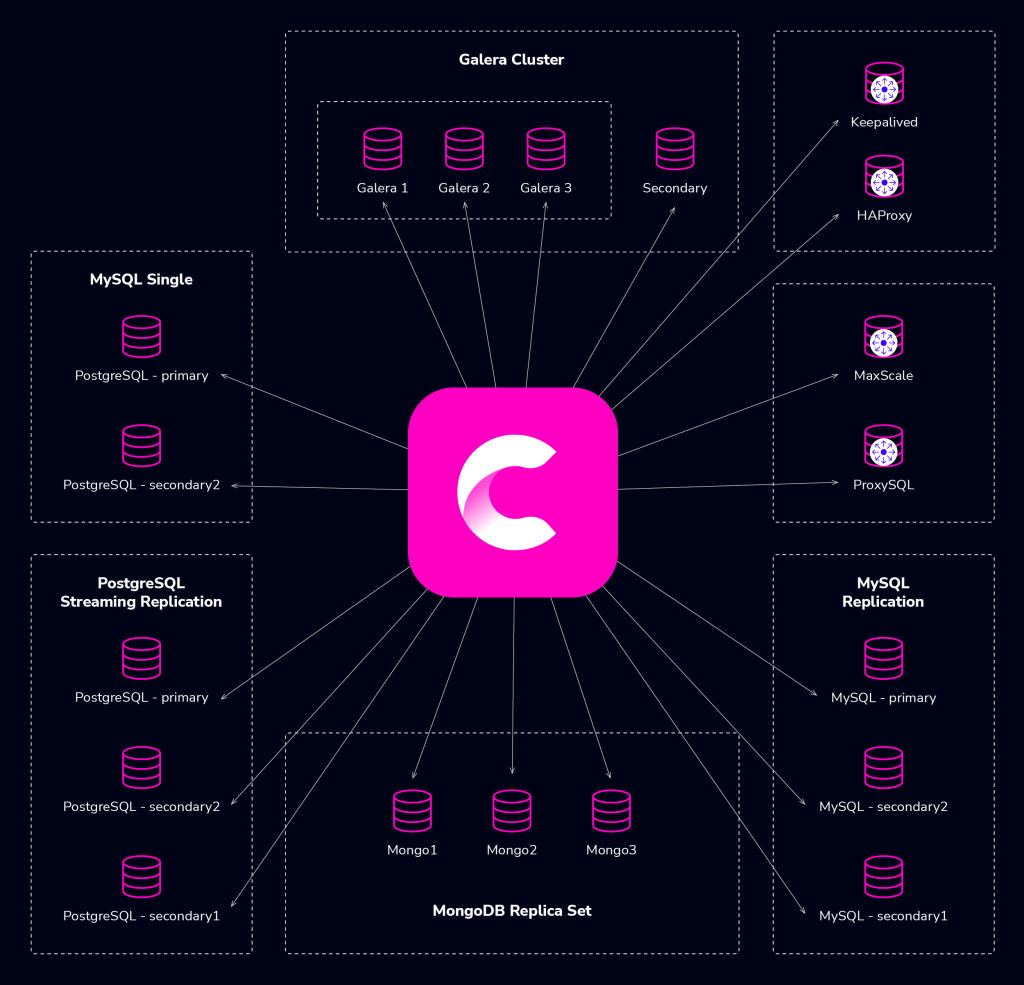
The Clustercontrol installation process is pretty straightforward, consisting of Clustercontrol binaries installation and key copy. There is no need to install additional agents software.
The supported platforms are:
- RedHat/CentOS 7.x/8.x/9.x.
- Ubuntu 18.04/20.04/22.04 LTS,
- Debian 10.x/11.x/12x.
- Rocky Linux 8.x/9.x
- AlmaLinux 8.x/9.x
- OpenSUSE Leap 15.3/15.4
- SUSE Linux Enterprise Server 15 SP3/15 SP4
The minimal OS resource requirements are 2GB of RAM, 2CPU and 40GB disk space running on x86 architecture. Clustercontrol itself can run on regular VMs or barebone hosts running on-prem, behind a firewall, or on Cloud VMs.
Additionally, Clustercontrol requires ports used by the following services to be opened/enabled:
ICMP (echo reply/request)
SSH (default is 22)
HTTP (default is 80)
HTTPS (default is 443)
MySQL (default is 3306) (internal database)
CMON RPC (default is 9500)
CMON RPC TLS (default is 9501)
CMON Events (default is 9510)
CMON SSH (default is 9511)
CMON Cloud (default is 9518)
Streaming port for backups through netcat (default is 9999)
The easiest and most convenient way to install ClusterControl is to use the installation script provided by Severalnines. Simply download the script and execute as the root user or user with sudo root permission.
$ wget http://www.severalnines.com/downloads/cmon/install-cc
$ chmod +x install-cc
$ ./install-cc   # as root or sudo user
The next step is to generate an SSH key which we will use to set up the passwordless SSH later on. If you have a key pair which you would like to use, you can skip creation of a new one.
$ whoami
root
$ ssh-keygen -t rsa #generates ssh key
Set up passwordless SSH to all nodes that you would like to monitor/manage via ClusterControl. In this case, we will set this up on all nodes in the stack (including ClusterControl node itself). On ClusterControl node, run the following commands to copy ssh keys and specify the root password when prompted:
ssh-copy-id root@clustercontrolhost # clustercontrol
ssh-copy-id root@dbhost1 #your database host
...
When the installation is completed you should be able to login to the ClusterControl web interface via:
https://<your_vm_name>
Apart from the installation script we have a bunch of other scripts and tool to automate and simplify the installation process of Clustercontrol in various environments:
- Puppet module – If you are automating your infrastructure using Puppet, we have created a module for this purpose and it is available at Puppet Forge. Installing the module is as easy as:
$ puppet module install severalnines-clustercontrol
- Chef cookbooks – If you are automating your infrastructure using Chef, we have created a cookbook for this purpose and it is available at Chef Supermarket. Installing the module is as easy as:
$ knife cookbook site download clustercontrol
- Ansible role – If you are automating your infrastructure using Ansible, we have created a role for this purpose and it is available at Ansible Galaxy. This role also supports deploy a new cluster and import an existing cluster into ClusterControl automatically. Getting the role is as easy as:
$ ansible-galaxy install severalnines.clustercontrol
- Docker Image – The Docker image comes with ClusterControl installed and configured with all of its components, so you can immediately use it to manage and monitor your existing databases.The Dockerfile is available from our Github repository. You can build it manually by cloning the repository:
$ git clone https://github.com/severalnines/docker
$ cd docker/
$ docker build -t severalnines/clustercontrol
- Clustercontrol-helm-chart – This helm chart is designed to provide everything you need to get ClusterControl running in a vanilla Kubernetes cluster. This includes dependencies like:
- Ingress-Nginx Controller
- MySQL Operator
- VictoriaMetrics Operator.
Clustercontro functionality
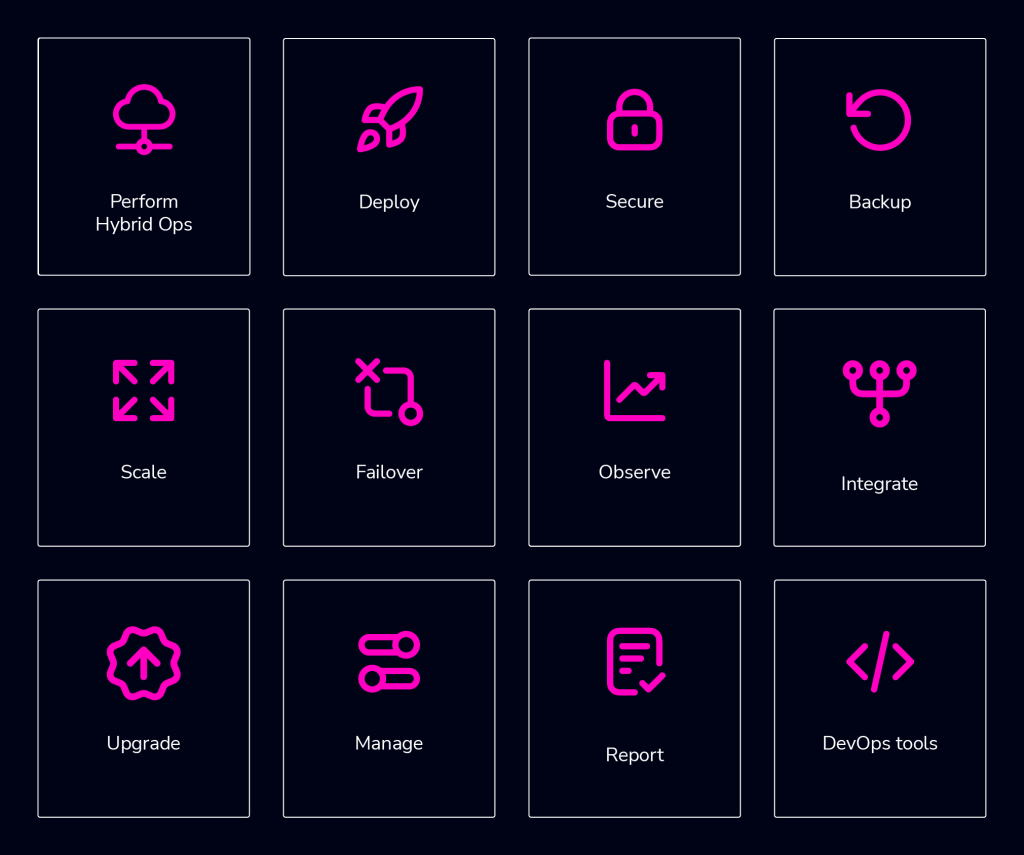
Deploy and Scale
Deploying a high availability database cluster manually is not rocket science – there are many how-tos on how to do that. The challenge though is to determine whether what we just deployed is production-ready.
Manual deployments are common, but they can be tedious and repetitive. Depending on the number of nodes in the setup, the deployment steps may be time-consuming and error-prone. Therefore, deployments are increasingly being automated via configuration management tools.
Configuration management tools like Puppet, Chef and Ansible are popular in deploying infrastructure. They help eliminate manual work, minimize the risk of human error, and make it possible to deploy rapidly without giving up reliability. However, deploying a distributed database setup that shares common state undoubtedly leads to complex code.
Many of the details that go into deploying, configuring and coordinating between the different nodes increase the complexity exponentially. And the reality is that much more code is written in order to take small edge cases into account, which make the template/module/cookbook/role unmaintainable and hard to extend. And the end result has to be meticulously tested before you can trust it as part of your infrastructure automation. Version changes require the scripts to be updated and tested again.
One of the key features of Clustercontrol is to automate the deployment of the entire stack. It builds upon the experience of having deployed thousands of production clusters, from master-slave replication setups to multi-master clusters like Galera, NDB Cluster and MongoDB Sharded Clusters, with different database proxies on top.
A high availability stack, deployed through Clustercontrol, usually consists of three layers:
- Database layer (e.g., Galera Cluster)
- Reverse proxy layer (e.g., HAProxy or ProxySQL)
- Keepalived layer, which, with use of Virtual IP, ensures high availability of the proxy layer
To perform a deployment in Clustercontrol, one can simply select the option “Deploy Database Cluster” and follow the wizard.
- Single process to deploy and manage on-premises and cloud environments.
We’re pleased to announce that Clustercontrol now integrates with Kubernetes environments via our newly introduced Helm Chart. Packaging Clustercontrol into a singular Helm Chart simplifies deployment with just a few commands. For DevOps teams utilizing Kubernetes infrastructure, Clustercontrol offers a complementary orchestration platform to deploy, manage, and automate database ops through a single pane of glass. Check out this link for more details.
Load balancers
Clustercontrol has support for different load balancers, or proxies. HAProxy is a TCP/IP load balancer that can be deployed on top of MySQL, MariaDB and PostgreSQL systems. ProxySQL and MaxScale are specialized load balancers that can provide advanced functionality based on their understanding of the MySQL wire protocol. The database nodes are regularly polled for aliveness via custom health-checks that are also deployed by Clustercontrol. If a destination stops responding, it is marked as offline, and the traffic is sent to the rest of the available destinations. This prevents traffic from being sent to an inaccessible destination, in which case data may be lost.
With ProxySQL for example, it is possible to see all the queries that pass through the proxy and create rules – e.g., cache a query in the proxy for lower response time, or re-route a query to a particular node. Operations staff can even re-write a badly written query on the fly, while waiting for an application team to fix the query and redeploy the application.

For high availability of the proxy layer, it is possible to deploy Keepalived and configure a virtual IP within an active/passive group of servers. This virtual IP is assigned to an active “main” server. If this server fails, the IP is automatically migrated to the “secondary” passive server, so applications can continue to work with the same IP in order to access the database.
All these elements are essential to configure a high availability database environment.
Clustercontrol also supports PgBouncer (PostgreSQL’s connection pooler) for more efficient use of server resources – with support for PgBouncer, Clustercontrol users can pool and optimize connections to one or more PostgreSQL databases:
- PgBouncer can be deployed to one or more nodes to manage multiple pools per node.
- Pool modes can be based on Session, Transaction or Statement.
- There is also a Prometheus exporter which provides metrics for a new PgBouncer dashboard.
Integration with Configuration Management Systems via the CLI
Clustercontrol includes a tool called s9s, which allows us to perform administration tasks, monitoring, implementation, and several tasks that we have already seen, from the command line. In this way, we can easily integrate Clustercontrol with the automation tools that we currently have, such as Puppet or Chef. One common pattern is to have e.g., Puppet prepare the host/OS, and let Clustercontrol deploy the database software.
Let’s see an example of how you can use one command to deploy a 3-node Galera Cluster:
$ s9s cluster --create --cluster-type=galera --nodes="192.168.100.130;192.168.100.131;192.168.100.132" --vendor="percona" --provider-version="8.0" --template="my.cnf.repl57" --db-admin="root" --db-admin-passwd="*********" --os-user="root" --cluster-name="GaleraCluster" --waitCreate Galera Cluster
| Job 589 FINISHED [██████████] 100% Job finished.Now we have the new cluster created:
$ s9s cluster --cluster-id=7 --list -l
ID STATE   TYPE   OWNER  GROUP  NAME          COMMENT
 7 STARTED galera system admins GaleraCluster All nodes are operational.
Total: 1
Secure
Database security requires careful planning, but it is important to remember that security is not a state, it is a process. Once the database is in place, monitoring, alerting and reporting on changes are an integral part of the ongoing management. Also, security efforts need to be aligned with business needs.
Some best practices include:
- Control access to the database using the principle of least privilege.
- Regularly patch the database.
- Monitor database activity.
- Ensure you have complete visibility into what is happening across your databases, and reduce the risk of missing suspicious activities.
Securing Clustercontrol traffic
To avoid unauthorized access to the management of the database, encrypt all communication to the Clustercontrol Web Interface. As a platform that manages all of your databases, Clustercontrol maintains the communication with the database servers, transmits commands and collects metrics in an encrypted way. By default, Clustercontrol is set up with HTTPS. All you need to do is to point your browser to https://<ip of Clustercontrol host>l.
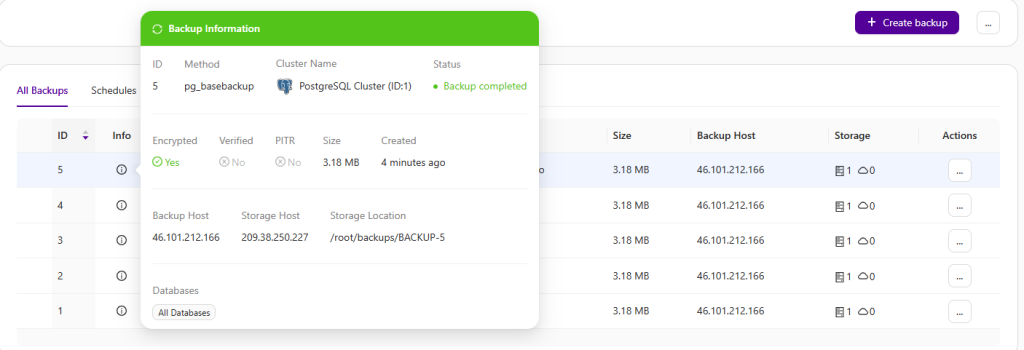
ClusterControl secure backups
You can use this feature on all backup methods (mysqldump, xtrabackup, mongodump, pg_dump) supported by ClusterControl. To enable encryption, toggle the “Enable Encryption” switch when scheduling or creating the backup. ClusterControl automatically generates a key to encrypt the backup. It uses AES-256 (CBC) encryption algorithm and performs the encryption on-the-fly on the target server. The following command shows an example of how ClusterControl performs a mysqldump backup:
$ mysqldump --defaults-file=/etc/my.cnf --flush-privileges --hex-blob --opt --no-create-info --no-data --triggers --routines --events --single-transaction --skip-comments --skip-lock-tables --skip-add-locks --databases db1 | gzip -6 -c | openssl enc -aes-256-cbc -pass file:/var/tmp/cmon-094508-e0bc6ad658e88d93.tmp | socat - TCP4:192.168.55.170:9999'You would see the following error if you tried to decompress an encrypted backup without decrypting it first with the proper key:
$ gunzip mysqldump_2018-01-03_175727_data.sql.gz
gzip: mysqldump_2018-01-03_175727_data.sql.gz: not in gzip format
The key is stored inside the ClusterControl database, and can be retrieved from the cmon_backup.metadata file for a particular backup set. It will be used by ClusterControl when performing restoration. Encrypting backups are highly recommended, especially when you want to secure your backups offsite like archiving them in the cloud. The supported cloud storage services include Amazon S3, Google Cloud Storage, Azure Cloud Storage and S3-compatible storage providers.
Encryption of data in Ttransit (SSL)
You can increase the reliability of your database service by using client-server SSL encryption. Using Clustercontrol, you can perform this operation with simple point and click:
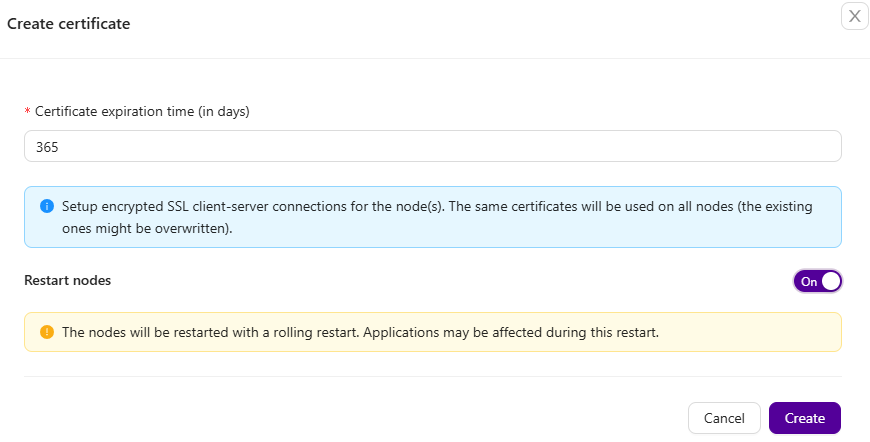
You can then retrieve the generated keys and certificates directly from the ClusterControl host under /var/lib/cmon/ca path to establish secure connections with the database clients. All the keys and certificates can be managed directly under settings -> Certificate Management, as described further down.
Replication traffic within a Galera Cluster can also be enabled with just one click. ClusterControl uses a 2048-bit default key and certificate generated on the ClusterControl node, which is transferred to all the Galera nodes. A cluster restart is necessary to enable this. ClusterControl will perform a rolling restart operation, taking one node at a time. You will see a green lock icon next to the database server (Galera indicates Galera Replication encryption, while SSL indicates client-server encryption) in the Hosts grid of the Overview page once encryption is enabled.
All the keys and certificates can be managed directly under Key Management.
Certificate management
All the generated keys and certificates can be managed directly from the Clustercontrol UI. Key Management allows you to manage SSL certificates and keys that can be provisioned on your clusters.
If the certificate has expired, you can simply use the UI to generate a new certificate with the proper key and Certificate Authority (CA), or import an existing key and certificate into the Clustercontrol host.
Security advisors
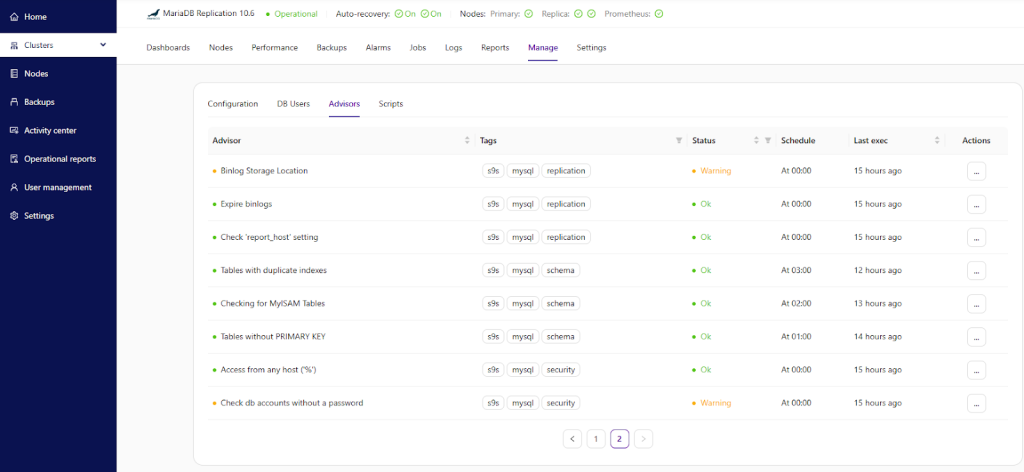
Advisors are mini-programs that run in Clustercontrol. They perform specific tasks and provide advice on how to address issues in areas such as performance, security, log management, configuration, storage space and others. Each advisor can be scheduled like a cron job, and run as a standalone executable within the Clustercontrol UI. It can also be run via the Clustercontrol ‘s9s’ command line client.
Clustercontrol enables some security advisors for MySQL-based systems, including:
- Access from any host (‘%’) – Identifies all users that use a wildcard host from the mysql system table, and lets you have more control over which hosts are able to connect to the servers.
- Check number of accounts without a password – Identifies all users who do not have a password in the mysql system table.
For MongoDB, we have the following advisors:
- MongoDB authentication enabled – Check whether the MongoDB instance is running with authentication mode enabled.
- Authorization check – Check whether MongoDB users are authorized with too permissive role for access control.
For more details on how Clustercontrol performs the security checks, you can look at the advisor JavaScript-like source code under Manage -> Advisors. You can see the execution results from the Advisors page:
Audit log for MySQL
Continuous auditing is an imperative task for monitoring your database environment. By auditing your database, you can achieve accountability for actions taken or content accessed. Moreover, the audit may include some critical system components, such as the ones associated with financial data to support a precise set of regulations like SOX, or the EU GDPR regulation. Usually, it is achieved by logging information about DB operations on the database to an external log file.
By default, auditing in MySQL or MariaDB is disabled. You can achieve it by installing additional plugins or by capturing all queries with the query_log parameter. The general query log file is a general record of what MySQL is performing. The server records some information to this log when clients connect or disconnect, and it logs each SQL statement received from clients. Due to performance issues and lack of configuration options, the general_log is not a good solution for security audit purposes.
If you use MySQL Enterprise, you can use the MySQL Enterprise Audit plugin which is an extension to the proprietary MySQL version. MySQL Enterprise Audit Plugin plugin is only available with MySQL Enterprise, which is a commercial offering from Oracle. Percona and MariaDB have created their own open source versions of the audit plugin.
Clustercontrol can be used to enable Audit Logging for MySQL or MariaDB based systems. It will ensure the logging of connection and query activity to a separate file.
Audit log for PostgreSQL
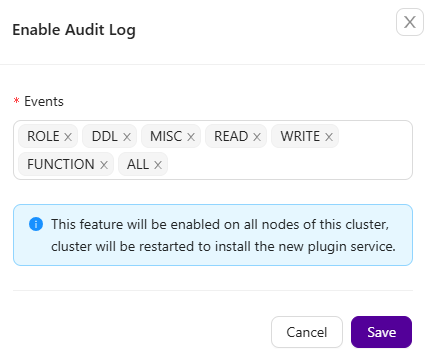
Clustercontrol also has audit logging for PostgreSQL which provides detailed session and object audit logging via the standard PostgreSQL logging facility. The pgAudit plugin can be enabled from the Clustercontrol UI: go to Clustercontrol -> Select your PostgreSQL Cluster -> go to cluster actions -> toggle the Audit Log on:
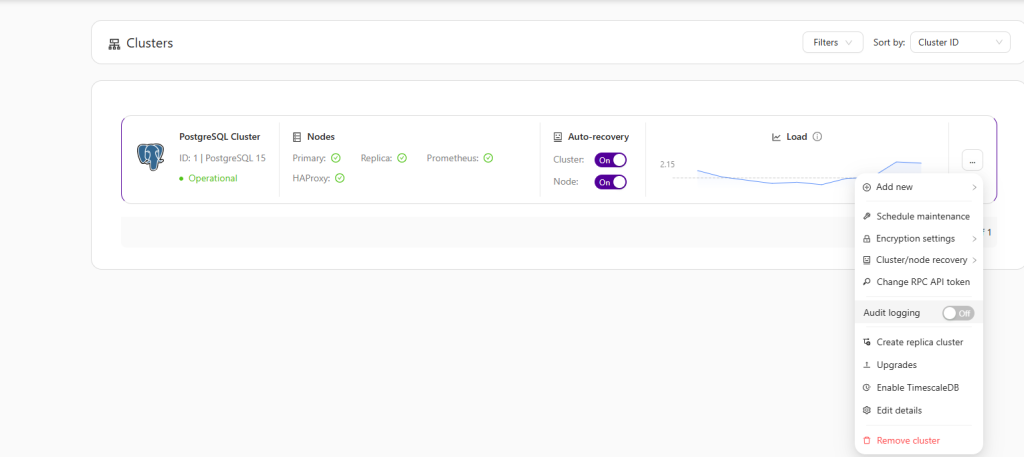
Afterwards, you would need to specify events you want to audit in your PostgreSQL cluster. After that’s done, pgAudit will be enabled on all of the nodes – it will require a database service restart to be successfully installed.
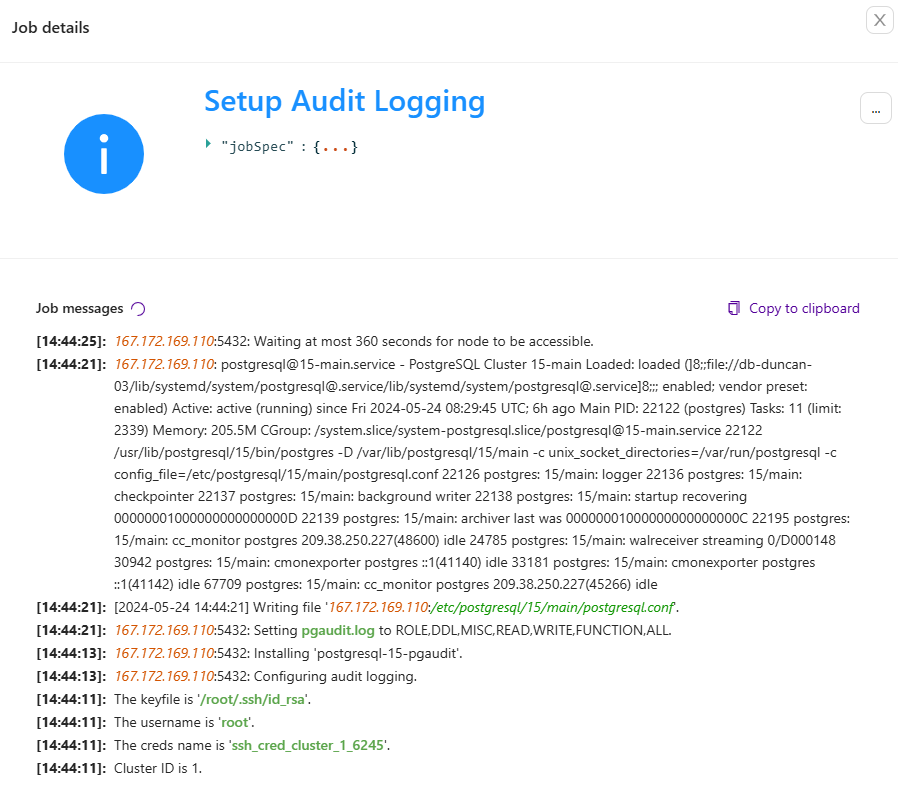
You can monitor your pgAudit installation in the Clustercontrol activity section.
After it’s finished you can check your pgAudit log in the Clustercontrol UI too. For this, go to Clustercontrol -> Select your PostgreSQL Cluster -> click on the Logs tab -> click on System Logs: you will find all of the necessary information to audit your PostgreSQL database instances.
Database infrastructure audit
There are a few Ops Reports that show what clusters are running, the nodes that belong to each cluster, uptime statistics, whether they have backups or not, as well as trends in utilization/capacity usage. The upgrade report may be of particular interest, as it gives a comprehensive list of all hosts, all services running on them, versions that are installed, whether the installed packages are up-to-date and secure. The Upgrade Report gathers information from the operating system and compares them to packages available in the repository.
The report is divided into four sections; upgrade summary, database packages, security packages, and other packages. You can quickly compare what you have installed on your system and find a recommended upgrade or patch.
Backup
When it comes to backups and data archiving, IT departments are under pressure to meet stricter service level agreements, deliver more custom reports, and adhere to expanding compliance requirements while continuing to manage daily archive and backup tasks.
Clustercontrol can help operations teams automate regular backup management tasks, such as creating the backup, maintaining backup retention, migrating backups, retaining backups in the cloud, restore, or deletion—all based on data retention policies. Real-time alerts are issued whenever there’s a discrepancy. Reports can be configured to run at specific times, and delivered to the teams and individuals who need them.
Clustercontrol provides centralized backup management for MySQL, MariaDB, PostgreSQL, MongoDB, Microsoft SQL, Redis and Elasticsearch databases, whether they are running on-premise or in the cloud. Every backup is assigned with a backup ID, and Clustercontrol creates a directory under storage directory according to the chosen name pattern.
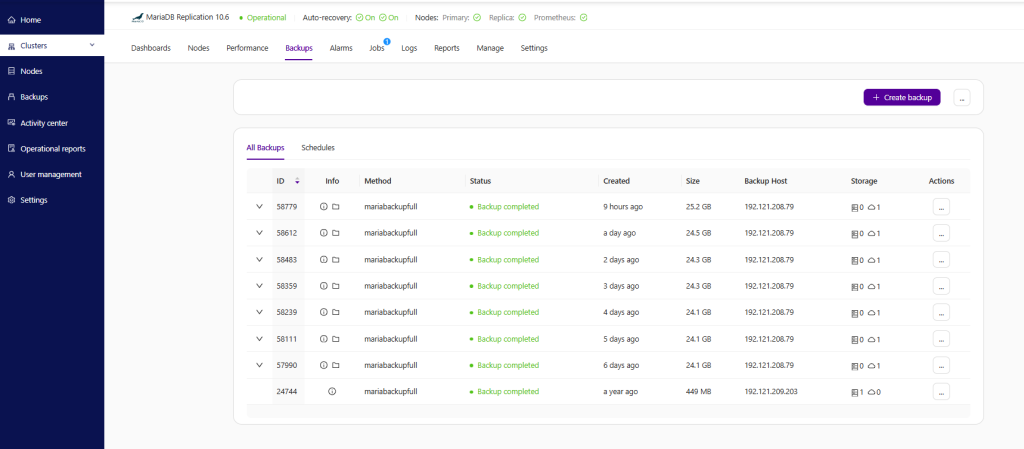
Schedule, manage and operate backups
Keeping track of the backup schedules is crucial. Backing up data isn’t exciting, but is absolutely necessary. Unfortunately, many of us only realize how crucial it is when something goes catastrophically wrong. There’s nothing quite like a failed hard drive or ransomware infection to sharpen the mind and lead to a resolution to do things differently in the future.
A regular backup plan is especially important when handling sensitive data, for instance, other people’s personal information. Following the implementation of the EU’s new General Data Protection Regulation (GDPR), anyone who does business in the EU (even if they aren’t based in the EU themselves) has an obligation to protect any data that could be used to identify someone – whether its their name, email address, physical address, or even their IP address.

Define backup policies, retention, history
An optimized backup environment delivers services that are aligned with the business requirements of the organization. It requires having both the capabilities and resources available to meet these service demands, as well as the policies and processes in place to apply these resources where appropriate. Automated backup retention can keep the required backups and make sure you don’t overutilize resources.
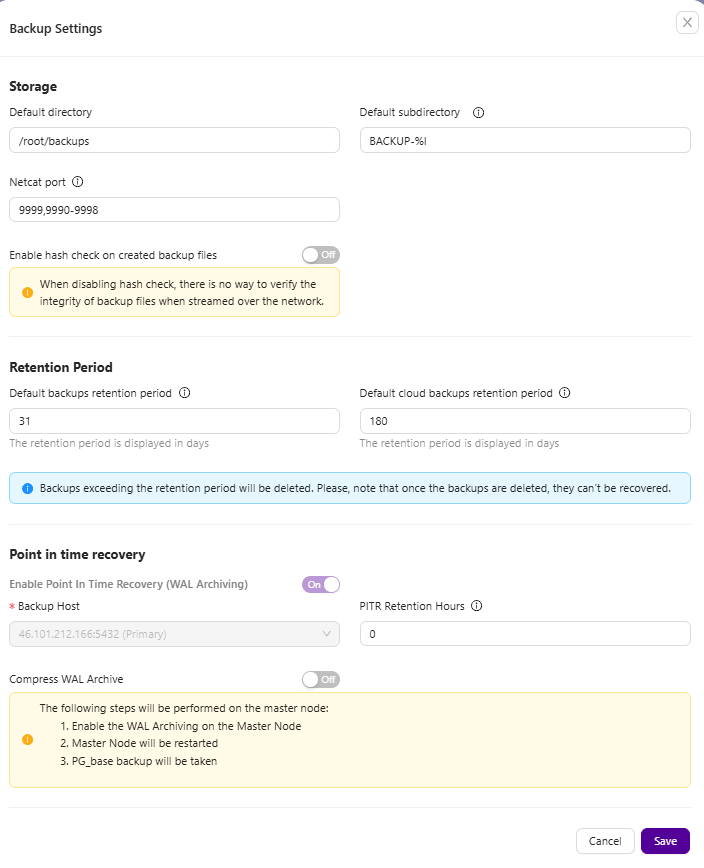
A good backup program will let you choose which data should be stored, how often, where, and whether it should be encrypted for extra security. You should also look out for a backup tool that makes recovering your data easy after a disaster.
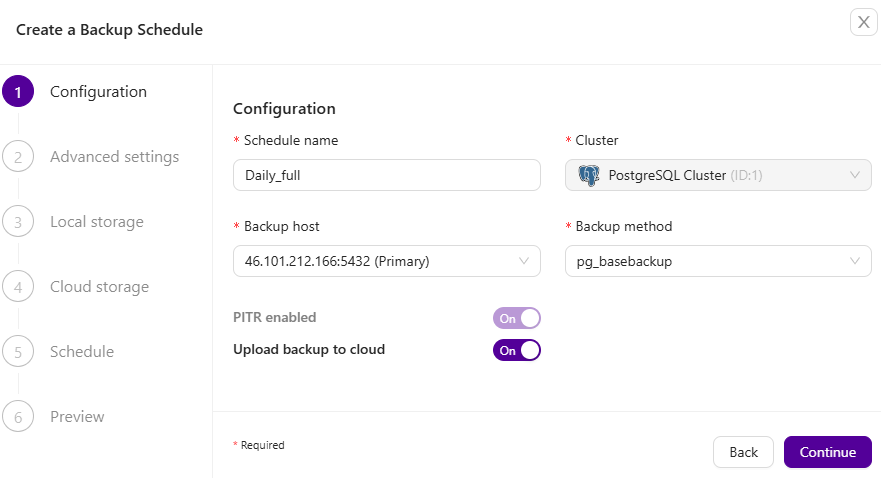
Clustercontrol supports a number of backup methods depending on the cluster type, as summarized in the following table:
| Cluster Type | Supported Backup Method |
| MySQL (Replication, Galera, MariaDB) |
|
| MongoDB (Replica Set, Sharded Cluster) |
|
| PostgreSQL (Streaming Replication) |
|
| Microsoft SQL (Availability groups) |
|
| Elasticsearch | Elasticsearch_snapshot |
| Redis (Sentinel, Cluster) | Rdb, append only file (aof) |
When scheduling backups with Clustercontrol, each of the backup methods are configurable with a set of options on how the backup is to be executed. Different database workloads and backup strategies would require support for different features, for example:
- Disk IOPS throttling
- Network throttling
- Backup Locks
- Encryption
- Compression
- Retention period
- Restore verification
Clustercontrol will automatically set a number of backup options, following the best practice from the particular database vendor. For example, if the target database node has binary log enabled, it will append an additional flag, –master-data to include the binary log coordinates (file name and position) of the dumped server. If it’s a Galera node and the backup method is xtrabackup, Clustercontrol will append an additional flag, –galera-info which contains the local node state at the time of the backup.
What about cloud backups?
Clustercontrol lets you compress and encrypt your backups, and also upload them to cloud storage (AWS, Microsoft Azure, Google Cloud or S3-compatible providers )as part of your disaster recovery plan – all from a single management interface.
Point-in-Time backups and disaster recovery
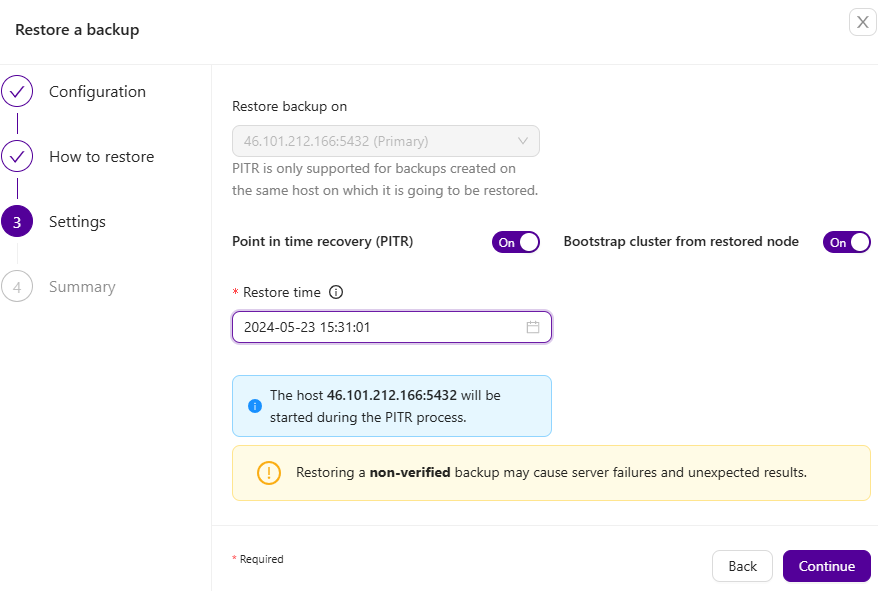
Clustercontrol allows you to recover your databases at a specific point in time, thus minimizing Recovery Point Objective (RPO). Point-in-time recovery in Clustercontrol currently supports time-based recovery. With time-based PITR, your data is recovered only up until the date and time that is provided by the Restore Time. Time must be specified in Clustercontrol’s server timezone. The restoration time must be in a YYYY-MM-DD HH:MM:SS format:
PITR backups can also be recovered either on the node or restored and verified on a standalone host:
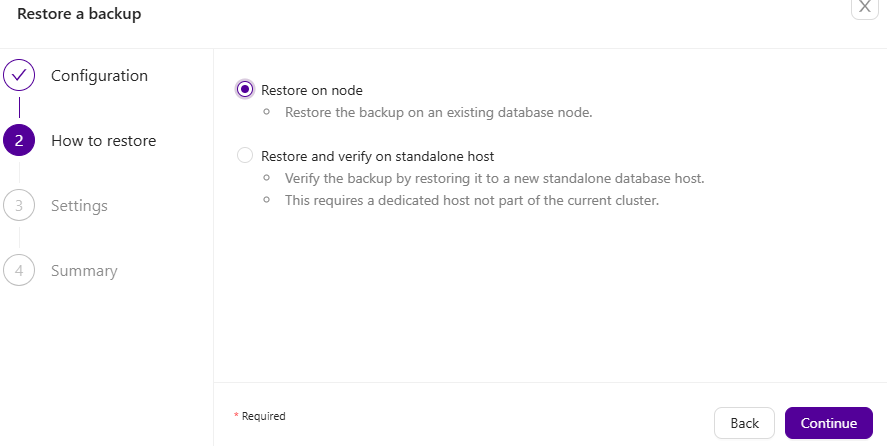
Finally, fill in where you want to restore your backup and click Finish – your backup should be restored. Keep in mind that, as it’s already noted, restoring a backup which is not verified may cause server failures and unexpected results:
Automatic backup verification
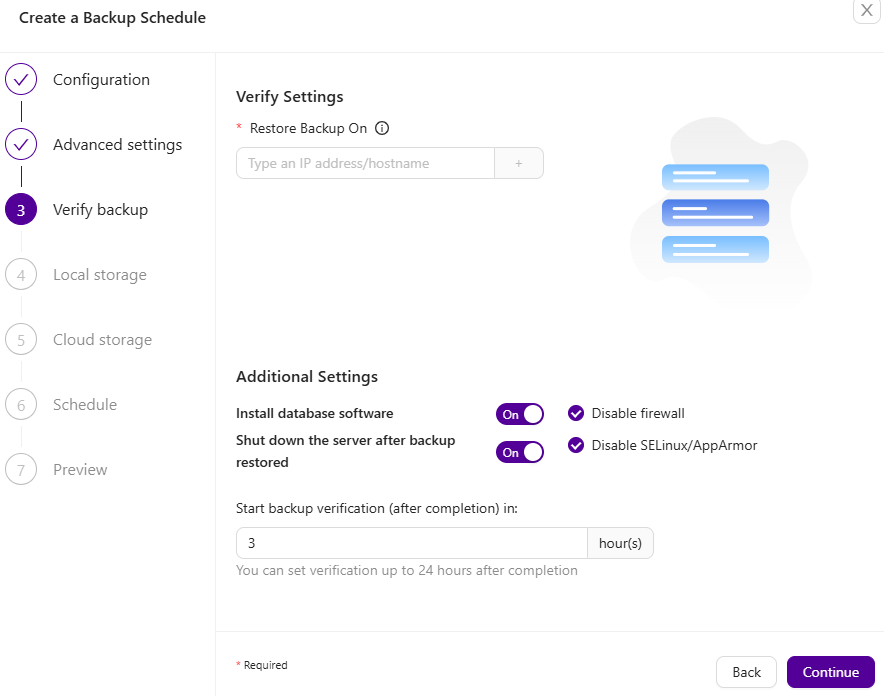
Clustercontrol brings you peace of mind by automatically validating the integrity of your backup data. It will execute a restore of your backup data, and alert in case of problems. The entire process is automated, and you only need to provide a target host where the verification will take place.
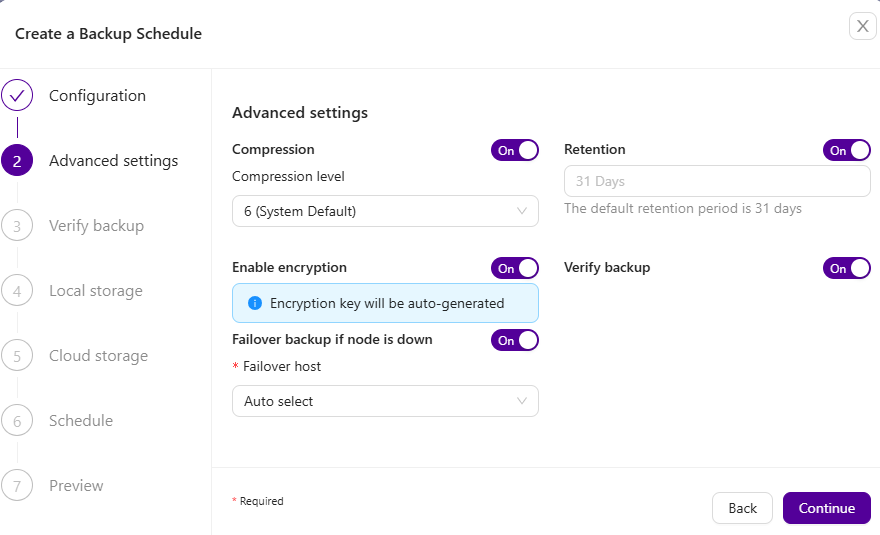
The backup verification option can be enabled during the backup schedule process. When this option is enabled, you will be able to specify the hostname as well as a list of settings like: install database software, disable firewall, disable SELinux, Apparmor. To minimize the cost of your IT infrastructure, you can also shut down the server after the backup verification is completed. The last option is to postpone the verification after x amount of hours, which can also help with better resource utilization.
Backup encryption
Do you trust the backup storage? Can you control access to your backups during the entire backup lifecycle? Encryption might be a good idea to protect your data. Clustercontrol maintains backup encryption for MySQL, MariaDB, MongoDB, Redis, and PostgreSQL databases. Backups encryption uses AES-256 CBC algorithm. You can find an auto-generated key in the cluster’s configuration file under /etc/cmon.d/cmon_X.cnf. If the backup destination is not local, the backup files are copied in an encrypted format. This feature complements the offsite backup on the cloud, where we do not have full access to the underlying storage system.
Clustercontrol not only creates encrypted backups, but it also maintains and recognizes encryption keys during the restore process. The entire workflow makes the backup encryption process easy to implement and manage.
Team management
Within Clustercontrol the default teams are: Admin, Nobody and Users. The Admin team can administer teams, users and clusters. The users’ team is only able to see the clusters he/she created. The Nobody team has no access to any cluster or Clustercontrol features.
You can add new access rules with each team. You can define the cluster access level as per functionality whether the role can view, no access, manage or custom (apply specific permission level for each cluster).
The MySQL privilege system ensures that all users can perform only the operations they are allowed to. Granting is critical as you don’t want to give all users complete access to your database, but you need users to have the necessary permissions to run queries and perform daily tasks.
Clustercontrol provides an interactive user interface to manage the database schemas and privileges. It unifies the accounts on all MySQL servers in the cluster and simplifies the granting process. You can easily visualize the database users, so you avoid making mistakes.
User and LDAP Management
Clustercontrol comes with an advanced user management system, managed by Clustercontrol Controller (cmon) service. Every operation initiated by Clustercontrol clients (GUI or CLI) is associated with a user. A user must be authenticated with the controller service before performing any operation:
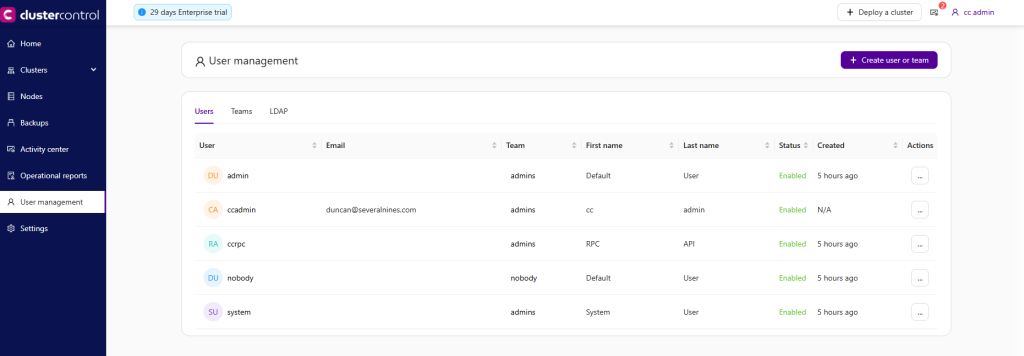
To create a new user/team, click on the Create user or team button:

You will get two options create user and create team:
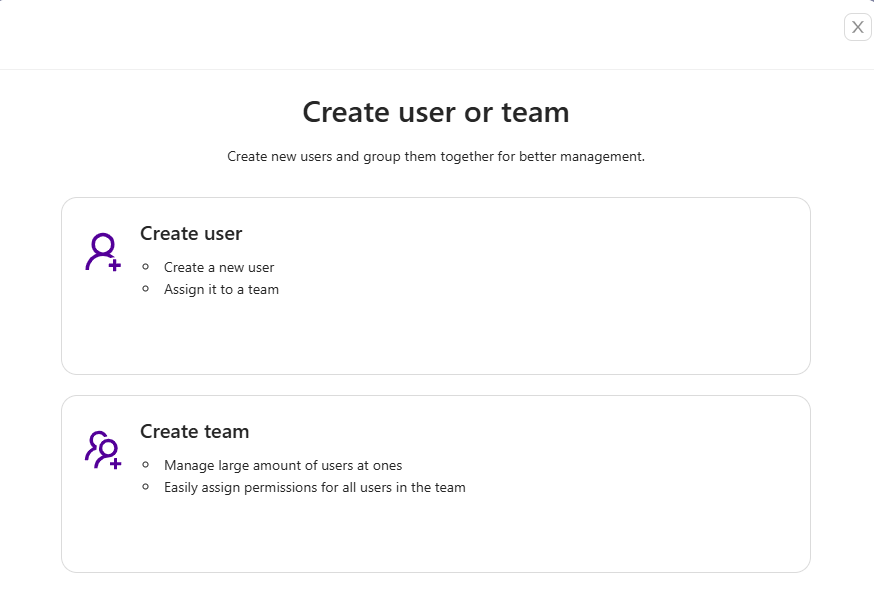
Create User creates a new ClusterControl user – a user which must belong to a team. A created user is also equal to a user inside of the CMON data tree which is accessible via the s9s CLI:
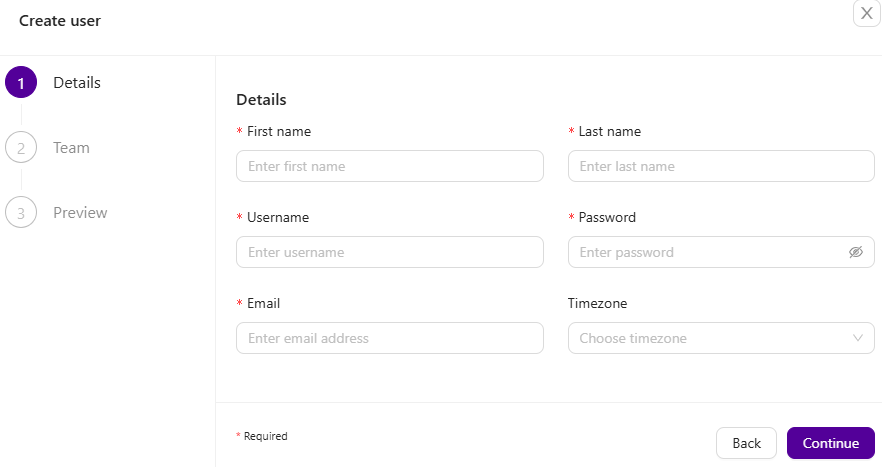
Create Team creates a ClusterControl team – a team created here is also equal to a group inside the CMON data tree which is accessible via the s9s CLI:
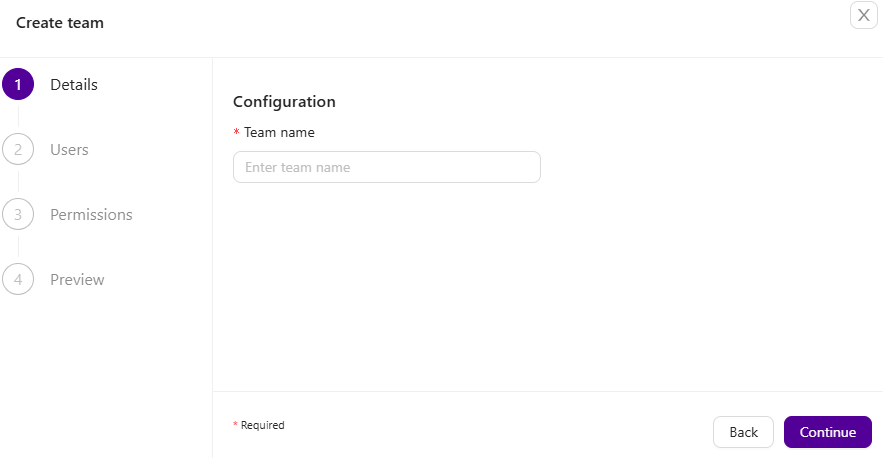
Keep in mind that one user belongs to one team. Users that are created here will be able to log in and see specific clusters depending on their team and the cluster they have been assigned to.
LDAP
Clustercontrol supports integration with directory services like Active Directory, FreeIPA, and OpenLDAP authentication. This allows users to log into Clustercontrol by using their corporate credentials instead of a separate password. LDAP groups can be mapped onto Clustercontrol user groups to apply privileges to the entire group. This would ensure that Clustercontrol authorizes the logged-in user based on the group assigned. It supports up to the LDAPv3 protocol based on RFC2307.
To integrate with a directory service, one has to perform the following steps:
- Fill up the LDAP Settings configuration wizard.
- Save the settings. At this point, LDAP is saved but not activated because no group mapping has been created yet.
- Create at least one group mapping entry by going to Map LDAP Group.
- Enable the LDAP authentication by toggling ON the LDAP Settings → Enable LDAP Authentication.
- Log in to Clustercontrol by using the value of Username Attributes with the respective password. The user will be authenticated and redirected to the Clustercontrol dashboard page based on the assigned group.
- From this point, both Clustercontrol and LDAP authentications would work.
The last entry of the group mapping can not be deleted while LDAP authentication is enabled and activated. To delete the last entry, set Enable LDAP Authentication to OFF and you will notice the Remove Group button is no longer greyed out, allowing you to remove the last group mapping entry.
LDAP SETTINGS
| Field | Description |
| General Settings | |
| Enable LDAP Authentication |
|
| LDAP/LDAPS URI |
|
| Login DN |
|
| Login DN Password |
|
| User Base DN |
|
| Group Base DN |
|
| Advanced Settings | |
| User Base Filter |
|
| Username Attributes |
|
| Real Name Attributes |
|
| Email Attributes |
|
| Group Base Filter |
|
| Static Member Attributes |
|
| Group Mapping Attributes |
|
| Group Name Attributes |
|
| Network Timeout |
|
| Protocol Version |
|
| Time Limit |
|
| SSL/TLS Settings | |
| CA Cert File |
|
| Certificate File |
|
| Key File |
|
Map LDAP Group
Clustercontrol requires at least one LDAP group mapping entry to be defined before the LDAP authentication can be activated. Otherwise, Clustercontrol would only save the LDAP settings without activating them.
To create a group mapping, click on the Map LDAP Group button. Pick an existing team from the dropdown and specify the value of the LDAP’s Group Name Attributes that you want to be mapped with the ClusterControl team. After creating the first entry, you may proceed to activate the LDAP authentication by going to LDAP Settings → Enable LDAP Authentication.
All LDAP configurations and mappings will be stored inside this configuration file, /etc/cmon-ldap.cnf. It is recommended to configure LDAP settings and group mappings via the Clustercontrol UI because any changes to this file will require a reload to the controller process, which is triggered automatically when configuring LDAP via the UI. You may also make direct modifications to the file, however, you have to reload the cmon service manually by using the systemctl restart cmon command, or service cmon restart.
| Field | Description |
| Map LDAP Group |
|
| Delete |
|
| Edit |
|
Failover
Outages are disruptive to any business, and they also cost money. A manual failover strategy is probably not the most efficient way to reduce downtime, since it does take time for somebody to be alerted, to get to a terminal, analyze logs and error messages to understand the issue, before finally starting a recovery procedure. So why not use an automated failover strategy?
Our guess is that many companies wished they had some sort of automated failover, and the reasons not to implement it are probably the complexity of the existing solutions, lack of competence in implementing such solutions, or lack of trust in software to take such an important decision.
There are a number of automated failover solutions, including (and not limited to) MHA, MMM, MRM, mysqlfailover, Orchestrator and Clustercontrol. Some of them have been on the market for a number of years, others are more recent. That is a good sign, multiple solutions mean that the market is there and people are trying to address the problem.
When we designed automatic failover within Clustercontrol, we used a few guiding principles.
Make sure the primary is really dead before you failover
- In case of a network partition, where the failover software loses contact with the primary, it will stop seeing it. But the primary might be working well and can be seen by the rest of the replication topology.
- Clustercontrol gathers information from all the database nodes as well as any database proxies/load balancers used, and then builds a representation of the topology. It will not attempt a failover if the secondaries can see the primary, nor if Clustercontrol is not 100% sure about the state of the primary.
- Clustercontrol checks whether the load balancers are able to connect to the writer DB node(primary). Just like with the secondary nodes, Clustercontrol will not attempt a failover if the load balancers are able to reach the writer DB node.
- Clustercontrol also makes it easy to visualize the topology of the setup, as well as the status of the different nodes (this is Clustercontrol’s understanding of the state of the system, based on the information it gathers).
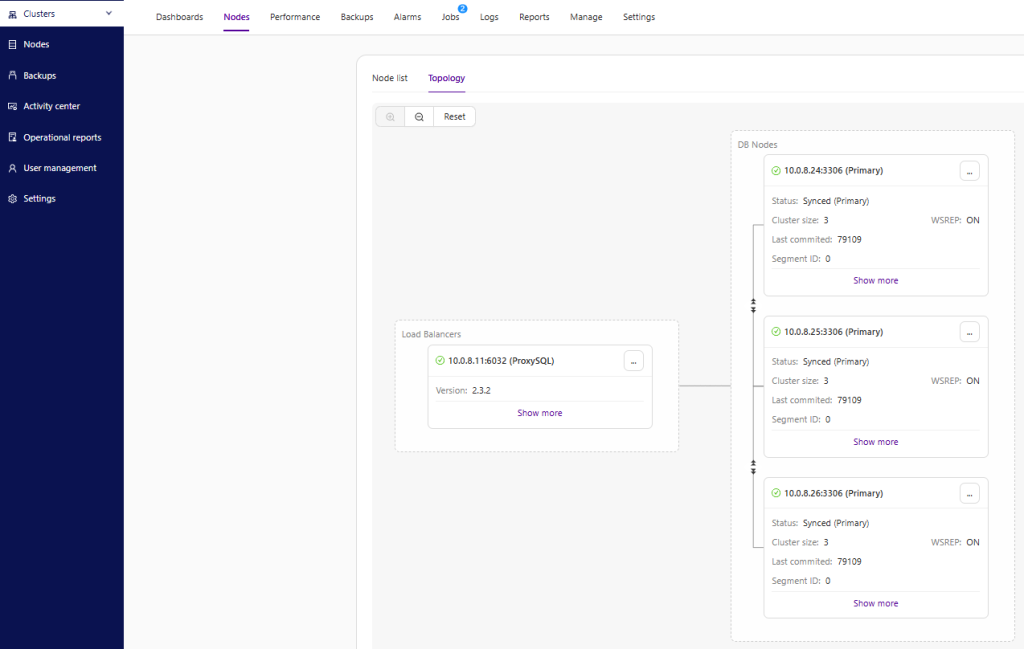
Failover only once
Much has been written about flapping. It can get very messy if the availability tool decides to do multiple failovers. That’s a dangerous situation. Each primary elected, however brief the period it held the primary role, might have their own sets of changes that were never replicated to any server. So you may end up with inconsistency across all the elected primaries.
Do not failover to an inconsistent secondary
When selecting a secondary to promote as primary, we ensure the secondary does not have inconsistencies, e.g. errant transactions, as this may very well break replication.
Only write to the primary
Replication goes from the primary to the secondary(s). Writing directly to a secondary would create a diverging dataset, and that can be a potential source of problem. We set the secondaries to read_only, and super_read_only in more recent versions of MySQL or MariaDB. We also advise the use of a load balancer, e.g., ProxySQL or MaxScale, to shield the application layer from the underlying database topology and any changes to it. The load balancer also enforces writes on the current primary.
Do not automatically recover the failed primary
If the primary has failed and a new primary has been elected, Clustercontrol will not try to recover the failed primary. Why? That server might have data that has not yet been replicated, and the administrator would need to do some investigation into the failure. Ok, you can still configure Clustercontrol to wipe out the data on the failed primary and have it join as a secondary to the new primary – if you are ok with losing some data. But by default, Clustercontrol will let the failed primary be, until someone looks at it and decides to re-introduce it into the topology.
Recovery algorithms are specific to the high availability model of the database. Galera Cluster, NDB Cluster, MySQL Replication, PostgreSQL Streaming Replication and MongoDB ReplicaSets all have their own approaches for failover and recovery.
Failover can also be customized. It can be enabled/disabled at node or cluster level, blacklists and whitelists ensure only the right instances are promoted to primary, and integration hooks for pre- and post-failover actions/programs ensures that behavior during failover can be customized.
Observe
Most production databases today run in some kind of high availability setup – from simpler master-slave replication to multi-master clusters fronted by redundant load balancers. Operations teams deal with dozens, often hundreds of services that make up the database environment.
Clustercontrol was originally designed to address modern, highly distributed database setups based on replication or clustering. It provides a systems view of all the components of a distributed cluster, including load balancers, and maintains a logical topology view of the cluster. This approach can be contrasted with traditional server monitoring tools where servers are monitored individually, without the context of the cluster they operate within. Monitoring a distributed cluster as a single entity, with the ability to drill down to the individual node, makes it easier and more effective for operational staff to manage the infrastructure.
Monitoring is also an area where operations teams commonly spend time developing custom solutions. For instance, Graphite and Cacti provide trending, Nagios provides alerting and Statsd and Collectd gather raw metrics. It is common to find IT teams integrating these systems in order to get a holistic view of their systems.
Clustercontrol provides a complete monitoring system with real time data to know what is happening now, high resolution metrics for better accuracy, configurable dashboards, and a wide range of third-party notification services for alerting.
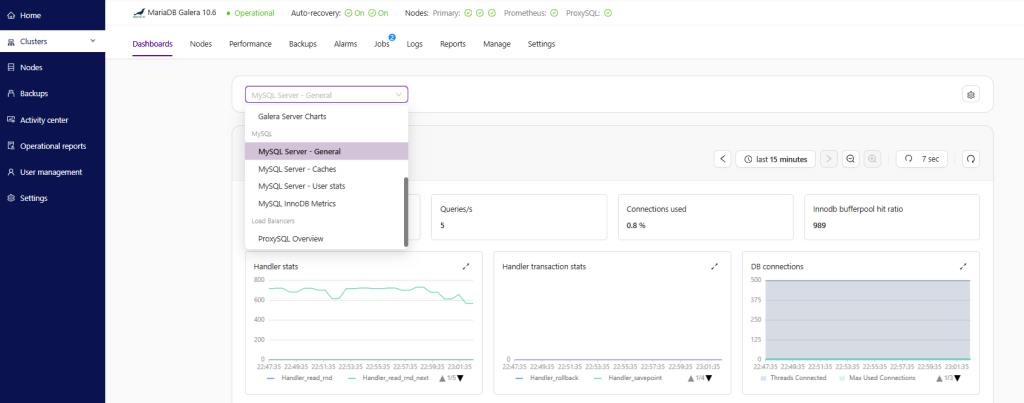
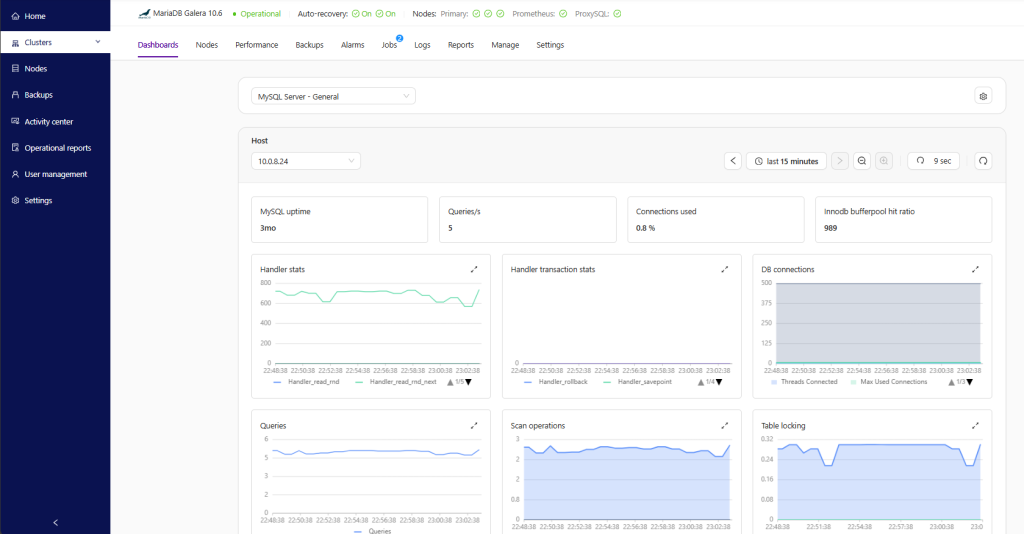
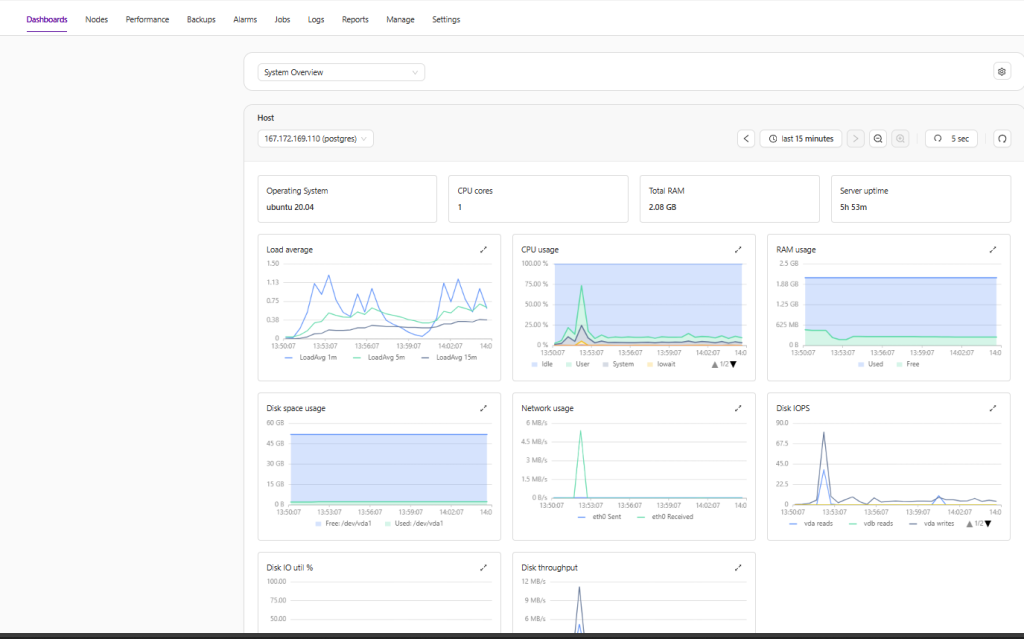
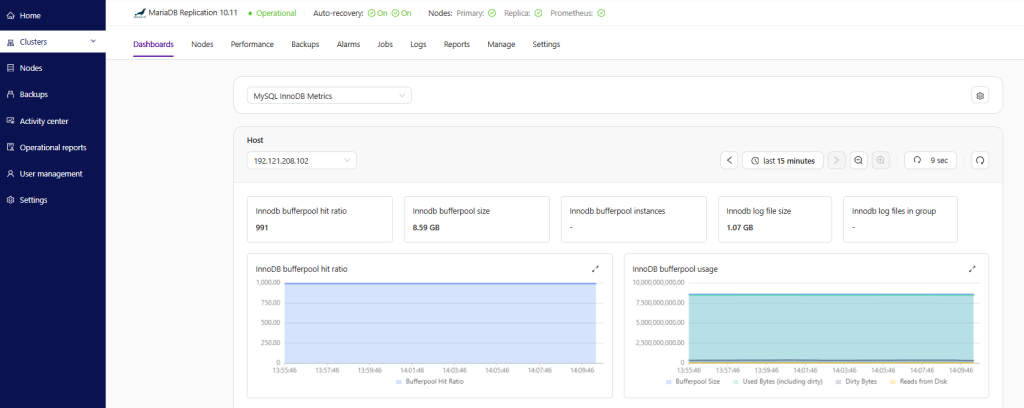
Clustercontrol provides several predefined dashboards. You don’t need to configure anything to use this feature, which provides a great overview of a cluster.
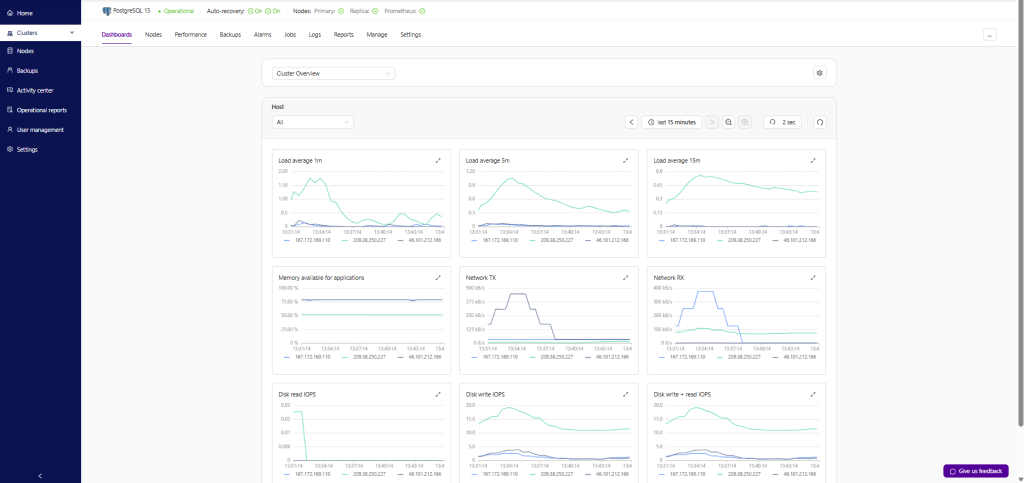
Dashboards can be customized with the types and metrics required. There are different dashboards for each cluster type, depending on the information that is relevant to the database vendor.
On-premises and cloud systems can be monitored and managed from the same Clustercontrol instance. Intelligent health-checks are implemented for distributed topologies, for instance detection of network partitioning by leveraging the load balancer’s view of the database nodes.
Monitoring can be agentless or agent-based. Agentless monitoring is done via SSH.
Proactive monitoring features allow the operations team to be alerted of trends or anomalies that might cause more severe problems in the future. For example, the database is consuming a lot of disk, and it is probable that the host will run out of space in a few days.
Integrations
Clustercontrol allows us to integrate our tools used daily in our organization, to facilitate tasks or centralize them in the same tool. For example, if an ops team uses Slack, all the team members can monitor and manage the databases from there. In the same way, we can access logs without connecting to the different hosts, which can save us considerable time.
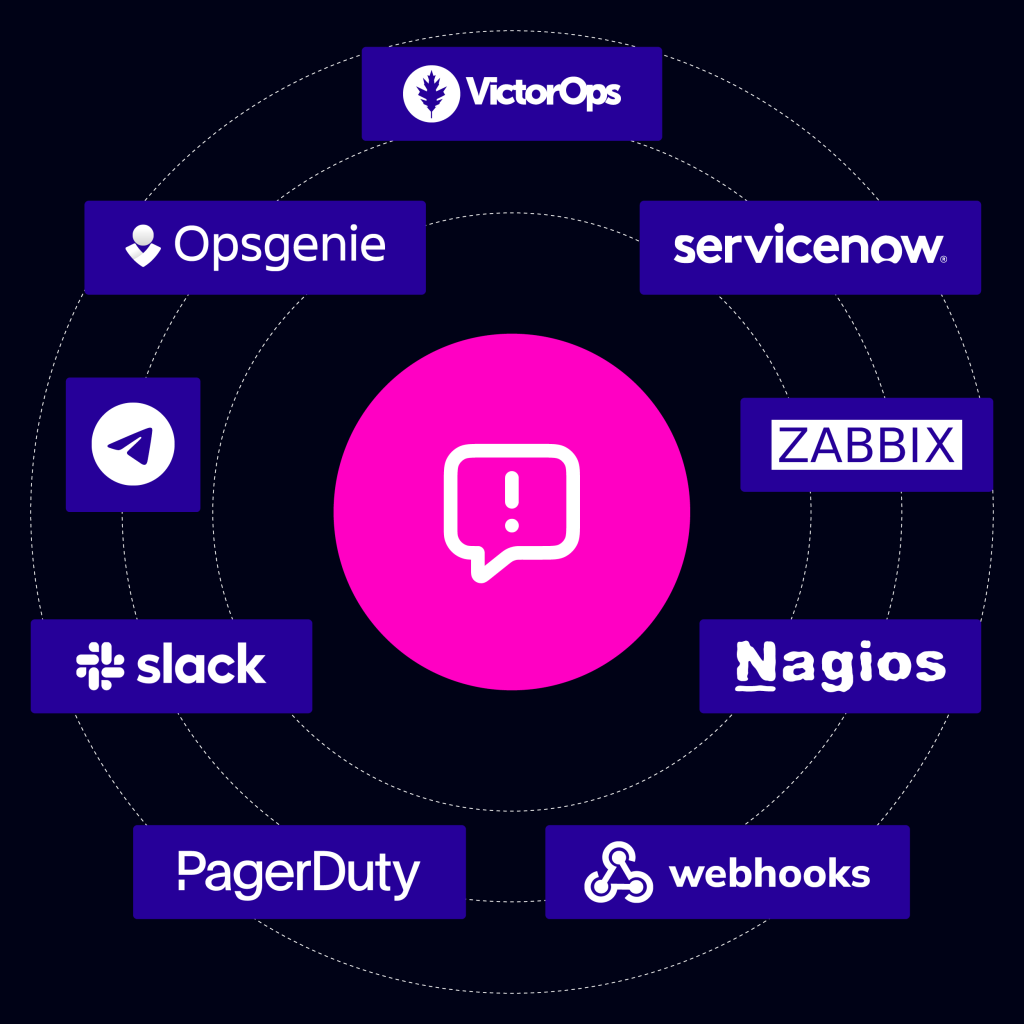
Some of the integrations include:
- Enterprise monitoring: Nagios, Zabbix
- Incident Management: PagerDuty, VictorOps, OpsGenie
- ChatOps: Slack, Telegram
- IT Service Management: ServiceNow
- Webhook
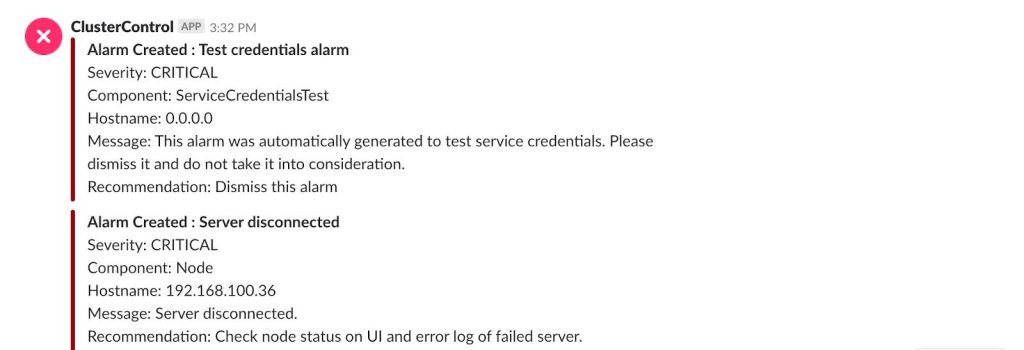
Let’s see an example integrating Clustercontrol with Slack:
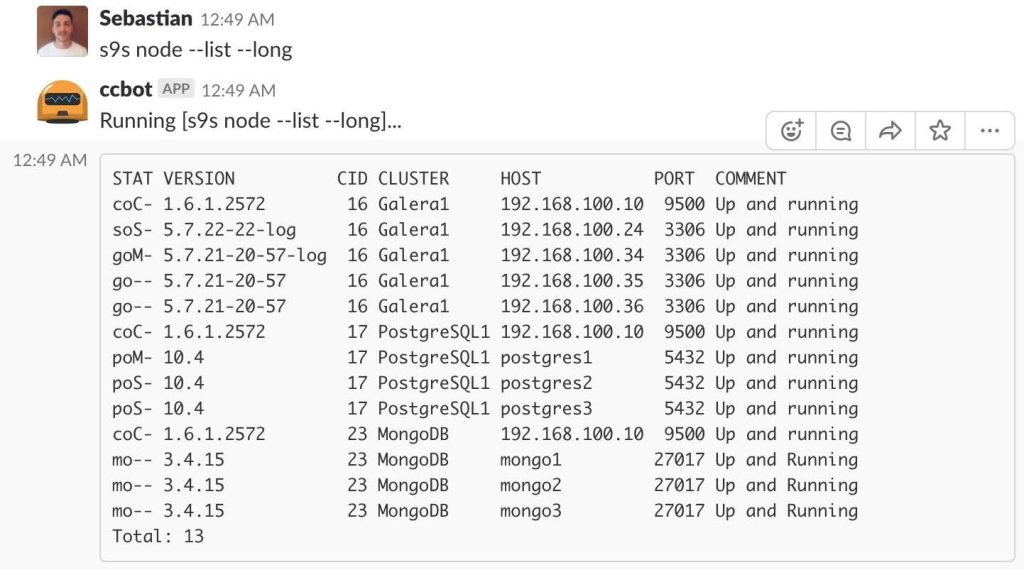
From Slack, we can use the s9s tool to check the current state of our Cluster.
In the same way, we can receive the alarms in our Slack:
Agent-based monitoring
Whether one wants to use a monitoring agent or go the agentless route is completely based on organizational policy requirements and custom needs. Although we love the simplicity of not having to install or manage agents on the monitored database hosts, an agent-based approach can provide higher resolution of monitoring data and has certain advantages in terms of security.
| Agentless | Agent-based | |
| Deployment | Software on Clustercontrol host only. Up and running within minutes | Agent installed on each monitored DB server |
| Admin. Overhead | Only CC needs to be maintained | Agents need to be maintained, updated, restarted in case of failures |
| Configuration | Centralized | Decentralized |
| Security | Controller to SSH into managed DBs, and require certain privileges. | More secure. Agent communication to DB/OS is internal to the server. No additional firewall rules. |
| Network Overhead | Additional traffic with more connections | Local data collection, results processed and then shipped to the server |
| Metrics resolution | High resolution at the cost of many connections | High resolution, a lot of data can be collected locally by the agent. No gaps in data if the network connection fails. |
Agent-based monitoring makes use of Prometheus, a time-series database that can scrape metrics over HTTP from exporters or agents running on the database nodes. One Prometheus server can be used to monitor multiple clusters.
Clustercontrol takes care of installing and maintaining Prometheus as well as exporters on the monitored hosts.

Clustercontrol has predefined dashboards for each of the supported cluster types.
Upgrade
Database vendors regularly issue critical patch updates to address software bugs or known vulnerabilities, but for a variety of reasons, organizations are often unable to install them in a timely manner, if at all. Evidence suggests that companies are actually getting worse at patching databases, with an increased number violating compliance standards and governance policies.
Patching that require database downtime would be of extreme concern in a 24/7 environment, however most cluster upgrades can be performed online.
Clustercontrol is able to perform a rolling upgrade of a distributed environment, upgrading and restarting one node at a time. The logical upgrade steps might slightly differ between the different cluster types. Load balancers would automatically blacklist unavailable nodes that are currently being upgraded, so that applications are not affected.
Operational reporting on version upgrades
Patches and upgrades is an area that requires constant attention, especially with the proliferation of open source databases in many organisations and more database environments being distributed for high availability. Clustercontrol provides a solid operational reporting framework, and can help answer simple questions like:
- What versions of software are running across the environment?
- Which servers should be upgraded?
- Which servers are missing critical updates?
Reports can be scheduled, and automatically mailed out to a list of recipients.
Clustercontrol includes an improved and redesigned patch management system. It will perform the software upgrade based on what is available in the package repository for the particular vendor. Having said that, if the database vendor repository is not up-to-date, or can not be updated to the latest repository (e.g, non-Internet environment, or outbound connections behind a pre-configured HTTP proxy), Clustercontrol will not be able to perform the upgrade since there will be no new packages appear in the server’s repository list.
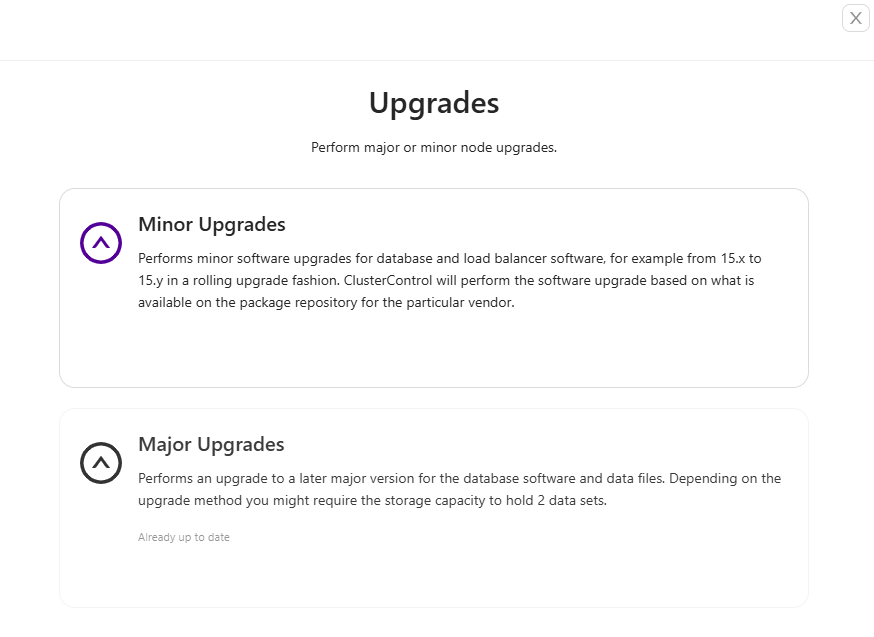
As far as upgrades are concerned, Clustercontrol can provide you with minor and major upgrade options.
Minor upgrades
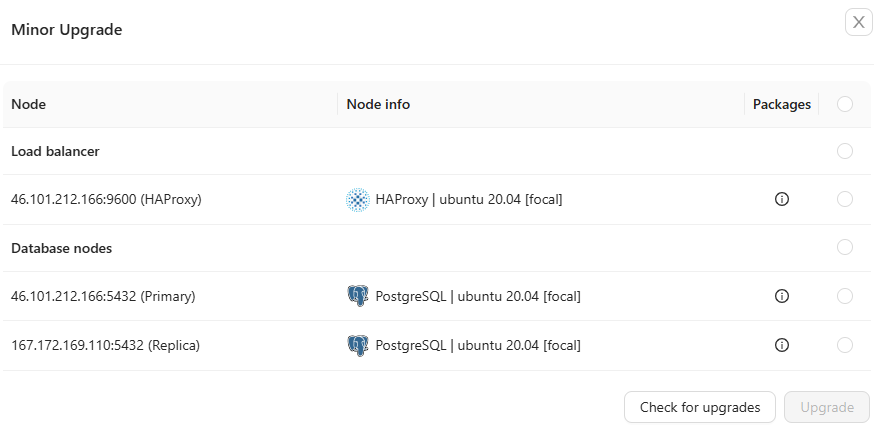
Performs minor software upgrades for database and load balancer software. Minor upgrade version formatting is notably different depending on the database type and vendor for example from 15.x to 15.y.
For a primary-replica replication setup, Clustercontrol will perform the upgrade starting from the replica/secondary nodes and will eventually perform the upgrade on the primary node of a cluster (secondary first, primary last). During the eventual primary node upgrade, expect a service disruption to the database cluster service until the primary node is online again after restarting.
For a multi-primary setup, Clustercontrol will upgrade any database node in a random order, one node at a time. If a node fails to be upgraded, the upgrade job is aborted and manual intervention is required to recover or reinstall the node. Due to this fact, it is important to have a proper maintenance window, which should only be performed when there is as little traffic as possible to the cluster.
Major upgrades
Performs major software upgrades for the database software. Only one major version upgrade is supported at a time, for example, from PostgreSQL 13.x to 14.x. At the moment, only PostgreSQL-based clusters are supported. If you want to upgrade from PostgreSQL 12.x to 14.x, you have to upgrade stage-by-stage to PostgreSQL 13.x first, followed by PostgreSQL 14.x.
For a primary-replica replication setup, Clustercontrol will perform the upgrade starting from the replica/secondary nodes and will eventually perform the upgrade on the primary node of a cluster (secondary first, primary last). During the eventual primary node upgrade, expect a service disruption to the database cluster service until the primary node is online again after restarting. If a node fails to be upgraded, the upgrade job is aborted and manual intervention is required to recover or reinstall the node. Due to this fact, it is important to have a proper maintenance window, which should only be performed when there is as little traffic as possible to the cluster.
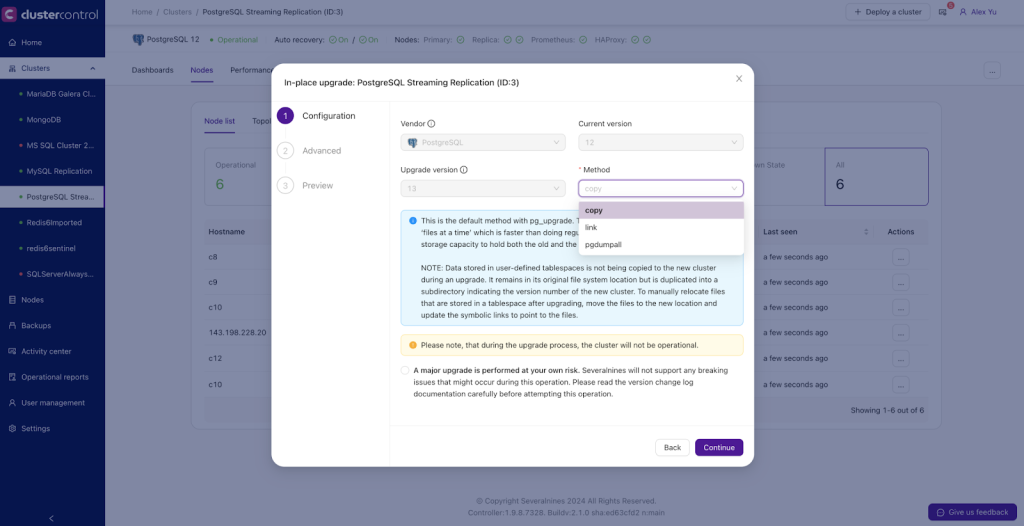
Clustercontrol currently provides 3 methods for the upgrades, copy, link, and pgdumpall.
- The copy method will clone or copy the existing data directory into the target directory for the new version. This means your disk needs to have double the free space to store the cloned data.
- The link method will create a hard link to your current data directory, it’s faster than the copy method.
- The pgdumpall method will take a backup for your current database and try to restore the data after the upgrade has finished.
Performance management
Monitoring performance of production databases is one of the most important tasks within database administration. It is an ongoing process that requires constant attention, since databases usually evolve with time – database size, number of users, workload, schema changes that come with application changes, and so on.
Continuous monitoring
Traditional monitoring tools normally assess the health of a database (is it working, or is it broken?), but don’t identify database performance issues. Modern APM tools do a great job at providing a holistic view of applications and databases, but the downside is that they lack depth of information in some parts of the stack. For instance, most of the tools available provide a much more detailed view of application activity as compared to database activity. According to research firm Gleanster LLC, the database is the number 1 source of issues with performance. Without the appropriate tools, the ops team would need to spend an inordinate amount of time combing through cumbersome SQL logs to find performance problems.
Advanced analytics and advisors
Clustercontrol offers a number of ways to present performance of various portions of the database.
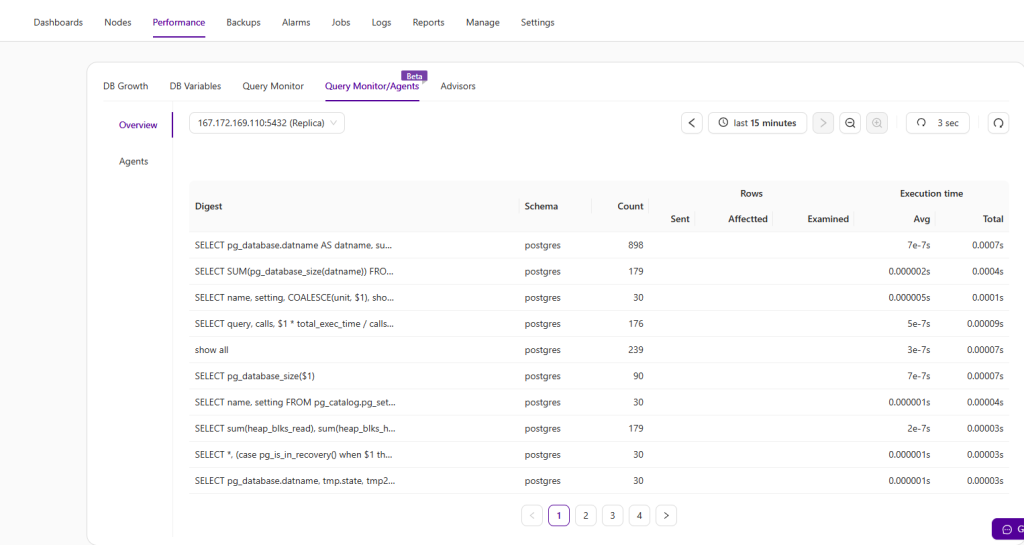
Workload analytics provides visibility into transactions/queries from applications. Performance anomalies are never expected, but they do happen and are easy to miss in a sea of data. Outlier detection will find any queries that suddenly start to execute much slower than normal. It tracks the moving average and standard deviation for query execution times, and detects/alerts when the difference between the value exceeds the mean by 2 standard deviations.

Wait time analysis can help you understand how much time a database query spends across all of its execution stages in a given time period. Instead of focusing only on resource usage like CPU, memory or disk IO, all that would really matter is how much time is needed to execute some commands. You may also have a very fast SQL that runs in a few milliseconds, but if it has to run a million times a day, it can ruin your application performance.
Usually, wait time analysis starts from individual SQL statements that have the most impact on overall database execution time, and breaks down each step to the millisecond. Supplied with wait time and lock time information, and combined with information from the performance dashboards, you can recognize the most significant contributor to the slow performance.
A big chunk of ops management consists of tracking your monitoring systems. Raw metrics can be interpreted and consolidated in various ways to give you insight into your database operations and thereby to optimize them. Looking at metrics on their own is not enough though, since there are hundreds of metrics with sophisticated relations between them. Deeper workload analysis requires metrics to be combined and computed in different ways.
Clustercontrol provides an advisor engine that allows for deeper analysis of workload and resource usage. Advisors are mini-programs that are executed by Clustercontrol, either on-demand or after a schedule. They can be anything from simple configuration guidance, warning on thresholds or more complicated rules for forecasts or cluster-wide self-regulation tasks based on metrics data. In general, advisors perform more detailed analysis and produce more comprehensive recommendations than alerts.
A number of predefined advisors are available, they can be categorized in different areas – security, schema, replication, performance schema, InnoDB, Galera, connections, and hosts. An example of an elaborate advisor for a specific clustering technology (Galera Cluster for MySQL or MariaDB) determines the write load on the cluster and rates if the Galera cache file is adequate in size to support a replication window threshold. Another predictive type advisor which is independent of database type checks the historical disk usage/growth rate and predicts when a host may run out of disk space.
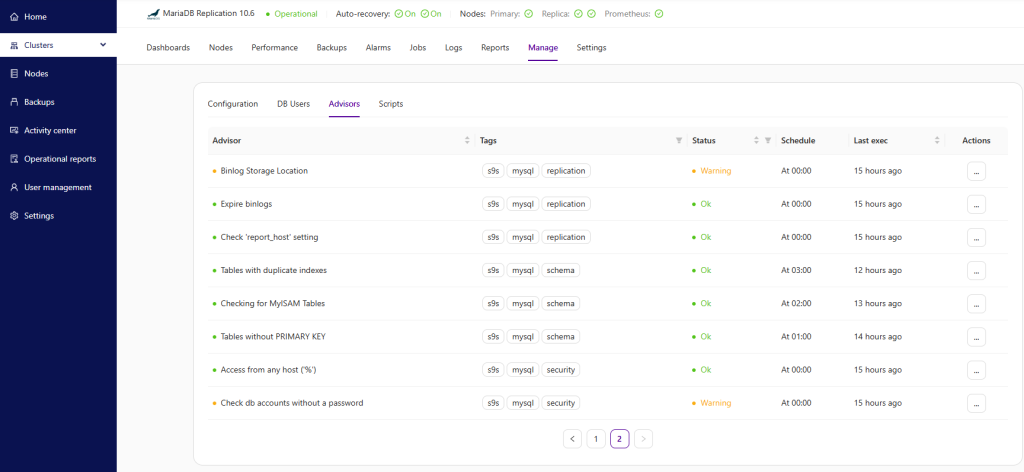
You can view the catalog of advisors, and for each advisor, the date/time since the last update. Some advisors are scheduled to run only once a day so their advice may no longer reflect the reality – for instance, if you already resolved the issue you were warned about. Advisors are stored in the Clustercontrol database, and can be managed from the GUI interface, where you can enable, disable, and modify execution times. You can also manually re-run the advisor. We also have a public Github repository where advisors can be shared with other Clustercontrol users.
Configuration management
Configuration management represents the source of the configuration items for the database – from the database software packages to configuration files. Having the exact version of the database software available in a local repository ensures that instances of that version only will be deployed to expand existing setups, or create new ones. Being able to view and edit configuration files of multiple instances from one single point simplifies the administrator’s job of keeping track of what is deployed, and how changes are rolled out. For certain cluster types, configurations ought to be similar across all nodes. So a way of detecting diverging configuration settings can help avoid problems further down the line.
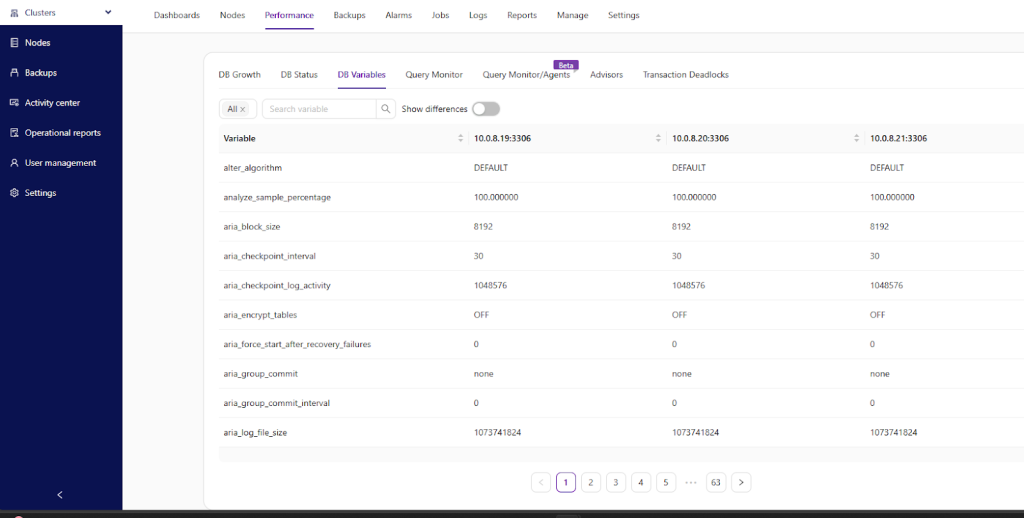
Clustercontrol generates a configuration when deploying a database setup – just fill in some values (database vendor, data directory, password and hostnames) in the deployment wizard and you’re good to go. The rest of the configuration options will be automatically determined (and calculated) based on the host specifications (CPU cores, memory, IP address, etc.) and applied to the template file that comes with Clustercontrol.
Clustercontrol will load the base content of the Galera configuration template from /usr/share/cmon/templates/my.cnf.galera into the CMON database after deployment succeeds. You can then customize your own configuration file directly in the Clustercontrol UI. Whenever you hit the Save button, the new version of the configuration template will be stored inside of the CMON database, without overwriting the base template file.
There are a number configuration variables which are configurable dynamically by Clustercontrol. These variables are represented with capital letters enclosed by the ‘@’ sign, for example @DATADIR@. For full details on supported variables, please refer to this page.
If the dynamic variable is replaced with a value (or undefined), Clustercontrol will skip it and use the configured value instead. This is handy for advanced users, who usually have their own set of configuration options that are tailored for specific database workloads.
All configuration files can be viewed in the Web Interface, and configuration changes can be applied dynamically on the instance as well as persisted on disk. Parameters can be set on one or more instances that form part of the cluster. The admin is also advised when a rolling restart is required in order to apply changes, this can also be triggered from Clustercontrol.
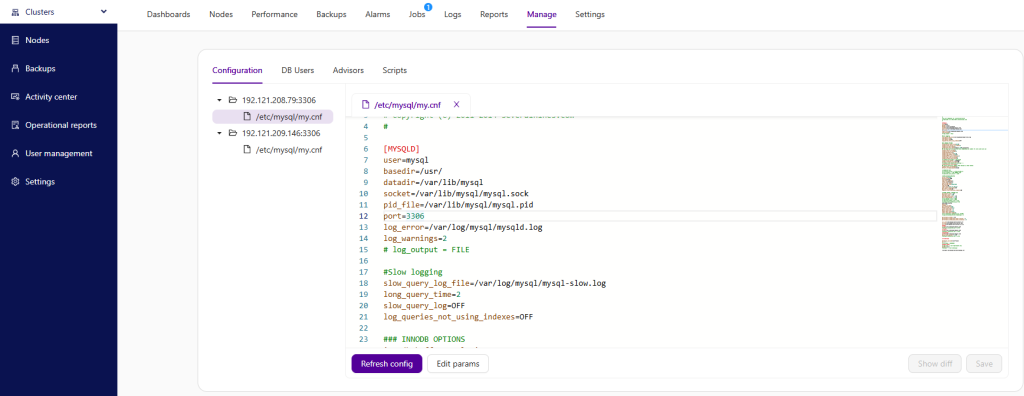
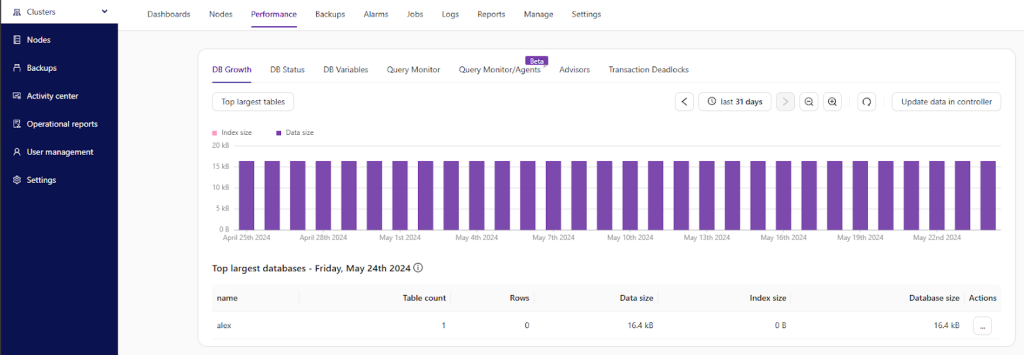
As far as configuration management is concerned, you are also able to see query monitor, advisors, the status and growth of your database, the output of current DB status and similar things. You are also able to see Transaction deadlocks:

For example, here’s how your database growth chart might look like:
The transaction deadlocks on the other hand shows which transactions got stuck, which transactions blocked them, how long the transactions ran and when were they last seen etc. which means that it can be very helpful when (if) you want to figure out where your queries get stuck etc.
Report
You may already have a couple of monitoring tools with all possible metrics/graphs, and you probably have also set up alerts based on metrics and thresholds. Some will even have automated advisors providing recommendations or fixing things automatically. That’s good – having visibility into your system is essential; nevertheless, you need to be able to process a lot of information.
To make sure your systems are in a good shape, you’d need to go through quite a lot of information – host statistics, database server statistics, workload statistics, state of backups, database packages, logs and so forth. Such data should be available in every properly monitored environment, although sometimes it is scattered across multiple locations – you may have one tool to monitor database state, another tool to collect system statistics, maybe a set of scripts, e.g., to check the state of your backups. This makes health checks much more time-consuming than they should be – the DBA has to put together the different pieces to understand the state of the system. Integrated tools like Clustercontrol have an advantage that all of the different bits of information are located in the same place.
Clustercontrol operational reports arm you with information about your database infrastructure status, which you can use to audit your environment or as part of operational support. These reports consist of different checks and address various day-to-day DBA tasks. The idea behind Clustercontrol operational reporting is to put all of the most relevant data into a single document which can be quickly analyzed in order to get a clear understanding of the status of the databases and its processes.
Reports can be scheduled, or created on-demand. These include:
- The operational health of databases
- Service availability & uptime
- Resource usage for capacity planning
- Insight to optimize database operations
- Underutilized databases
- Changes to database schemas
- Which systems cause the most downtime
- Which systems will need more capacity
- Which database software versions are currently running
- Which systems need upgrading
- Which systems have backups, and which ones don’t
Additional developer interfaces
API
Having an API to access an application is quite powerful. Clustercontrol makes this possible through its REST API. Given that the API is quite low-level, we have provided the definition of the API and corresponding language bindings for Python, Java and GoLang to make the API less cumbersome to consume by developers.
OpenAPI definition
https://github.com/severalnines/Clustercontrol-client-sdk/blob/main/Clustercontrol-v2.yaml
Language bindings
Python
GoLang
Java
Command line interface (CLI)
Clustercontrol CLI (or s9s CLI), is a command line tool to interact, control and manage your database infrastructure using Clustercontrol. The s9s command line project is open source and can be found on GitHub at https://github.com/severalnines/s9s-tools.
By default, the s9s CLI is installed on the Clustercontrol host by the installer script and it can also work remotely outside of the Clustercontrol server (on your workstation laptop or bastion host), as long as the controller’s RPC interface is reachable to the client network (RPC interface is default to 127.0.0.1:9501). It provides an easy terminal interface to the Clustercontrol RPC v2 API and the communication between this client and CMON controller is encrypted and secure through TLS. You will find it very useful when working with large scale deployments and allow you to design more complex features and workflows.
To highlight some of its capabilities, the following are the supported features up until version 1.6:
- Database clusters and load balancers deployment:
- MySQL – Standalone, MySQL Replication or Galera Cluster
- PostgreSQL – Standalone or streaming replication
- MongoDB – Replica Set
- Load balancers – MaxScale and PGBouncer
- Import existing MySQL, PostgreSQL and MongoDB clusters
- Database and host monitoring:
- Status of nodes and clusters
- Host stats and database stats
- Graphs within terminal
- Process monitoring
- Cluster and node management:
- Create, stop or start clusters
- Add, remove, or restart nodes in the cluster
- Schema and user management
- Configuration management
- Maintenance mode management
- Backup management:
- Create and schedule backups
- Restore backups
- Cloud/virtualization management:
- Manage cloud instances on AWS
- Manage containers on LXC
- Job monitoring and management:
- Monitor job progress
- View the job log
- Delete and schedule a job
Clustercontrol, however, supports a bunch of more features including:
- New user and LDAP management:
- The ability to create users or teams with access control for different roles.
- LDAP support for authenticating Clustercontrol users with the most popular LDAP server options.
- Unified user database to keep web application users and command line users working smoothly.
- Underlying user management system based on Unix / Linux filesystem permissions.
- New patch management:
- Clustercontrol includes an improved and redesigned patch management system to upgrade MySQL, PostgreSQL and ProxySQL nodes: Clustercontrol can now show installed packages and versions, you can check and update new packages to upgrade or you can upgrade nodes selectively.
- Clustercontrol also includes some updates for PostgreSQL:
- Support for PostgreSQL v16 (deployment and importing)
- PostgreSQL 15 instances can now be imported and deployed.
- Support the
pgvectorextension. - Support for PostgreSQL Enterprise as well as MongoDB Enterprise.
- Enable
pgauditextension for audit logging. - Now you can log different classes of statements:
READ: SELECTandCOPYwhen the source is a relation or a query.WRITE: INSERT, UPDATE, DELETE, TRUNCATE, andCOPYwhen the destination is a relation.FUNCTION: Function calls andDOblocks.ROLE: Statements related to roles and privileges:GRANT, REVOKE, CREATE/ALTER/DROP ROLE.DDL: AllDDLthat is not included in theROLEclass.MISC: Miscellaneous commands, e.g.DISCARD,FETCH, CHECKPOINT,VACUUM, SET.MISC_SET: MiscellaneousSETcommands, e.g.SET ROLE.ALL:Include all of the above.
- You can also tag clusters to quickly identify one or more clusters that are used for specific reasons:
- Tags can be added when clusters are imported or deployed.
- You can also search for clusters that have specific tags.
- Host/server connection check whenever an IP/hostname is entered with form wizards.
Actions you take from the CLI will be visible in the ClusterCcontrol Web UI and vice versa. The Clustercontrol CLI and GUI are fully integrated and synced to allow you to utilize the CLI for deployment and management of your databases and load balancers, whilst using the advanced graphs in the GUI for monitoring and troubleshooting.
The command line tool is invoked by executing a binary called s9s. The commands are basically JSON messages being sent over to the Clustercontrol Controller (CMON) RPC interface. The command line client installs manual pages and can be viewed by entering the command:
$ man s9s
$ s9s --help
Here are some of the example commands that you can use to operate your database cluster from s9s command line:
Deployment
Deploy a three-node Percona XtraDB Cluster 8.0 cluster, with OS user vagrant:
Deploy a MongoDB Sharded Cluster with 3 mongos, 3 mongo config and one shard consists of a three-node replica set called ‘replset2’ with different priority for each node:
$ s9s cluster --create \
--cluster-type=galera \
--nodes="10.10.10.10;10.10.10.11;10.10.10.12" \
--vendor=percona \
--provider-version=8.0 \
--db-admin-passwd='pa$$word' \
--os-user=vagrant \
--cluster-name='Percona XtraDB Cluster 8.0'
$ s9s cluster --create \
--cluster-type=mongodb \
--vendor=10gen \
--provider-version=7.0 \
--db-admin=adminuser \
--db-admin-passwd=adminpwd \
--nodes="mongos://192.168.1.11;mongos://192.168.1.12;mongos://192.168.1.12;mongocfg://192.168.1.11;mongocfg://192.168.1.12;mongocfg://192.168.1.13;192.168.1.14?priority=5.0;192.168.1.15?arbiter_only=true;192.168.1.16?priority=2;192.168.1.17?rs=replset2;192.168.1.18?rs=replset2&arbiter_only=yes;192.168.1.19?rs=replset2&slave_delay=3&priority=0"Import and existing Percona XtraDB Cluster 8.0 and let the deployment job running in foreground (provided passwordless SSH from ClusterControl node to all database nodes have been setup correctly):
$ s9s cluster --register \
--cluster-type=galera \
--nodes="192.168.100.34;192.168.100.35;192.168.100.36" \
--vendor=percona \
--provider-version=8.0 \
--db-admin="root" \
--db-admin-passwd='My&2d$w0r@d' \
--os-user=root \
--cluster-name="PXC Prod 1 - GCP" \
--wait
Monitoring
Get a summarized view of all nodes:
$ s9s node --list --long
STAT VERSION    CID CLUSTER                HOST       PORT  COMMENT
coC- 2.0.0.8821  23 PostgreSQL 15          10.0.0.156  9500 Up and running
poM- 15.7        23 PostgreSQL 15          10.0.0.44   5432 Up and running
poS- 15.7        23 PostgreSQL 15          10.0.0.58   5432 Up and running
poS- 15.7        23 PostgreSQL 15          10.0.0.60   5432 Up and running
soS- 8.0.35-27-log  24 Oracle 8.0 Replication 10.0.0.104  3306 Up and running.
coC- 2.0.0.8821  24 Oracle 8.0 Replication 10.0.0.156  9500 Up and running
soM- 8.0.35-27-log  24 Oracle 8.0 Replication 10.0.0.168  3306 Up and running.
mo-- 7.0.9      25 MongoDB 7.0            10.0.0.125 27017 Up and Running
mo-- 7.0.9      25 MongoDB 7.0            10.0.0.131 27017 Up and Running
coC- 2.0.0.8821  25 MongoDB 7.0            10.0.0.156  9500 Up and running
mo-- 7.0.9      25 MongoDB 7.0            10.0.0.35  27017 Up and Running
Total: 11
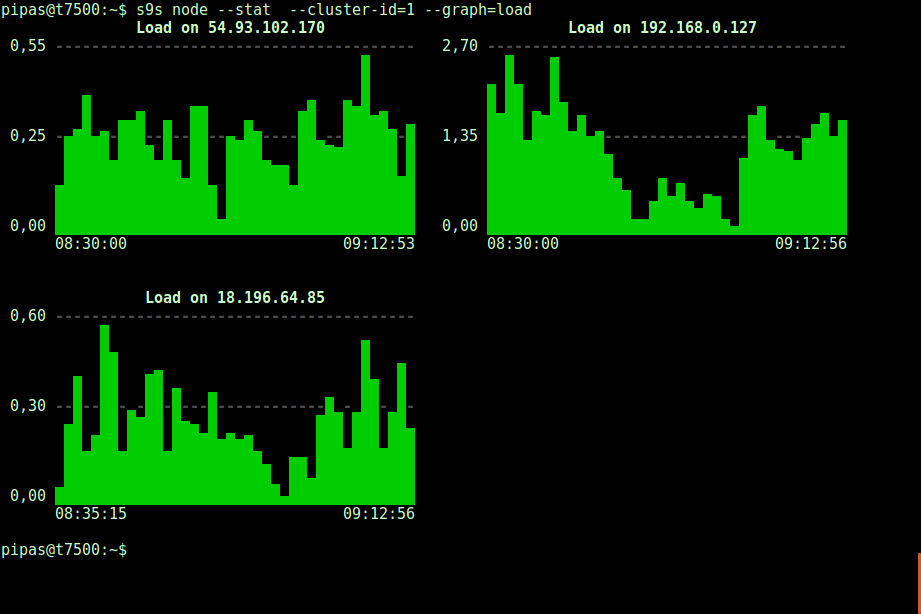
Shows server load histogram in graph format for cluster ID 1:
Scaling
Add a database node to an existing MongoDB Sharded Cluster with cluster ID 12 having replicaset name ‘replset2’:
$ s9s cluster --add-node \
--cluster-id=12 \
--nodes=mongodb://192.168.1.20?rs=replset2
Remove a database node from cluster ID 1 as a background job:
$ s9s cluster --remove-node \
--nodes=10.10.10.13 \
--cluster-id=1
Management
Schedule a full backup using MariaDB backup every midnight at 12:00 AM:
$ s9s backup --create \
--backup-method=mariabackupfull \
--nodes=10.10.10.19:3306 \
--cluster-name=MDB101 \
--backup-dir=/home/vagrant/backups \
--recurrence='0 0 * * *'
Push a configuration option inside my.cnf (max_connections=500) on node 10.0.0.3:
$ s9s node --change-config \
--nodes=10.0.0.3 \
--opt-group=mysqld \
--opt-name=max_connections \
--opt-value=500
Restart the database service on node 192.168.1.117 for cluster ID 1:
$ s9s node --restart \
--cluster-id=1 \
--nodes=192.168.1.117 \
--log
Schedule a rolling restart of the cluster 20 minutes from now:
$ s9s cluster --rolling-restart \
--cluster-id=1 \
--schedule="$(date -d 'now + 20 min')"
Check out the ClusterControl CLI documentation page for more details and examples.
Clustercontrol Terraform provider
Terraform is a popular infrastructure as code tool that makes it possible to deploy infrastructure in a controlled manner using code which can be maintained in a version control system. Severalnines has extended the ability to deploy database clusters using Clustercontrol using the Terraform-provider-Clustercontrol plugin for Terraform.
To get started with the CC Terraform provider, you need to first configure your Clustercontrol installation for API access. To do that, in your Clustercontrol node edit the /etc/default/cmon and set the RPC_BIND_ADDRESSES as shown below:
RPC_BIND_ADDRESSES="<cc-node-private_ip>,127.0.0.1"Substitute <cc-node_private_ip> with your Clustercontrol node private IP. Restart the Clustercontrol service to apply the changes:
$ sudo systemctl restart cmonRun a quick test to make sure you can access Clustercontrol via its REST API (using curl or Postman):
curl -k 'https://<cc-node_private_ip>:9501/v2/clusters' -XPOST -d '{"operation": "getAllClusterInfo", "authenticate": {"username": "CHANGE-ME","password": "CHANGE-ME"}}'Where username and password are valid login credentials for Clustercontrol you set during installation. The output should be a load of JSON text returned with details of the clusters managed by Clustercontrol. This will be empty seeing we have no cluster in our environment yet.
{
    "controller_id": "cec25ce5-0d12-4151-adfc-243ec7e04877",
    "is_superuser": true,
    "request_processed": "2024-05-05T16:46:37.401Z",
    "request_status": "Ok",
    "total": 0,
    "clusters":
    [
        "RPC V2 authenticated user is 'dodazie'."
    ],
    "user":
    {
        "class_name": "CmonUser",
        "cdt_path": "/",
        "acl": "user::rwx,group::r--,other::r--",
        "disabled": false,
        "email_address": "[email protected]",
        "last_failed_login": "",
        "last_login": "2024-05-05T16:46:37.397Z",
        "n_failed_logins": 0,
        "origin": "CmonDb",
        "suspended": false,
        "user_id": 5,
        "user_name": "dodazie",
        "groups":
        [
            {
                "class_name": "CmonGroup",
                "cdt_path": "/groups",
                "owner_user_id": 1,
                "owner_user_name": "system",
                "owner_group_id": 1,
                "owner_group_name": "admins",
                "acl": "user::rwx,group::rwx,other::---",
                "created": "2024-04-30T22:53:43.079Z",
                "group_id": 1,
                "group_name": "admins"
            }
        ],
        "timezone":
        {
            "class_name": "CmonTimeZone",
            "name": "UTC",
            "abbreviation": "UTC",
            "offset": 0,
            "use_dst": false
        }
    }
}
Next, let’s set up the Terraform provider for Clustercontrol. On your Clustercontrol node, in any directory of your choice, create a terraform.tfvars to store your Clustercontrol secrets. In the file, add the following secrets:
cc_api_url="https://<cc-node-private_ip>:9501/v2"
cc_api_user="CHANGE-ME"
cc_api_user_password="CHANGE-ME"
Still in your CC node, create a new Terraform file called main.tf. For this demo, the main.tf file will store the Clustercontrol Terraform provider configuration and resources.
To install the Clustercontrol Terraform provider, copy and paste the following in the main.tf.
terraform {
  required_providers {
    clustercontrol = {
      source = "severalnines/clustercontrol"
      version = "0.2.15"
    }
  }
}

variable "cc_api_url" {
  type = string
}

variable "cc_api_user" {
  type = string
}

variable "cc_api_user_password" {
  type = string
}


provider "clustercontrol" {
  cc_api_url = var.cc_api_url
  cc_api_user= var.cc_api_user
  cc_api_user_password= var.cc_api_user_password
}
The above Terraform code will install the Terraform Provider for Clustercontrol, import the secrets from the terraform.tfvars and configure the provider for use across the environment.
Run terraform init to initialize the directory and install the provider. You should see an out similar to below:
Initializing the backend...

Initializing provider plugins...
- Finding severalnines/clustercontrol versions matching "0.2.15"...
- Installing severalnines/clustercontrol v0.2.15...
- Installed severalnines/clustercontrol v0.2.15 (self-signed, key ID AC426DD502816469)
You can also verify the correctness of the configuration with terraform validate command:
Success! The configuration is valid.With your Clustercontrol Terraform provider configuration validated, you can now deploy database clusters.
Find more information here:
Conclusion
Clustercontrol provides a unified software platform to deploy and run state of the art open-source database infrastructures. It can be of great assistance to existing DevOps teams who wish to automate a number of mundane, time consuming, yet essential tasks, and ‘scale’ themselves by providing higher value services to their organizations – e.g., spend more time on architecture and design, help developers write scalable database applications, optimize database code, work on capacity planning and other activities that make a bigger impact on their organization.
Database administration is a specialized, fading role. The bar for the DBA role is high — solution design, configuration, resilience, troubleshooting and maintenance updates, application clustering, database clustering, storage clustering, network bonding, server load balancing and traffic management, file replication and clustering, database replication, monitoring, split brain prevention, site to site failovers, data integrity, security,… their ops list goes on. So having a platform that can orchestrate most of the operational management of the database environment can help operations teams bridge the knowledge gaps and deliver a stable and reliable environment to the business.
Having such a platform like Clustercontrol is crucial as it is the only hybrid database orchestration system that organizations can use to deploy and administer their open-source databases anywhere. It can help your business with a whole host of things including backup management, monitoring and alerting, deployment and scaling, upgrades and patches, security and compliance, operational reporting, configuration management, automatic recoveries & repairs, and performance management. If you’re looking for an all-in-one database orchestration system that allows you to deploy and monitor top open-source database technologies like MySQL, MariaDB, Percona, MongoDB, Redis, Microsoft SQL Server, Elasticsearch, PostgreSQL, Galera Cluster and more, give Clustercontrol a try.
Follow us on LinkedIn and Twitter for more great content in the coming weeks. Stay tuned!


