blog
What to Look for if Your MySQL Replication is Lagging

A master/slave replication cluster setup is a common use case in most organizations. Using MySQL Replication enables your data to be replicated across different environments and guarantees that the information gets copied. It is asynchronous and single-threaded (by default), but replication also allows you to configure it to be synchronous (or actually “semi-synchronous”) and can run slave thread to multiple threads or in parallels.
This idea is very common and usually arrives with a simple setup, making its slave serving as its recovery or for backup solutions. However, this always comes to a price especially when bad queries (such as lack of primary or unique keys) are replicated or some trouble with the hardware (such as network or disk IO issues). When these issues occur, the most common problem to face is the replication lag.
A replication lag is the cost of delay for transaction(s) or operation(s) calculated by its time difference of execution between the primary/master against the standby/slave node. The most certain cases in MySQL relies on bad queries being replicated such as lack of primary keys or bad indexes, a poor network hardware or malfunctioning network card, a distant location between different regions or zones, or some processes such as physical backups running can cause your MySQL database to delay applying the current replicated transaction. This is a very common case when diagnosing these issues. In this blog, we’ll check how to deal with these cases and what to look if you are experiencing MySQL replication lag.
The “SHOW SLAVE STATUS”: The MySQL DBA’s Mantra
In some cases, this is the silver bullet when dealing with replication lag and it reveals mostly everything the cause of an issue in your MySQL database. Simply run this SQL statement in your slave node that is suspected experiencing a replication lag.
The initial fields that are common to trace for problems are,
- Slave_IO_State – It tells you what the thread is doing. This field will provide you good insights if the replication health is running normally, facing network problems such as reconnecting to a master, or taking too much time to commit data which can indicate disk problems when syncing data to disk. You can also determine this state value when running SHOW PROCESSLIST.
- Master_Log_File – Master’s binlog file name where the I/O thread is currently fetch.
- Read_Master_Log_Pos – binlog file position from the master where the replication I/O thread has already read.
- Relay_Log_File – the relay log filename for which the SQL thread is currently executing the events
- Relay_Log_Pos – binlog position from the file specified in Relay_Log_File for which SQL thread has already executed.
- Relay_Master_Log_File – The master’s binlog file that the SQL thread has already executed and is a congruent to Read_Master_Log_Pos value.
- Seconds_Behind_Master – this field shows an approximation for difference between the current timestamp on the slave against the timestamp on the master for the event currently being processed on the slave. However, this field might not be able to tell you the exact lag if the network is slow because the difference in seconds are taken between the slave SQL thread and the slave I/O thread. So there can be cases that it can be caught up with slow-reading slave I/O thread, but i master it’s already different.
- Slave_SQL_Running_State – state of the SQL thread and the value is identical to the state value displayed in SHOW PROCESSLIST.
- Retrieved_Gtid_Set – Available when using GTID replication. This is the set of GTID’s corresponding to all transactions received by this slave.
- Executed_Gtid_Set – Available when using GTID replication. It’s the set of GTID’s written in the binary log.
For example, let’s take the example below which uses a GTID replication and is experiencing a replication lag:
mysql> show slave statusG

*************************** 1. row ***************************

               Slave_IO_State: Waiting for master to send event

                  Master_Host: 192.168.10.70

                  Master_User: cmon_replication

                  Master_Port: 3306

                Connect_Retry: 10

              Master_Log_File: binlog.000038

          Read_Master_Log_Pos: 826608419

               Relay_Log_File: relay-bin.000004

                Relay_Log_Pos: 468413927

        Relay_Master_Log_File: binlog.000038

             Slave_IO_Running: Yes

            Slave_SQL_Running: Yes

              Replicate_Do_DB:

          Replicate_Ignore_DB:

           Replicate_Do_Table:

       Replicate_Ignore_Table:

      Replicate_Wild_Do_Table:

  Replicate_Wild_Ignore_Table:

                   Last_Errno: 0

                   Last_Error:

                 Skip_Counter: 0

          Exec_Master_Log_Pos: 826608206

              Relay_Log_Space: 826607743

              Until_Condition: None

               Until_Log_File:

                Until_Log_Pos: 0

           Master_SSL_Allowed: No

           Master_SSL_CA_File:

           Master_SSL_CA_Path:

              Master_SSL_Cert:

            Master_SSL_Cipher:

               Master_SSL_Key:

        Seconds_Behind_Master: 251

Master_SSL_Verify_Server_Cert: No

                Last_IO_Errno: 0

                Last_IO_Error:

               Last_SQL_Errno: 0

               Last_SQL_Error:

  Replicate_Ignore_Server_Ids:

             Master_Server_Id: 45003

                  Master_UUID: 36272880-a7b0-11e9-9ca6-525400cae48b

             Master_Info_File: mysql.slave_master_info

                    SQL_Delay: 0

          SQL_Remaining_Delay: NULL

      Slave_SQL_Running_State: copy to tmp table

           Master_Retry_Count: 86400

                  Master_Bind:

      Last_IO_Error_Timestamp:

     Last_SQL_Error_Timestamp:

               Master_SSL_Crl:

           Master_SSL_Crlpath:

           Retrieved_Gtid_Set: 36272880-a7b0-11e9-9ca6-525400cae48b:7631-9192

            Executed_Gtid_Set: 36272880-a7b0-11e9-9ca6-525400cae48b:1-9191,

864dd532-a7af-11e9-85f2-525400cae48b:1-173,

df68c807-a7af-11e9-9b56-525400cae48b:1-4

                Auto_Position: 1

         Replicate_Rewrite_DB:

                 Channel_Name:

           Master_TLS_Version:

1 row in set (0.00 sec)
Diagnosing issues like this, mysqlbinlog can also be your tool to identify what query has been running on a specific binlog x & y position. To determine this, let’s take the Retrieved_Gtid_Set, Relay_Log_Pos, and the Relay_Log_File. See the command below:
[root@testnode5 mysql]# mysqlbinlog --base64-output=DECODE-ROWS --include-gtids="36272880-a7b0-11e9-9ca6-525400cae48b:9192" --start-position=468413927 -vvv relay-bin.000004

/*!50530 SET @@SESSION.PSEUDO_SLAVE_MODE=1*/;

/*!50003 SET @OLD_COMPLETION_TYPE=@@COMPLETION_TYPE,COMPLETION_TYPE=0*/;

DELIMITER /*!*/;

# at 468413927

#200206  4:36:14 server id 45003  end_log_pos 826608271 CRC32 0xc702eb4c        GTID last_committed=1562 sequence_number=1563    rbr_only=no

SET @@SESSION.GTID_NEXT= '36272880-a7b0-11e9-9ca6-525400cae48b:9192'/*!*/;

# at 468413992

#200206  4:36:14 server id 45003  end_log_pos 826608419 CRC32 0xe041ec2c        Query thread_id=24 exec_time=31 error_code=0

use `jbmrcd_date`/*!*/;

SET TIMESTAMP=1580963774/*!*/;

SET @@session.pseudo_thread_id=24/*!*/;

SET @@session.foreign_key_checks=1, @@session.sql_auto_is_null=0, @@session.unique_checks=1, @@session.autocommit=1/*!*/;

SET @@session.sql_mode=1436549152/*!*/;

SET @@session.auto_increment_increment=1, @@session.auto_increment_offset=1/*!*/;

/*!C utf8 *//*!*/;

SET @@session.character_set_client=33,@@session.collation_connection=33,@@session.collation_server=8/*!*/;

SET @@session.lc_time_names=0/*!*/;

SET @@session.collation_database=DEFAULT/*!*/;

ALTER TABLE NewAddressCode ADD INDEX PostalCode(PostalCode)

/*!*/;

SET @@SESSION.GTID_NEXT= 'AUTOMATIC' /* added by mysqlbinlog */ /*!*/;

DELIMITER ;

# End of log file

/*!50003 SET COMPLETION_TYPE=@OLD_COMPLETION_TYPE*/;

/*!50530 SET @@SESSION.PSEUDO_SLAVE_MODE=0*/;
It tells us that it was trying to replicate and execute a DML statement which tries to be the source of the lag. This table is a huge table containing 13M of rows.
Check SHOW PROCESSLIST, SHOW ENGINE INNODB STATUS, with ps, top, iostat command combination
In some cases, SHOW SLAVE STATUS is not enough to tell us the culprit. It’s possible that the replicated statements are affected by internal processes running in the MySQL database slave. Running the statements SHOW [FULL] PROCESSLIST and SHOW ENGINE INNODB STATUS also provides informative data that gives you insights about the source of the problem.
For example, let’s say a benchmarking tool is running causing to saturate the disk IO and CPU. You can check by running both SQL statements. Combine it with ps and top commands.
You can also determine bottlenecks with your disk storage by running iostat which provides statistics of the current volume you are trying to diagnose. Running iostat can show how busy or loaded your server is. For example, taken by a slave which is lagging but also experiencing high IO utilization at the same time,
[root@testnode5 ~]# iostat -d -x 10 10

Linux 3.10.0-693.5.2.el7.x86_64 (testnode5)     02/06/2020 _x86_64_ (2 CPU)


Device:         rrqm/s wrqm/s     r/s w/s rkB/s    wkB/s avgrq-sz avgqu-sz   await r_await w_await svctm  %util

sda               0.00 0.42 3.71   60.65 218.92 568.39   24.47 0.15 2.31 13.79    1.61 0.12 0.76

dm-0              0.00 0.00 3.70   60.48 218.73 568.33   24.53 0.15 2.36 13.85    1.66 0.12 0.76

dm-1              0.00 0.00 0.00    0.00 0.04 0.01 21.92     0.00 63.29 2.37 96.59 22.64   0.01


Device:         rrqm/s wrqm/s     r/s w/s rkB/s    wkB/s avgrq-sz avgqu-sz   await r_await w_await svctm  %util

sda               0.00 0.20 392.30 7983.60  2135.60 49801.55 12.40 36.70    3.84 13.01 3.39 0.08 69.02

dm-0              0.00 0.00 392.30 7950.20  2135.60 50655.15 12.66 36.93    3.87 13.05 3.42 0.08 69.34

dm-1              0.00 0.00 0.00    0.30 0.00 1.20   8.00 0.06 183.67 0.00  183.67 61.67 1.85


Device:         rrqm/s wrqm/s     r/s w/s rkB/s    wkB/s avgrq-sz avgqu-sz   await r_await w_await svctm  %util

sda               0.00 1.40 370.93 6775.42  2557.04 46184.22 13.64 43.43    6.12 11.60 5.82 0.10 73.25

dm-0              0.00 0.00 370.93 6738.76  2557.04 47029.62 13.95 43.77    6.20 11.64 5.90 0.10 73.41

dm-1              0.00 0.00 0.00    0.30 0.00 1.20   8.00 0.03 107.00 0.00  107.00 35.67 1.07


Device:         rrqm/s wrqm/s     r/s w/s rkB/s    wkB/s avgrq-sz avgqu-sz   await r_await w_await svctm  %util

sda               0.00 0.00 299.80 7253.35  1916.88 52766.38 14.48 30.44    4.59 15.62 4.14 0.10 72.09

dm-0              0.00 0.00 299.80 7198.60  1916.88 51064.24 14.13 30.68    4.66 15.70 4.20 0.10 72.57

dm-1              0.00 0.00 0.00    0.00 0.00 0.00   0.00 0.00 0.00 0.00    0.00 0.00 0.00


Device:         rrqm/s wrqm/s     r/s w/s rkB/s    wkB/s avgrq-sz avgqu-sz   await r_await w_await svctm  %util

sda               0.00 0.10 215.50 8939.60  1027.60 67497.10 14.97 59.65    6.52 27.98 6.00 0.08 72.50

dm-0              0.00 0.00 215.50 8889.20  1027.60 67495.90 15.05 60.07    6.60 28.09 6.08 0.08 72.75

dm-1              0.00 0.00 0.00    0.30 0.00 1.20   8.00 0.01 32.33 0.00   32.33 30.33 0.91


Device:         rrqm/s wrqm/s     r/s w/s rkB/s    wkB/s avgrq-sz avgqu-sz   await r_await w_await svctm  %util

sda               0.00 0.90 140.40 8922.10   625.20 54709.80 12.21 11.29    1.25 9.88 1.11 0.08 68.60

dm-0              0.00 0.00 140.40 8871.50   625.20 54708.60 12.28 11.39    1.26 9.92 1.13 0.08 68.83

dm-1              0.00 0.00 0.00    0.30 0.00 1.20   8.00 0.01 27.33 0.00   27.33 9.33 0.28


Device:         rrqm/s wrqm/s     r/s w/s rkB/s    wkB/s avgrq-sz avgqu-sz   await r_await w_await svctm  %util

sda               0.00 1.70 284.50 8621.30 24228.40 51535.75    17.01 34.14 3.27 8.19 3.11 0.08 72.78

dm-0              0.00 0.00 290.90 8587.10 25047.60 53434.95    17.68 34.28 3.29 8.02 3.13 0.08 73.47

dm-1              0.00 0.00 0.00    2.00 0.00 8.00   8.00 0.83 416.45 0.00  416.45 63.60 12.72


Device:         rrqm/s wrqm/s     r/s w/s rkB/s    wkB/s avgrq-sz avgqu-sz   await r_await w_await svctm  %util

sda               0.00 0.30 851.60 11018.80 17723.60 85165.90    17.34 142.59 12.44 7.61 12.81 0.08 99.75

dm-0              0.00 0.00 845.20 10938.90 16904.40 83258.70    17.00 143.44 12.61 7.67 12.99 0.08 99.75

dm-1              0.00 0.00 0.00    0.00 0.00 0.00   0.00 0.00 0.00 0.00    0.00 0.00 0.00


Device:         rrqm/s wrqm/s     r/s w/s rkB/s    wkB/s avgrq-sz avgqu-sz   await r_await w_await svctm  %util

sda               0.00 1.10 24.60 12965.40   420.80 51114.45 7.93 39.44    3.04 0.33 3.04 0.07 93.39

dm-0              0.00 0.00 24.60 12890.20   420.80 51114.45 7.98 40.23    3.12 0.33 3.12 0.07 93.35

dm-1              0.00 0.00 0.00    0.00 0.00 0.00   0.00 0.00 0.00 0.00    0.00 0.00 0.00


Device:         rrqm/s wrqm/s     r/s w/s rkB/s    wkB/s avgrq-sz avgqu-sz   await r_await w_await svctm  %util

sda               0.00 0.00 3.60 13420.70    57.60 51942.00 7.75 0.95   0.07 0.33 0.07 0.07 92.11

dm-0              0.00 0.00 3.60 13341.10    57.60 51942.00 7.79 0.95   0.07 0.33 0.07 0.07 92.08

dm-1              0.00 0.00 0.00    0.00 0.00 0.00   0.00 0.00 0.00 0.00    0.00 0.00 0.00
The result above displays the high IO utilization and a high writes. It also reveals that the average queue size and average request size are moving which means it’s an indication of a high workload. In these cases, you need to determine if there are external processes that cause MySQL to choke the replication threads.
How Can ClusterControl Help?
With ClusterControl, dealing with slave lag and determining the culprit is very easy and efficient. It directly tells you in the web UI, see below:
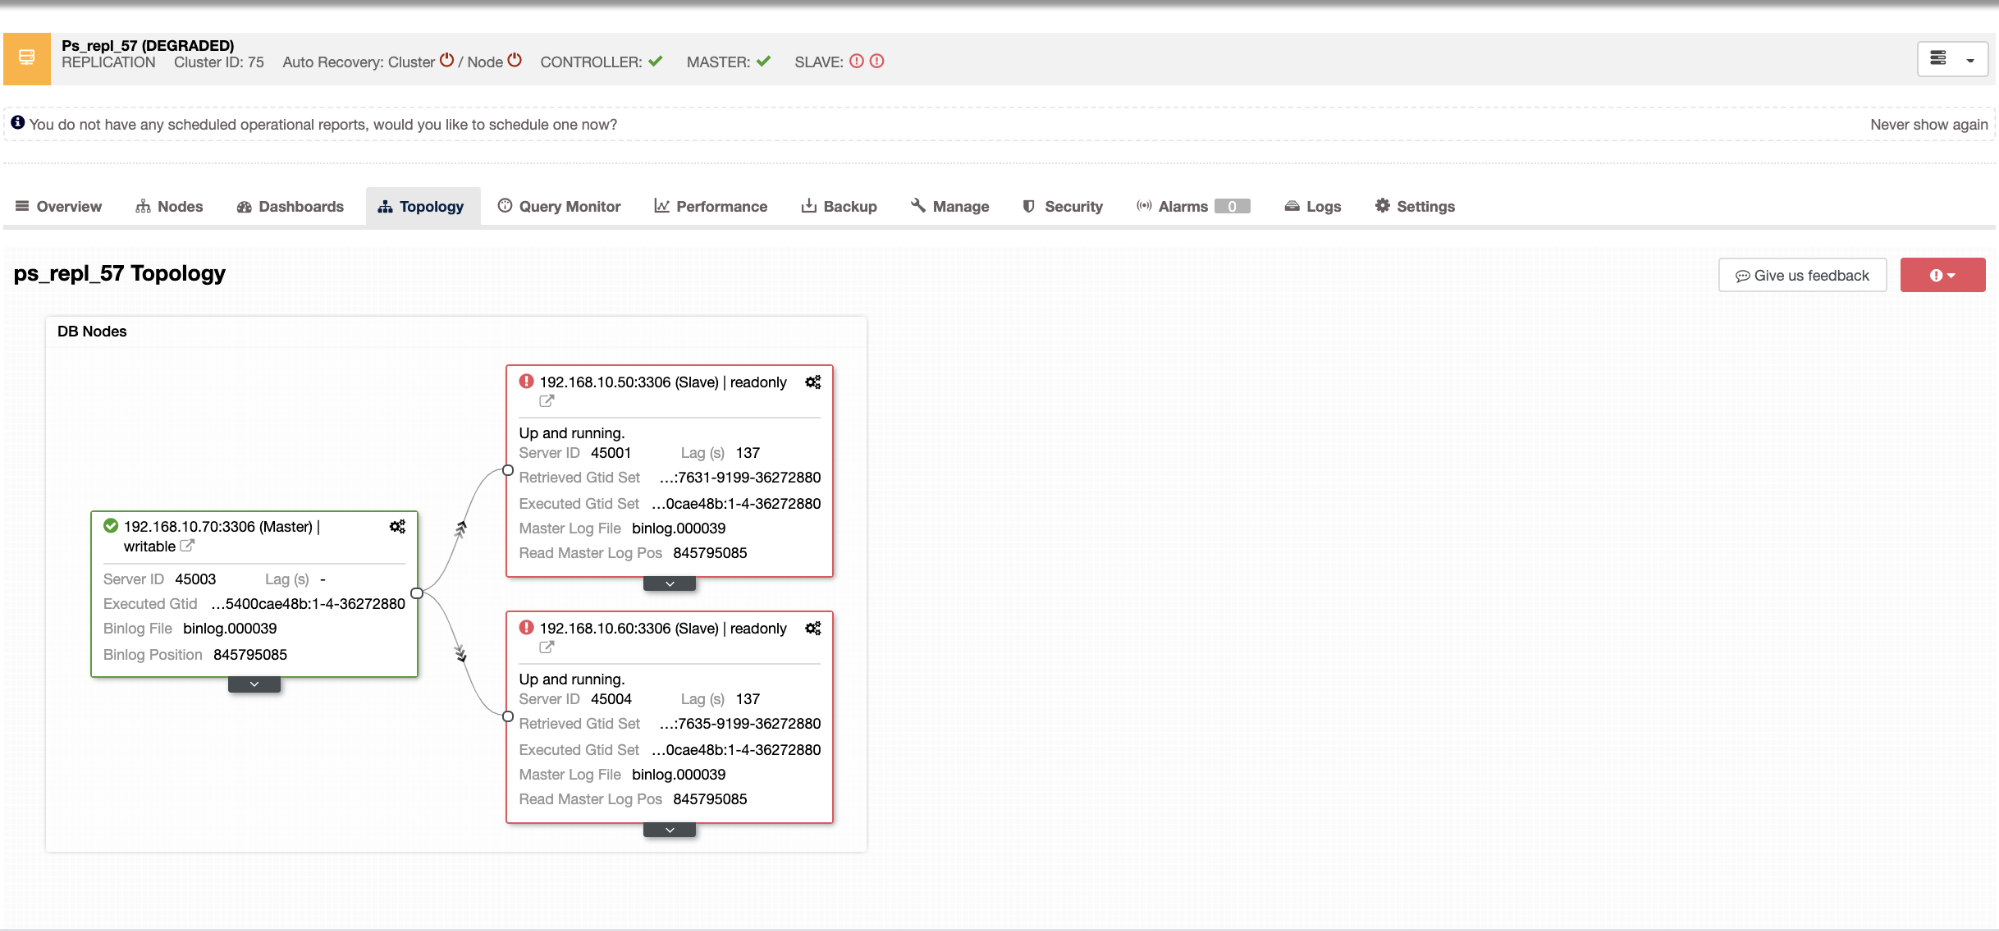
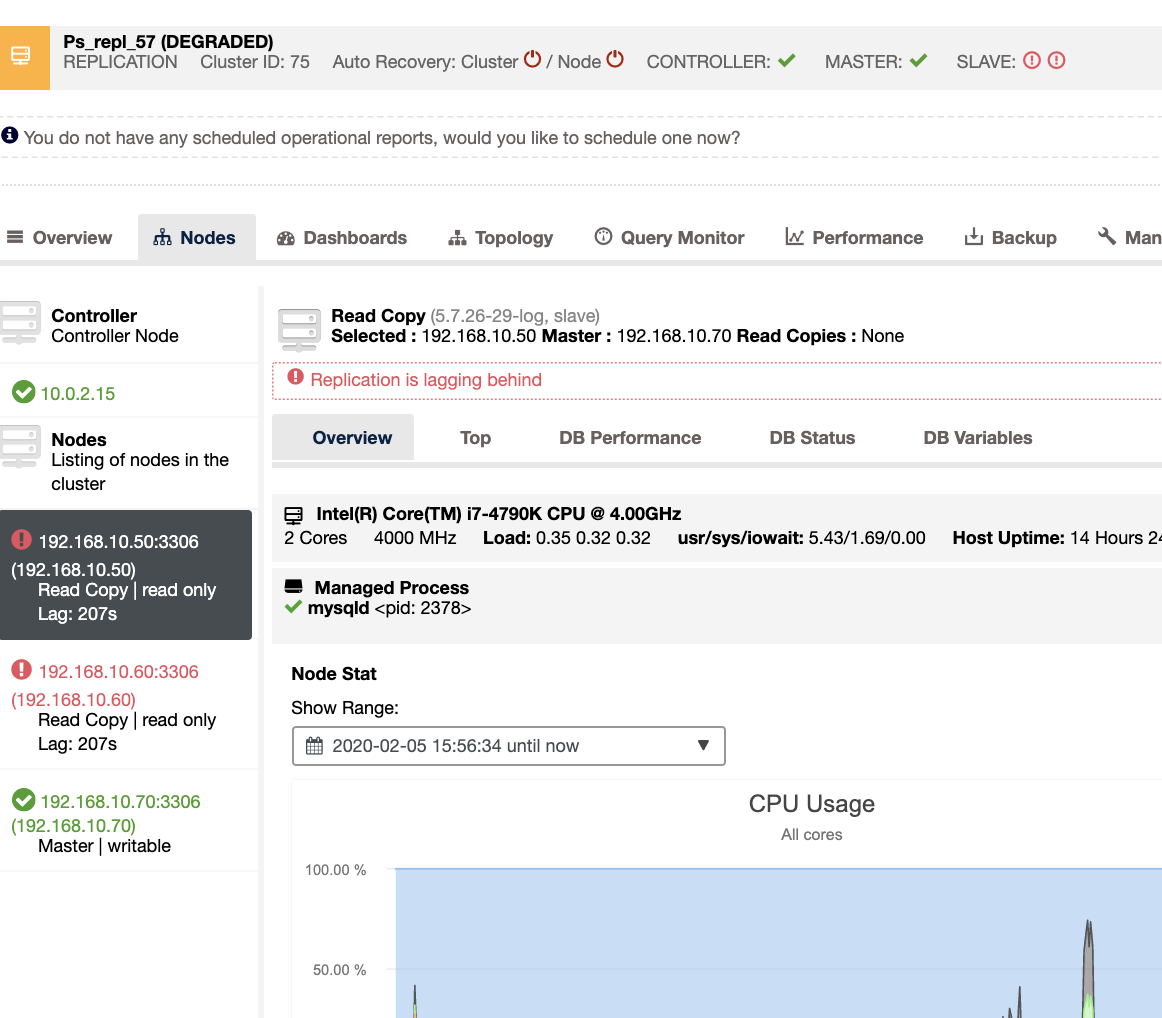
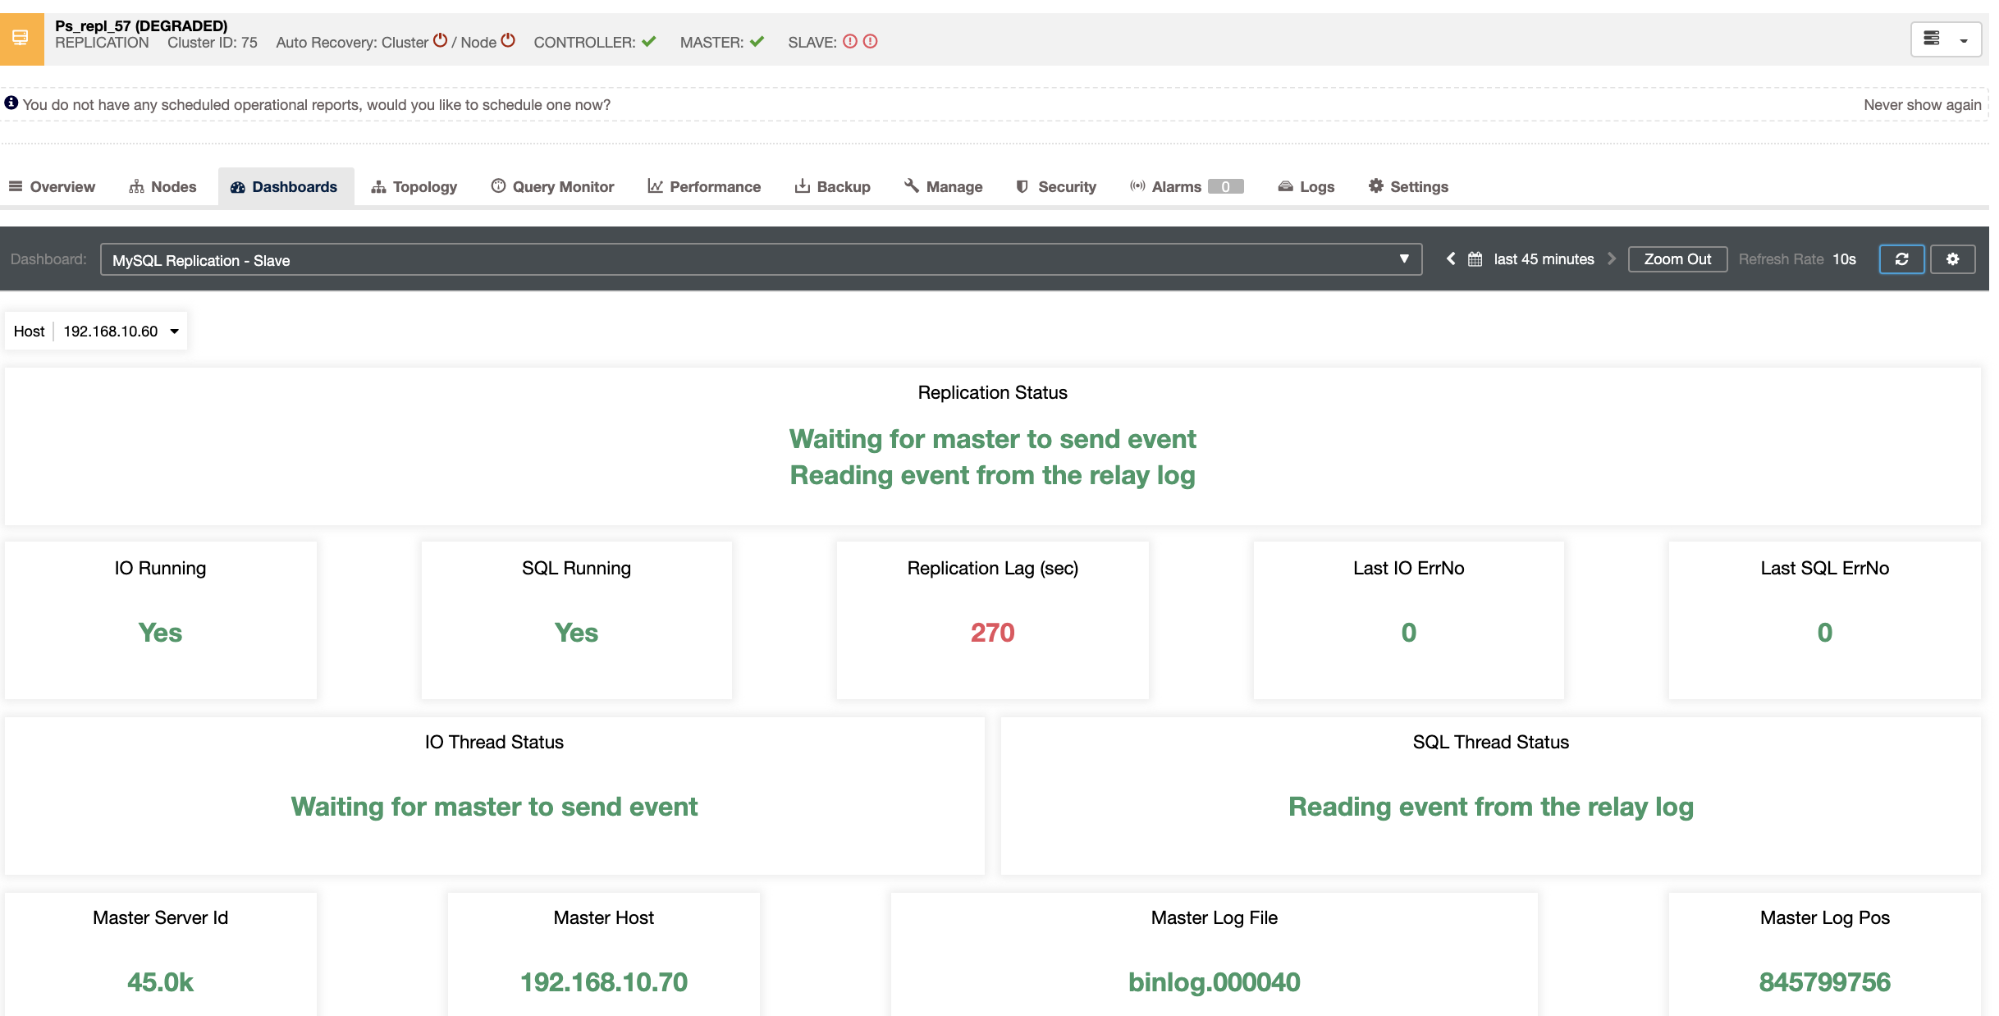
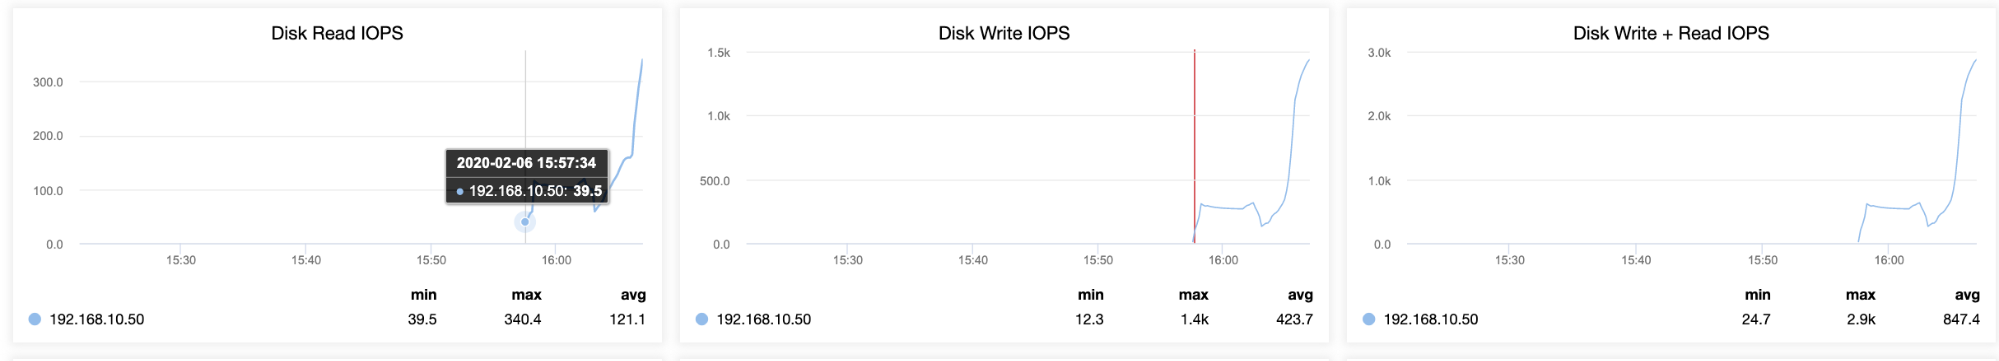
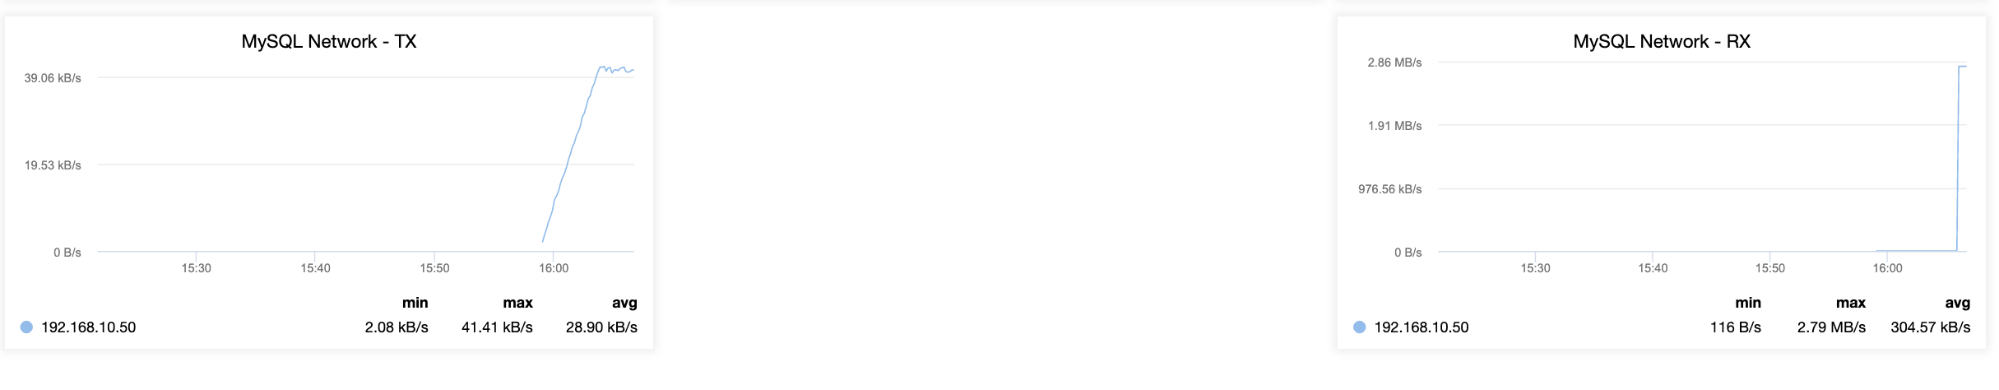
It reveals to you the current slave lag your slave nodes are experiencing. Not only that, with SCUMM dashboards, if enabled, provides you more insights of what your slave node’s health or even the whole cluster is doing:
Not only that these things are available in ClusterControl, it does provide you also the capability to avoid bad queries from occurring with these features as seen below,
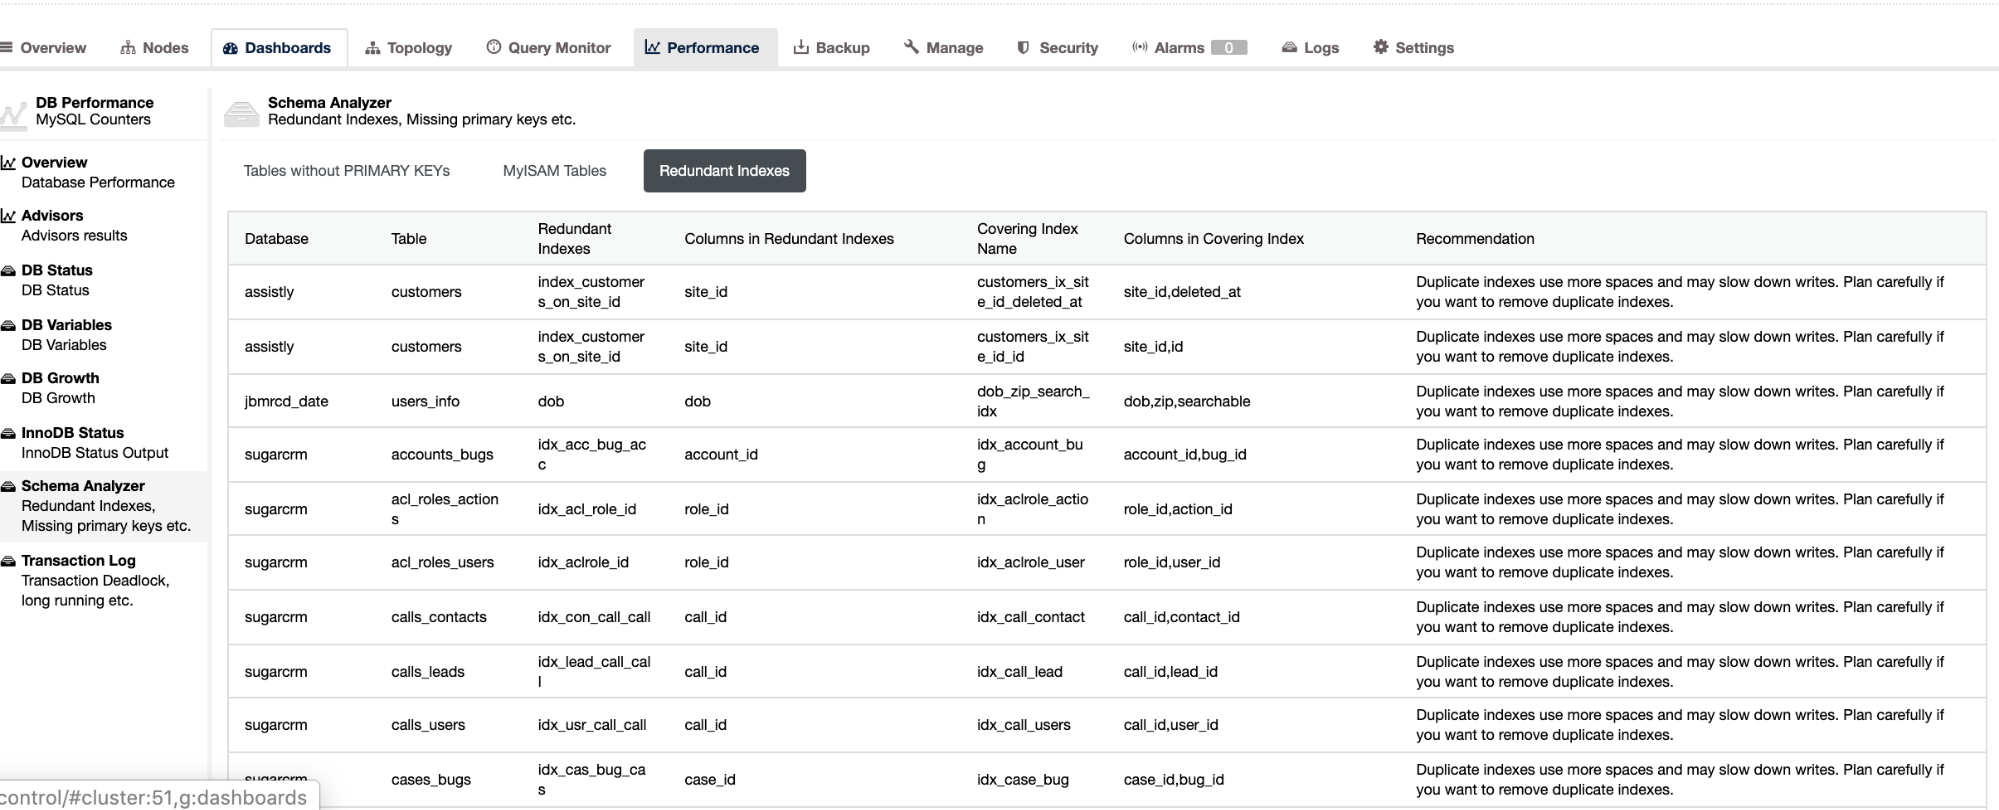
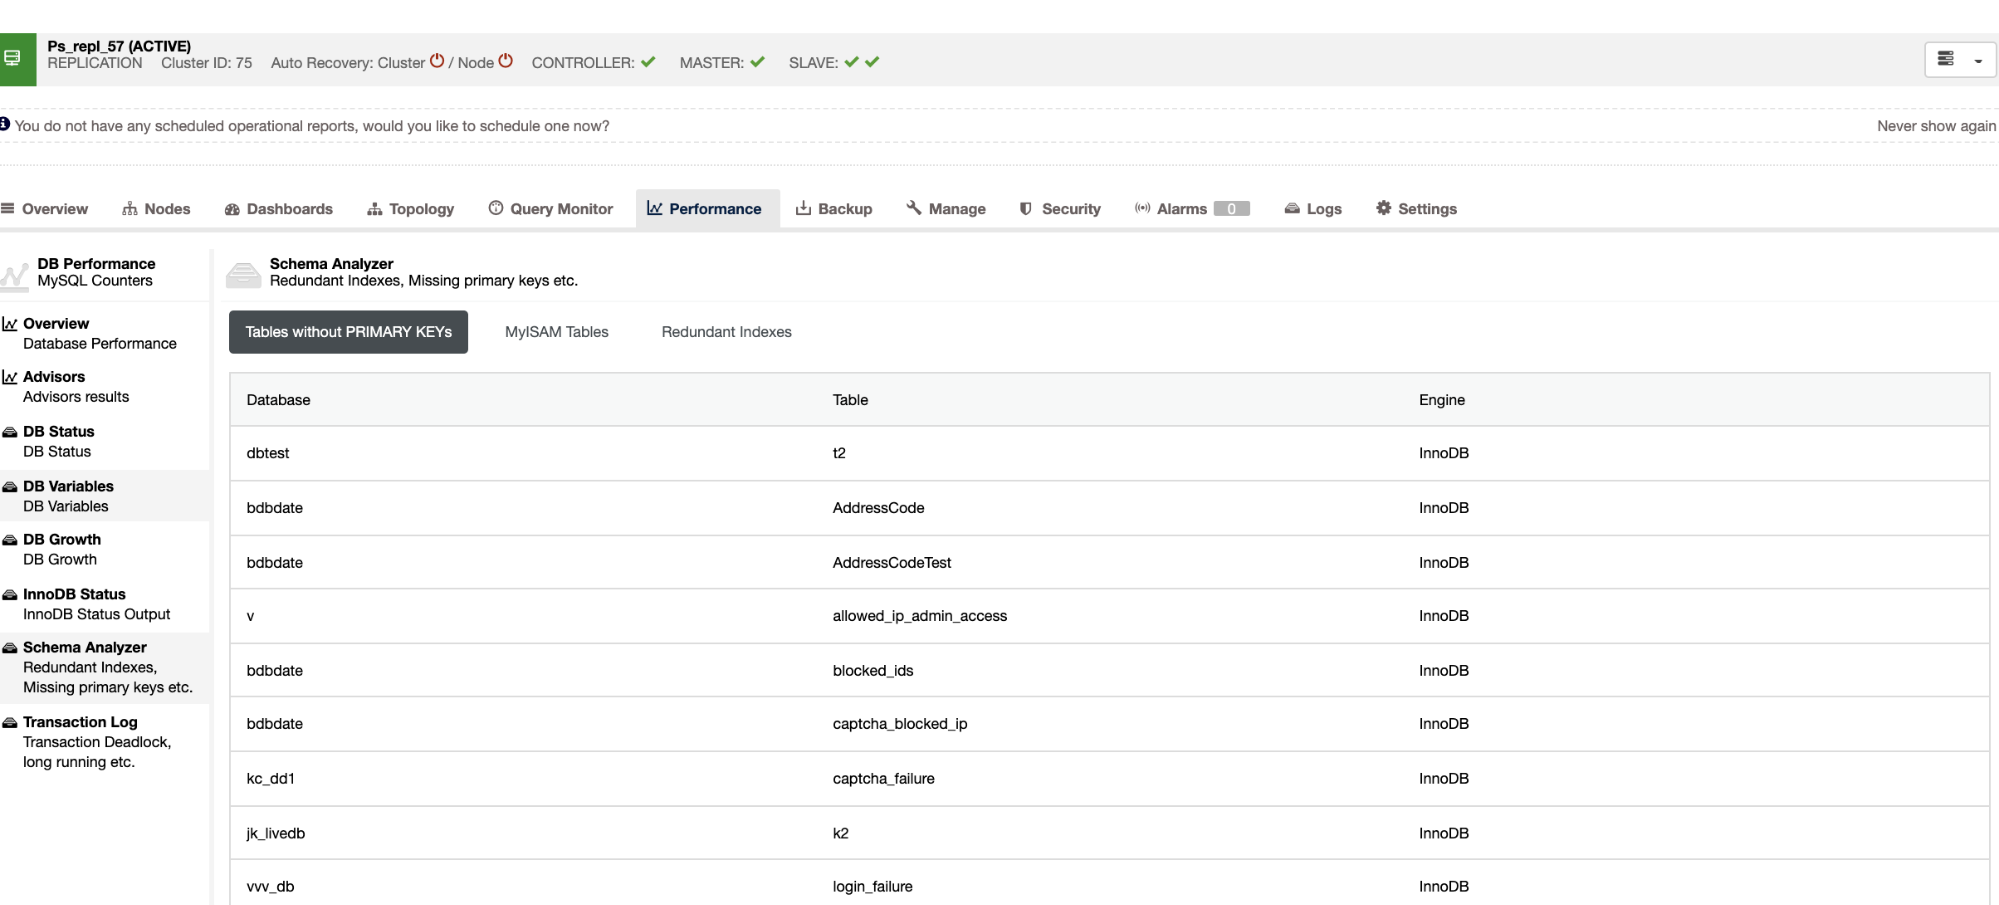
The redundant indexes allows you to determine that these indexes can cause performance issues for incoming queries that references the duplicate indexes. It also tells you tables that have no Primary Keys which are usually a common problem of slave lag when a certain SQL query or transactions that references big tables without primary or unique keys when it’s replicated to the slaves.
Conclusion
Dealing with MySQL Replication lag is a frequent problem in a master-slave replication setup. It can be easy to diagnose, but difficult to solve. Make sure you have your tables with primary key or unique key existing, and determine the steps and tools on how to troubleshoot and diagnose the cause of slave lag. Efficiency is always the key when solving problems though.


