blog
Tips for Delivering MySQL Database Performance – Part Two

The management of database performance is an area that businesses when administrators often find themselves contributing more time to than they expected.
Monitoring and reacting to the production database performance issues is one of the most critical tasks within a database administrator job. It is an ongoing process that requires constant care. Application and underlying databases usually evolve with time; grow in size, number of users, workload, schema changes that come with code changes.
Long-running queries are seldom inevitable in a MySQL database. In some circumstances, a long-running query may be a harmful event. If you care about your database, optimizing query performance, and detecting long-running queries must be performed regularly.
In this blog, we are going to take a more in-depth look at the actual database workload, especially on the running queries side. We will check how to track queries, what kind of information we can find in MySQL metadata, what tools to use to analyze such queries.
Handling The Long-Running Queries
Let’s start with checking Long-running queries. First of all, we have to know the nature of the query, whether it is expected to be a long-running or a short running query. Some analytic and batch operations are supposed to be long-running queries, so we can skip those for now. Also, depending on the table size, modifying table structure with ALTER command can be a long-running operation (especially in MySQL Galera Clusters).
- Table lock – The table is locked by a global lock or explicit table lock when the query is trying to access it.
- Inefficient query – Use non-indexed columns while lookup or joining, thus MySQL takes a longer time to match the condition.
- Deadlock – A query is waiting to access the same rows that are locked by another request.
- Dataset does not fit into RAM – If your working set data fits into that cache, then SELECT queries will usually be relatively fast.
- Suboptimal hardware resources – This could be slow disks, RAID rebuilding, saturated network, etc.
If you see a query takes longer than usual to execute, do investigate it.
Using the MySQL Show Process List
MYSQL> SHOW PROCESSLIST;This is usually the first thing you run in the case of performance issues. SHOW PROCESSLIST is an internal mysql command which shows you which threads are running. You can also see this information from the information_schema.PROCESSLIST table or the mysqladmin process list command. If you have the PROCESS privilege, you can see all threads. You can see information like Query Id, execution time, who runs it, the client host, etc. The information with slightly wary depending on the MySQL flavor and distribution (Oracle, MariaDB, Percona)
SHOW PROCESSLIST;

+----+-----------------+-----------+------+---------+------+------------------------+------------------+----------+

| Id | User            | Host | db | Command | Time | State                  | Info | Progress |

+----+-----------------+-----------+------+---------+------+------------------------+------------------+----------+

|  2 | event_scheduler | localhost | NULL | Daemon  | 2693 | Waiting on empty queue | NULL   | 0.000 |

|  4 | root            | localhost | NULL | Query   | 0 | Table lock   | SHOW PROCESSLIST | 0.000 |

+----+-----------------+-----------+------+---------+------+------------------------+------------------+----------+
we can immediately see the offensive query right away from the output. In the above example that could be a Table lock. But how often do we stare at those processes? This is only useful if you are aware of the long-running transaction. Otherwise, you wouldn’t know until something happens – like connections are piling up, or the server is getting slower than usual.
Using MySQL Pt-query-digest
If you would like to see more information about a particular workload use pt-query-digest. The pt-query-digest is a Linux tool from Percona to analyze MySQL queries. It’s part of the Percona Toolkit which you can find here. It supports the most popular 64 bit Linux distributions like Debian, Ubuntu, and Redhat.
To install it you must configure Percona repositories and then install the perona-toolkit package.
Install Percona Toolkit using your package manager:
Debian or Ubuntu:
sudo apt-get install percona-toolkitRHEL or CentOS:
sudo yum install percona-toolkitPt-query-digest accepts data from the process list, general log, binary log, slow log or tcpdump In addition to that, it’s possible to poll the MySQL process list at a defined interval – a process that can be resource-intensive and far from ideal, but can still be used as an alternative.
The most common source for pt-query-digest is a slow query log. You can control how much data will go there with parameter log_slow_verbosity.
There are a number of things that may cause a query to take a longer time to execute:
- microtime – queries with microsecond precision.
- query_plan – information about the query’s execution plan.
- innodb – InnoDB statistics.
- minimal – Equivalent to enabling just microtime.
- standard – Equivalent to enabling microtime,innodb.
- full – Equivalent to all other values OR’ed together without the profiling and profiling_use_getrusage options.
- profiling – Enables profiling of all queries in all connections.
- profiling_use_getrusage – Enables usage of the getrusage function.
source: Percona documentation
For completeness use log_slow_verbosity=full which is a common case.
Slow Query Log
The slow query log can be used to find queries that take a long time to execute and are therefore candidates for optimization. Slow query log captures slow queries (SQL statements that take more than long_query_time seconds to execute), or queries that do not use indexes for lookups (log_queries_not_using_indexes). This feature is not enabled by default and to enable it simply set the following lines and restart the MySQL server:
[mysqld]
slow_query_log=1
log_queries_not_using_indexes=1
long_query_time=0.1
The slow query log can be used to find queries that take a long time to execute and are therefore candidates for optimization. However, examining a long slow query log can be a time-consuming task. There are tools to parse MySQL slow query log files and summarize their contents like mysqldumpslow, pt-query-digest.
Performance Schema
Performance Schema is a great tool available for monitoring MySQL Server internals and execution details at a lower level. It had a bad reputation in an early version (5.6) because enabling it often caused performance issues, however the recent versions do not harm performance. The following tables in Performance Schema can be used to find slow queries:
- events_statements_current
- events_statements_history
- events_statements_history_long
- events_statements_summary_by_digest
- events_statements_summary_by_user_by_event_name
- events_statements_summary_by_host_by_event_name
MySQL 5.7.7 and higher include the sys schema, a set of objects that helps DBAs and developers interpret data collected by the Performance Schema into a more easily understandable form. Sys schema objects can be used for typical tuning and diagnosis use cases.
Network tracking
What if we don’t have access to the query log or direct application logs. In that case, we could use a combination of tcpdump and pt-query digest which could help to capture queries.
$ tcpdump -s 65535 -x -nn -q -tttt -i any port 3306 > mysql.tcp.txtOnce the capture process ends, we can proceed with processing the data:
$ pt-query-digest --limit=100% --type tcpdump mysql.tcp.txt > ptqd_tcp.outClusterControl Query Monitor
ClusterControl Query Monitor is a module in a cluster control that provides combined information about database activity. It can gather information from multiple sources like show process list or slow query log and present it in a pre-aggregated way.
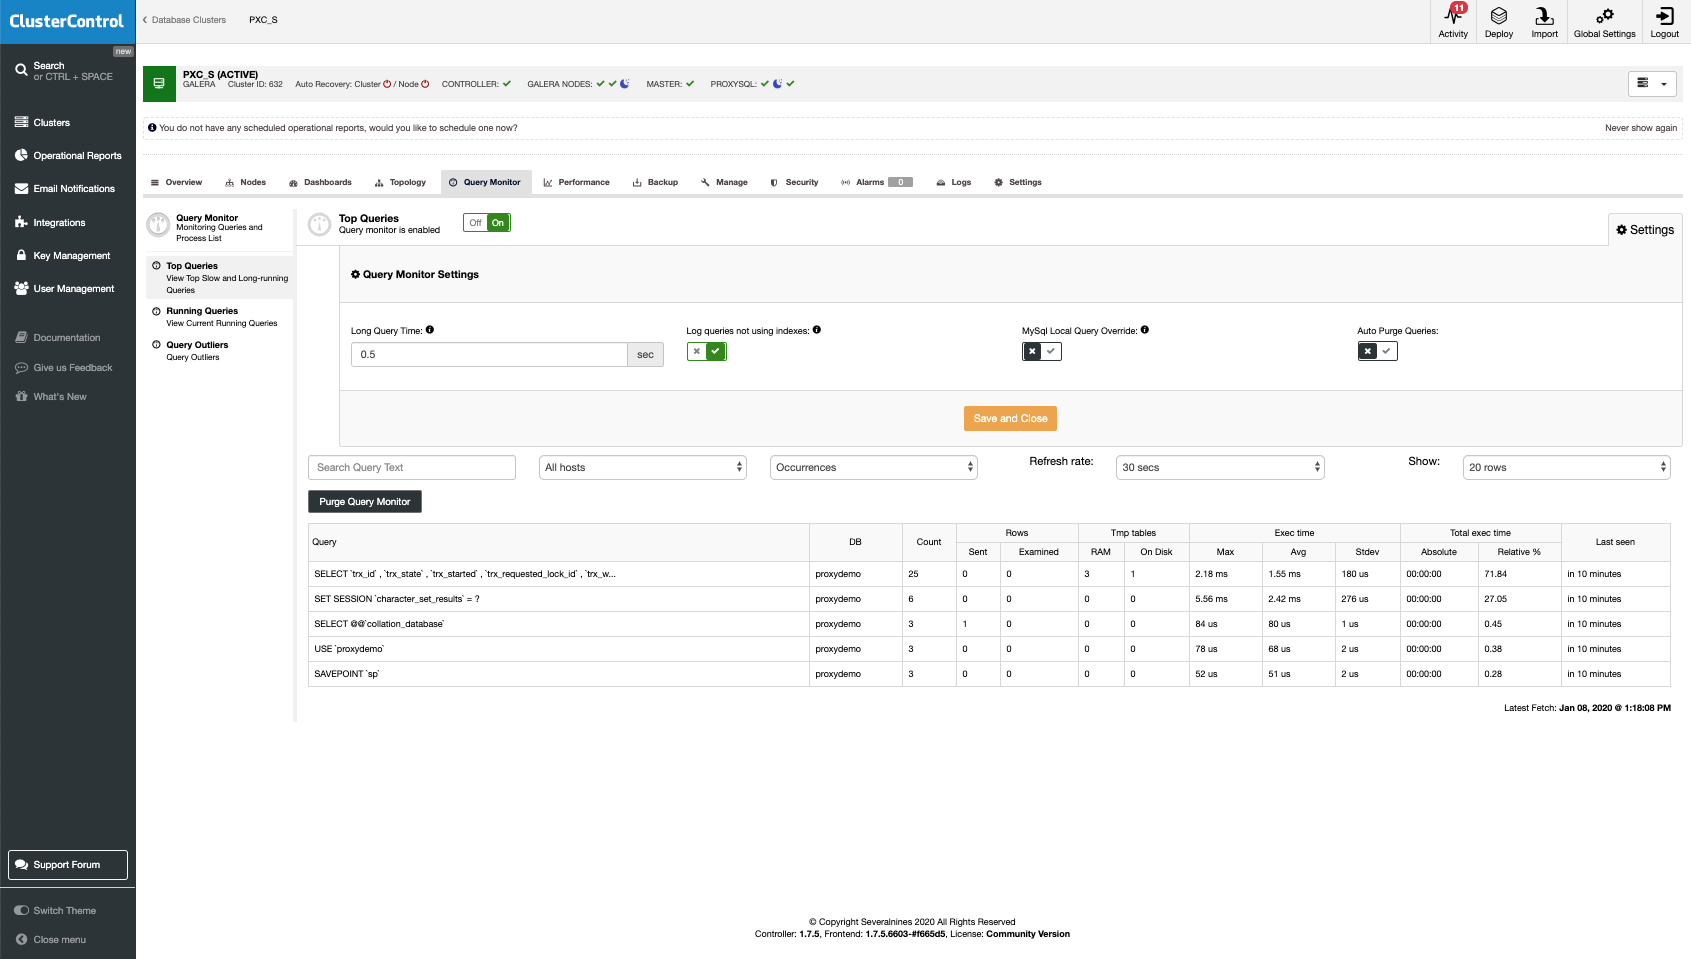
The SQL Monitoring is divided into three sections.
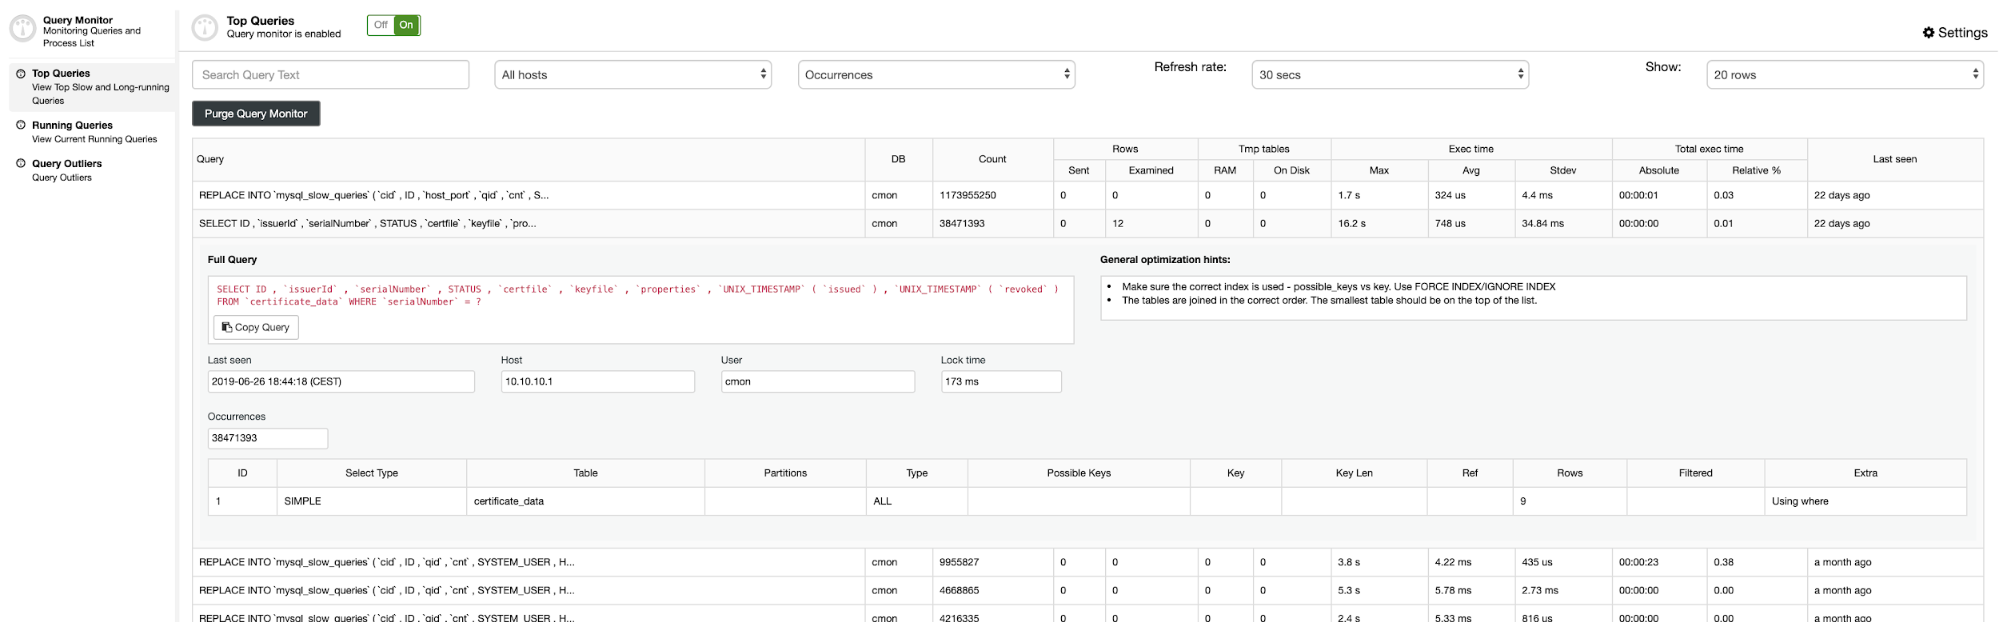
Top Queries
presents the information about queries that take a significant chunk of resources.
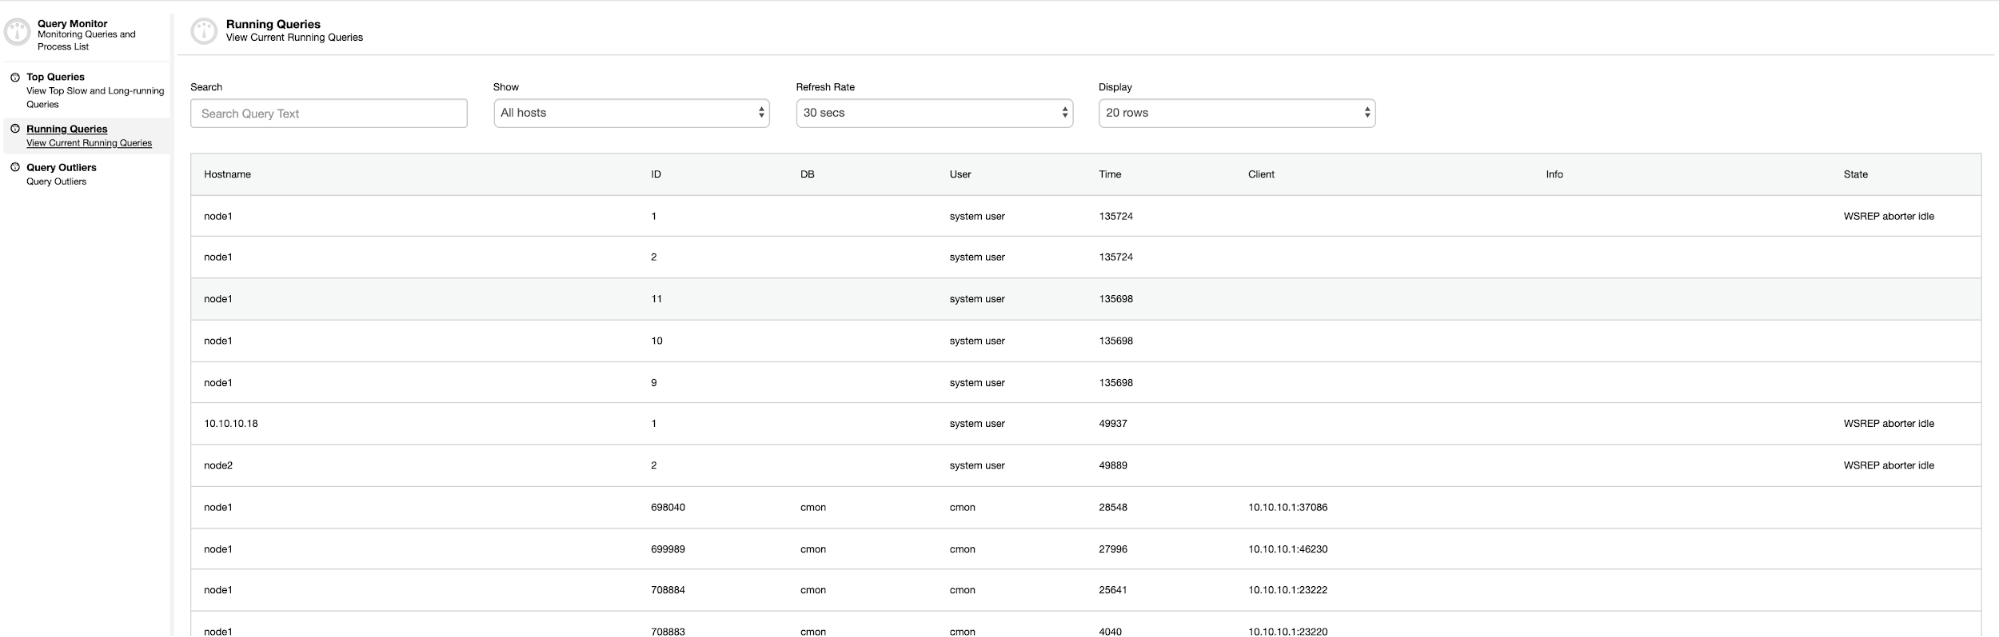
Running Queries
it’s a process list of information combined from all database cluster nodes into one view. You can use that to kill queries that affect your database operations.
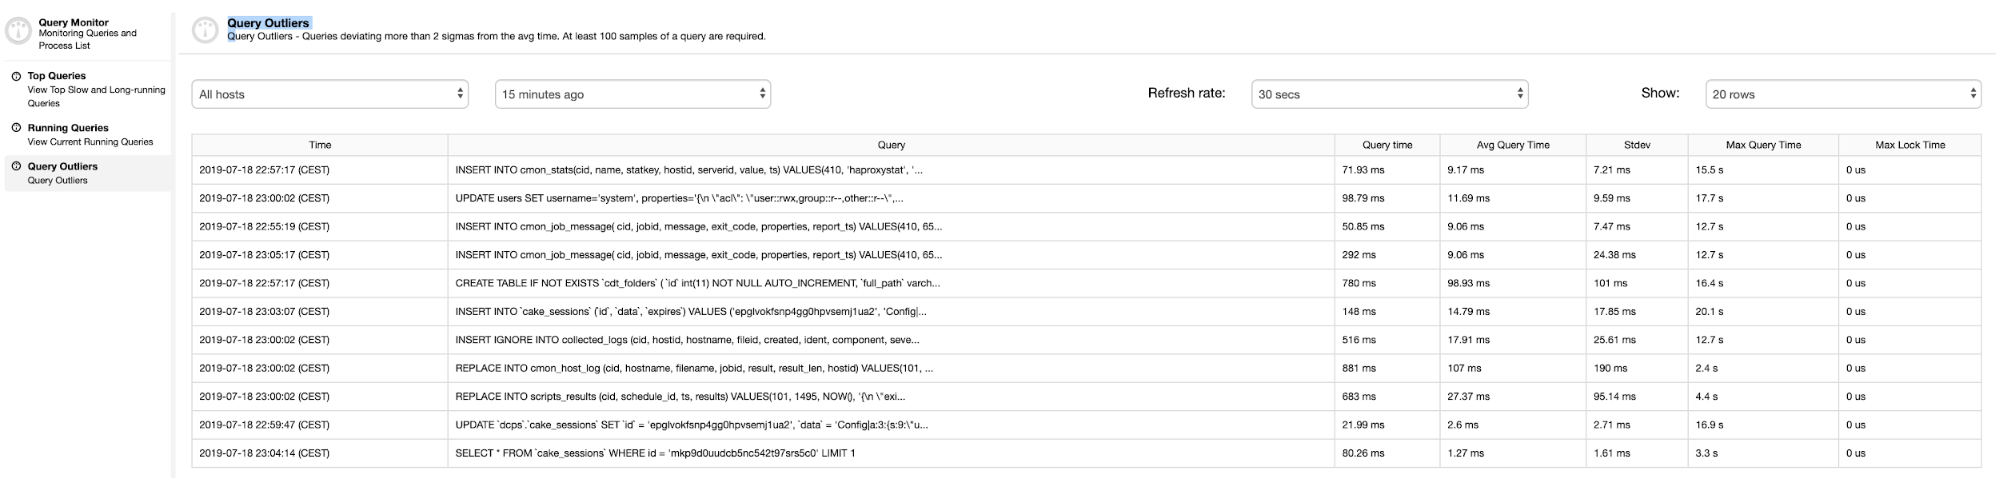
Query Outliers
present the list of queries with execution time longer than average.
Conclusion
This is all for part two. This blog is not intended to be an exhaustive guide to how to enhance database performance, but it hopefully gives a clearer picture of what things can become essential and some of the basic parameters that can be configured. Do not hesitate to let us know if we’ve missed any important ones in the comments below.