blog
pgDash Diagnostics Alternatives – PostgreSQL Query Management with ClusterControl

Databases are all about queries. You store your data in them and then you have to be able to retrieve it in some way. Here come queries – you write them in some language, structured or not, in that way you define what data you want to retrieve. Ideally, those queries would be fast, after all we don’t want to wait for our data. There are many tools that let you understand how your queries behave and how they perform. In this blog post we will compare pgDash and ClusterControl. In both cases query performance is just a part of the functionality. Without further due let’s take a look at them.
What is pgDash?
pgDash is a tool dedicated to monitoring PostgreSQL and monitoring of the query performance is one of the available functionalities.
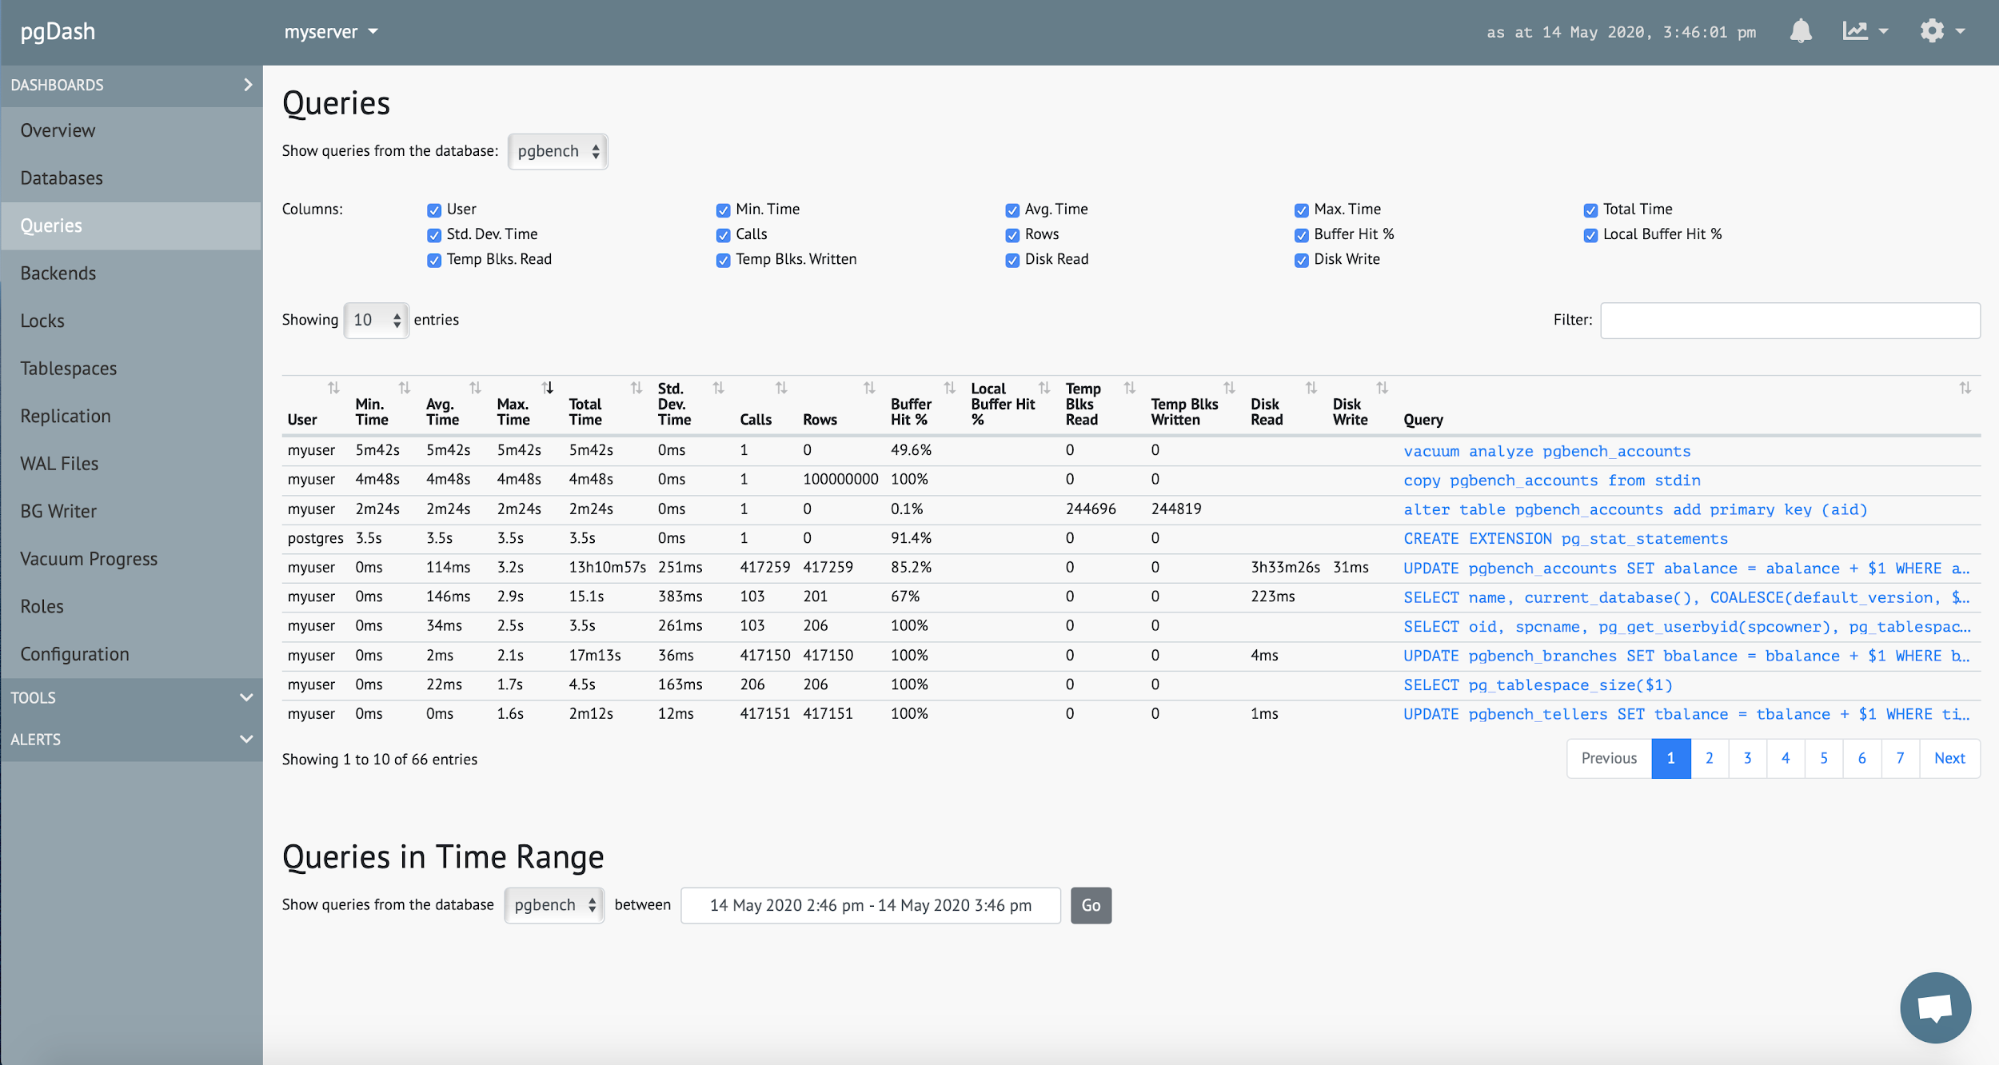
pgDash requires pg_stat_statements to get the data. It is possible to show queries on a per database basis. You can define which columns should be visible (by default some of them are not shown, to make the data easier to read). You can see multiple types of data like execution time (average, max, min, total) but also information about temporary blocks, rows accessed, disk access and buffer hit. This creates a nice insight into how a given query performs and what could be the reason why it does not perform in an efficient way. You can sort the data using any column looking for queries that, for example, are the slowest ones or which write the most temporary blocks.
If needed, you can look up queries executed in a defined time window.
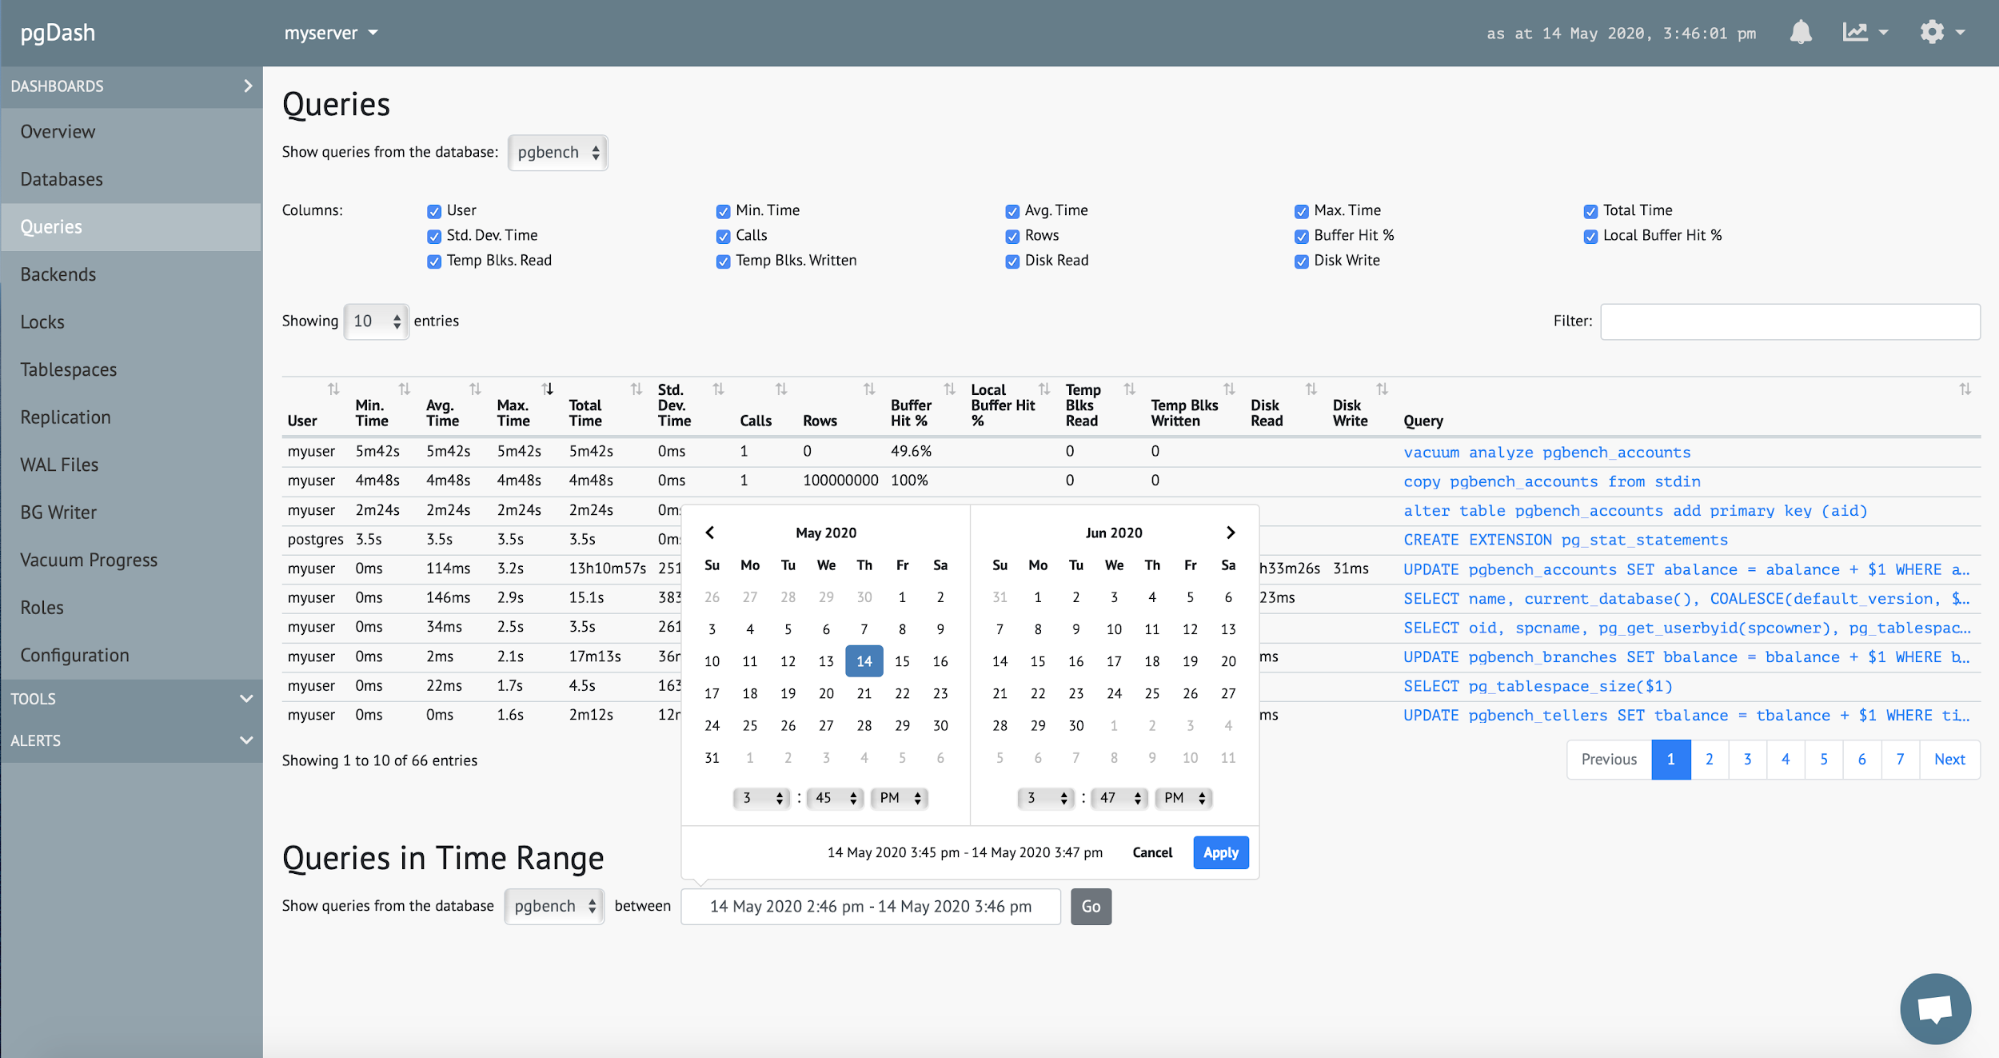
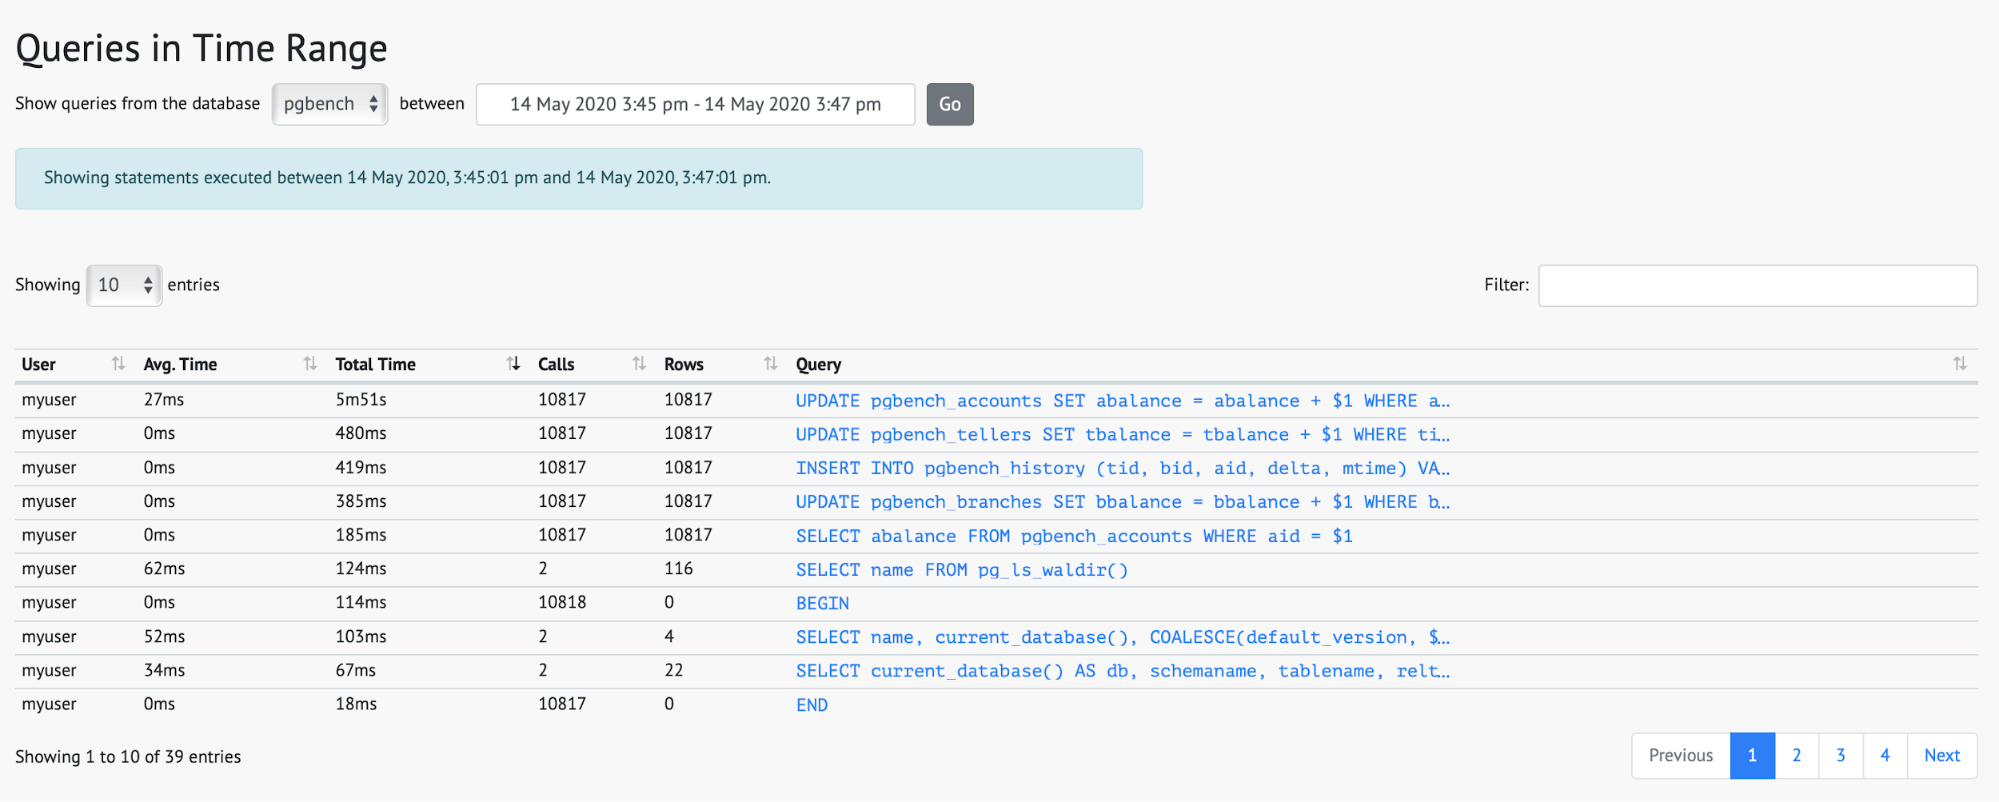
The granularity here is one minute.
For every query on the list you can click and see more detailed statistics.
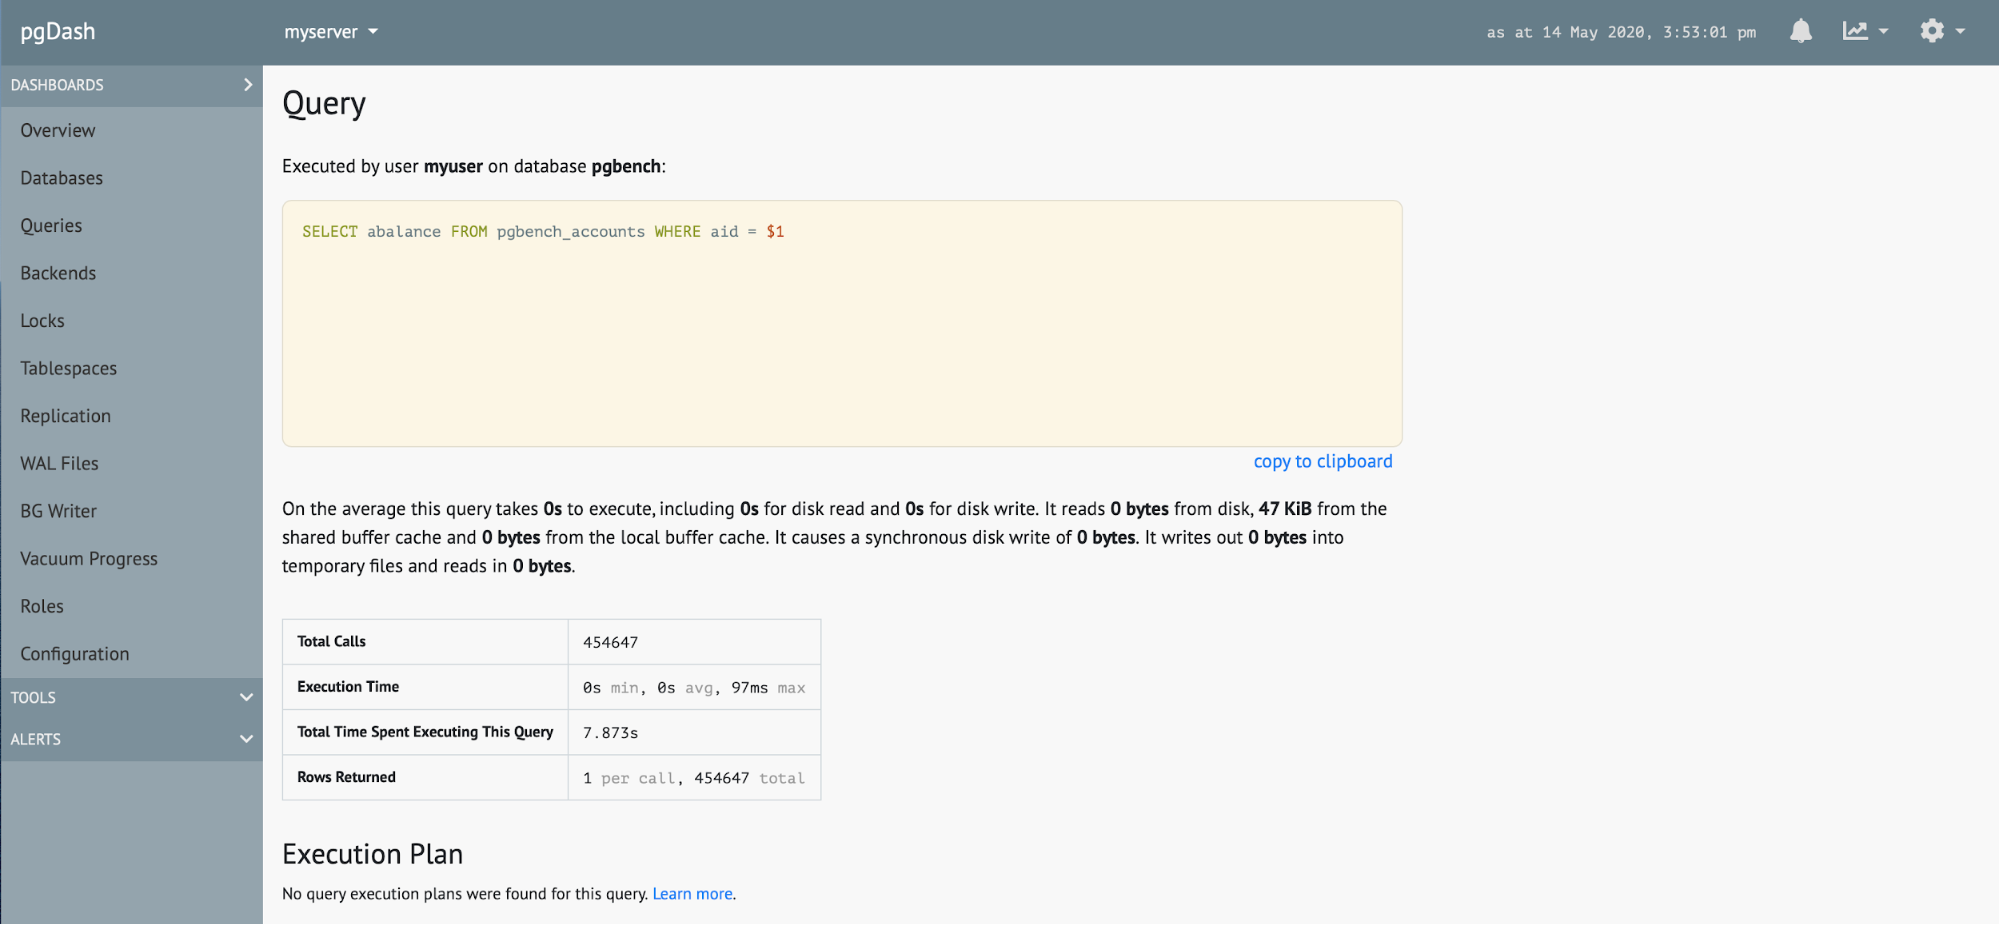
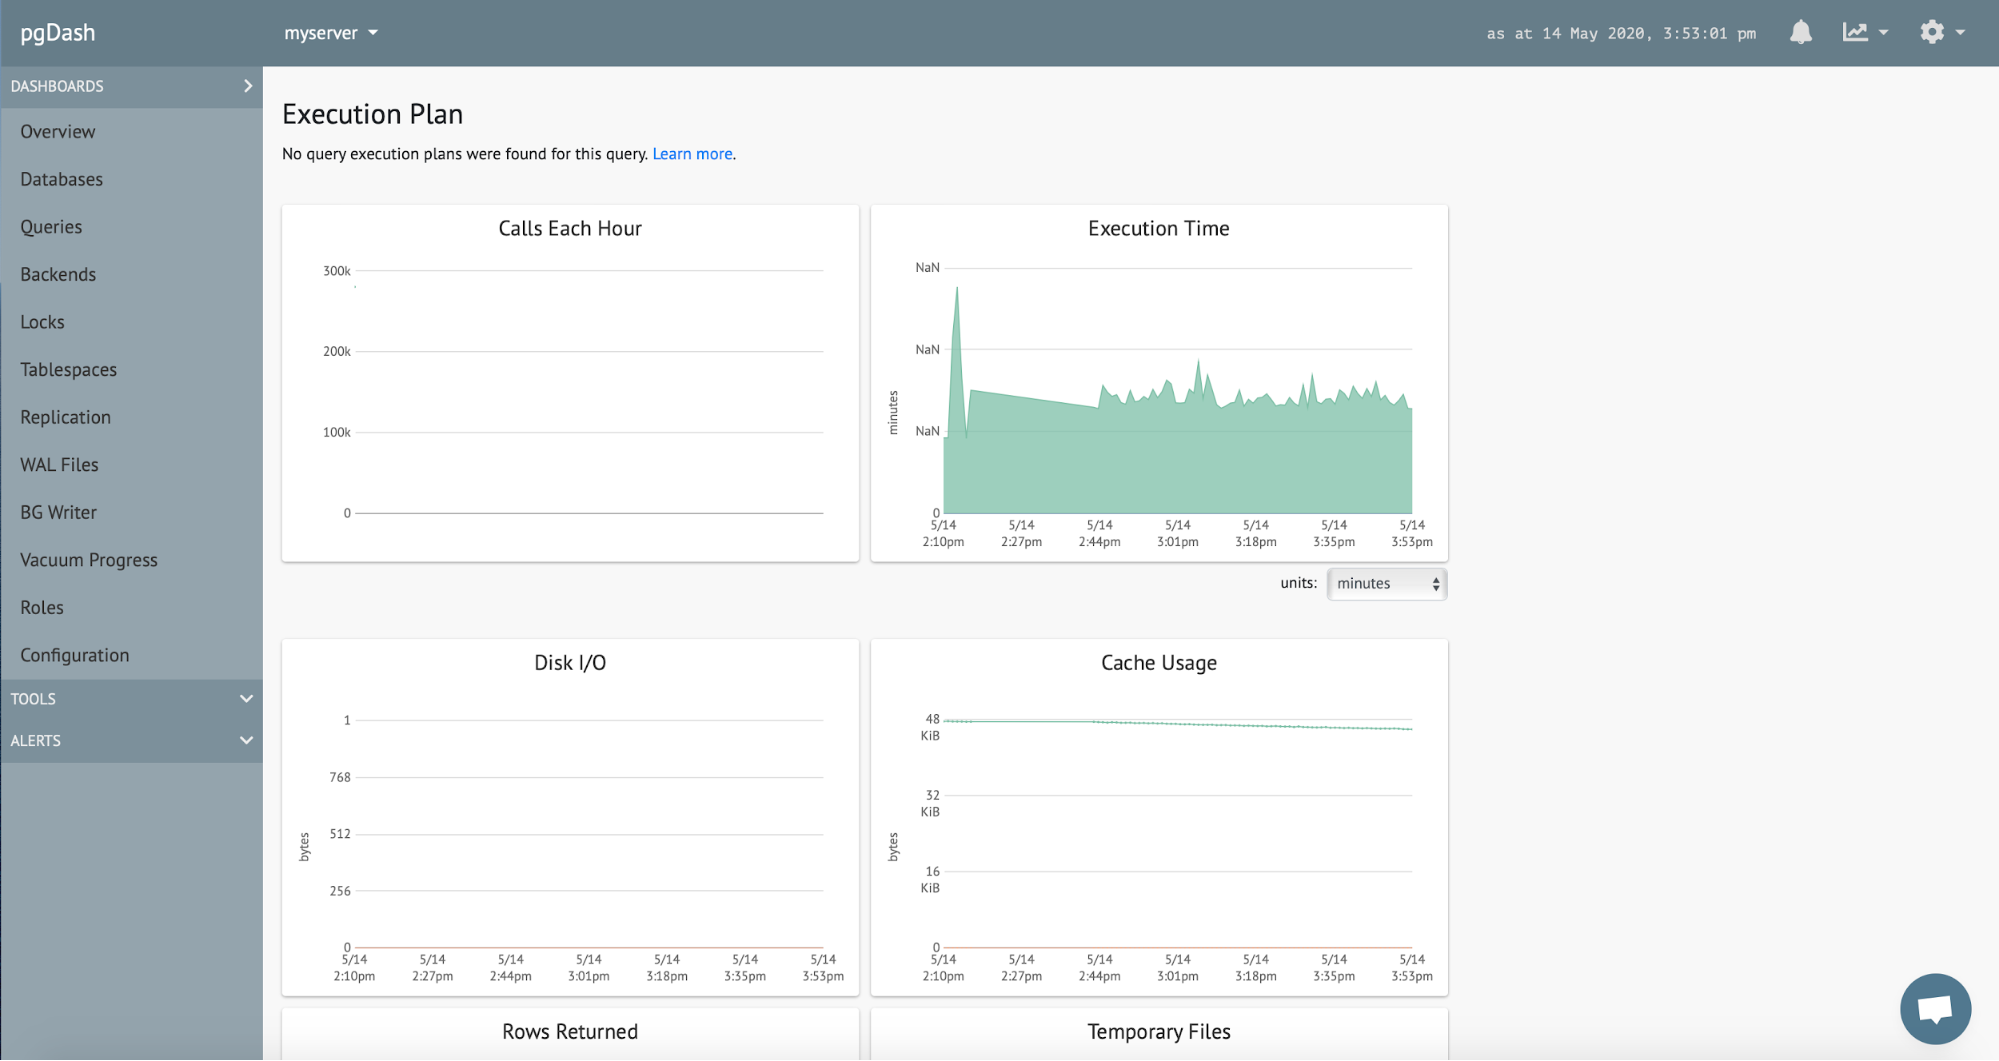
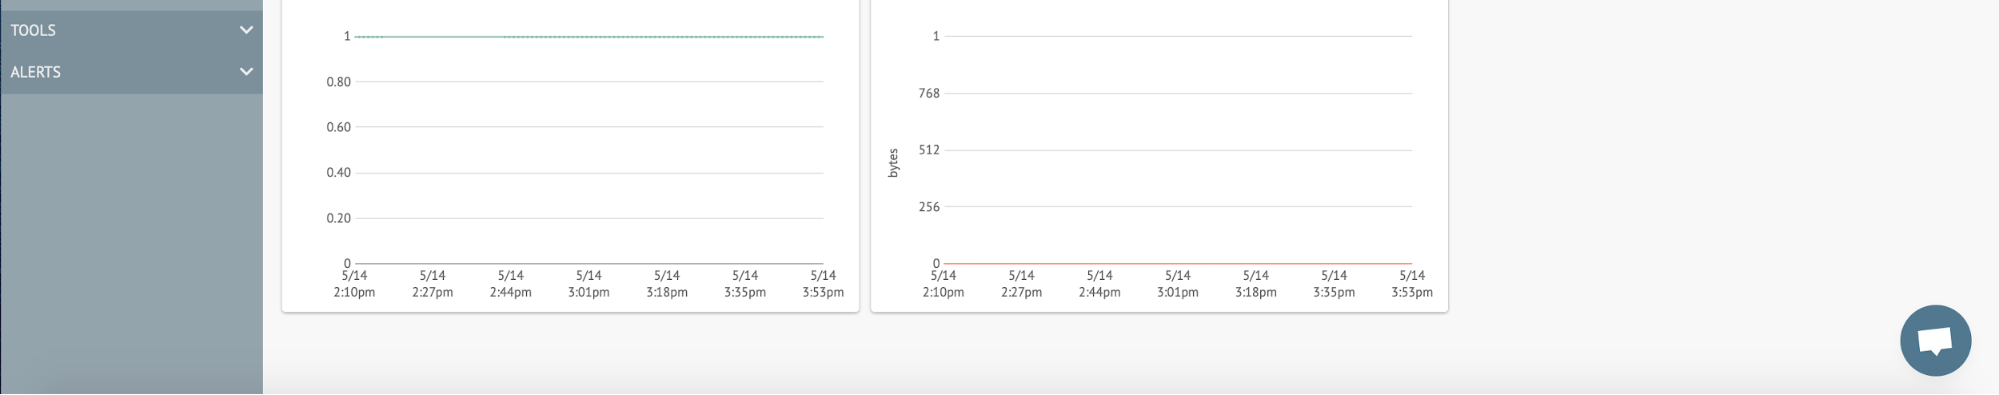
You can see the exact query, some data on it (disk access, shared buffer access, temporary blocks access). It is also possible to enable testing and storing the execution plan for the queries. Finally you can see the graphs showing how the performance of the query changed in time.
Overally, pgDash presents a nice insight into the query performance metrics in PostgreSQL.
ClusterControl PostgreSQL Query Monitoring & Management
ClusterControl comes with Query Monitor which is intended to give users insight into the performance of their queries. Query Monitor can be used for PostgreSQL but also for MySQL and Galera Cluster.
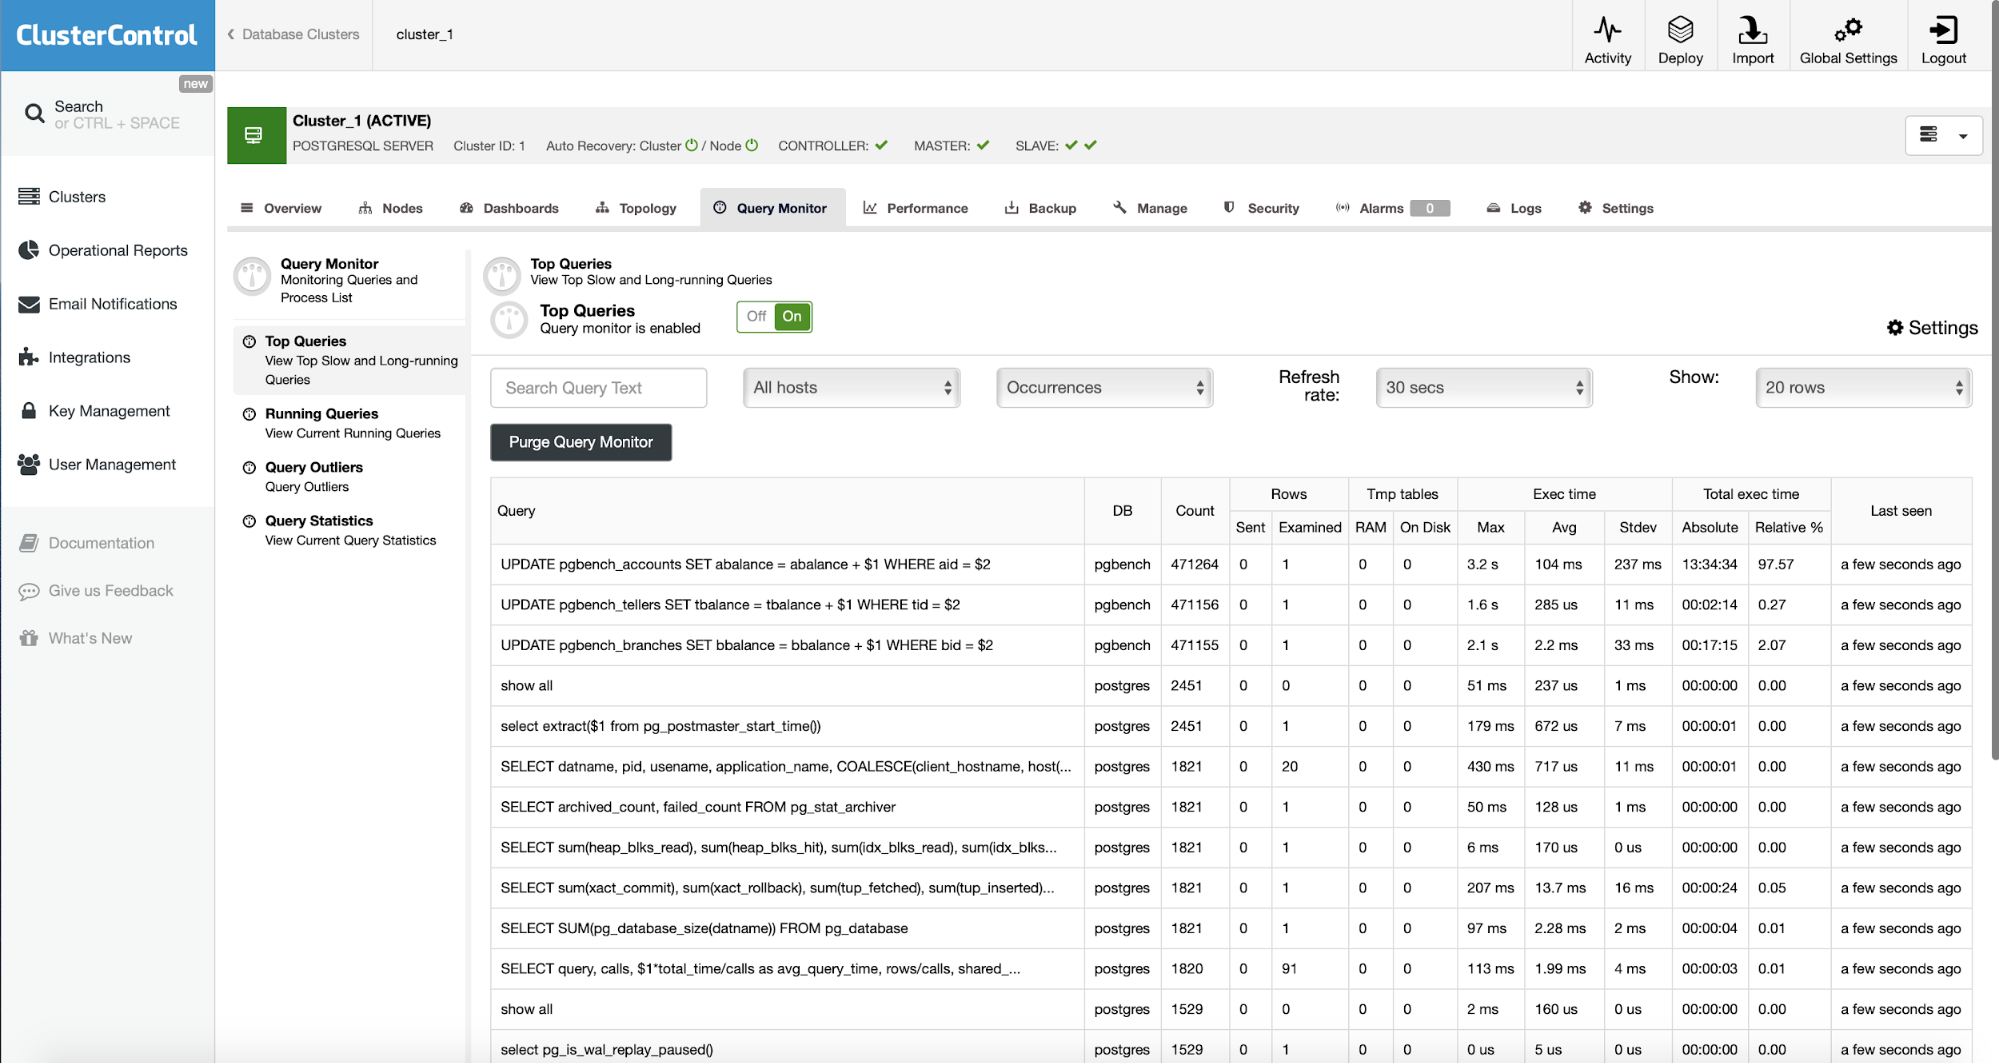
ClusterControl shows data aggregated across all databases and hosts in the cluster. The list of queries contains information about performance-related metrics. Number of occurrences, examined rows, temporary tables, maximum, average and total execution time. The list can be sorted using some of the columns (occurrences, max, average, standard deviation and total execution time).
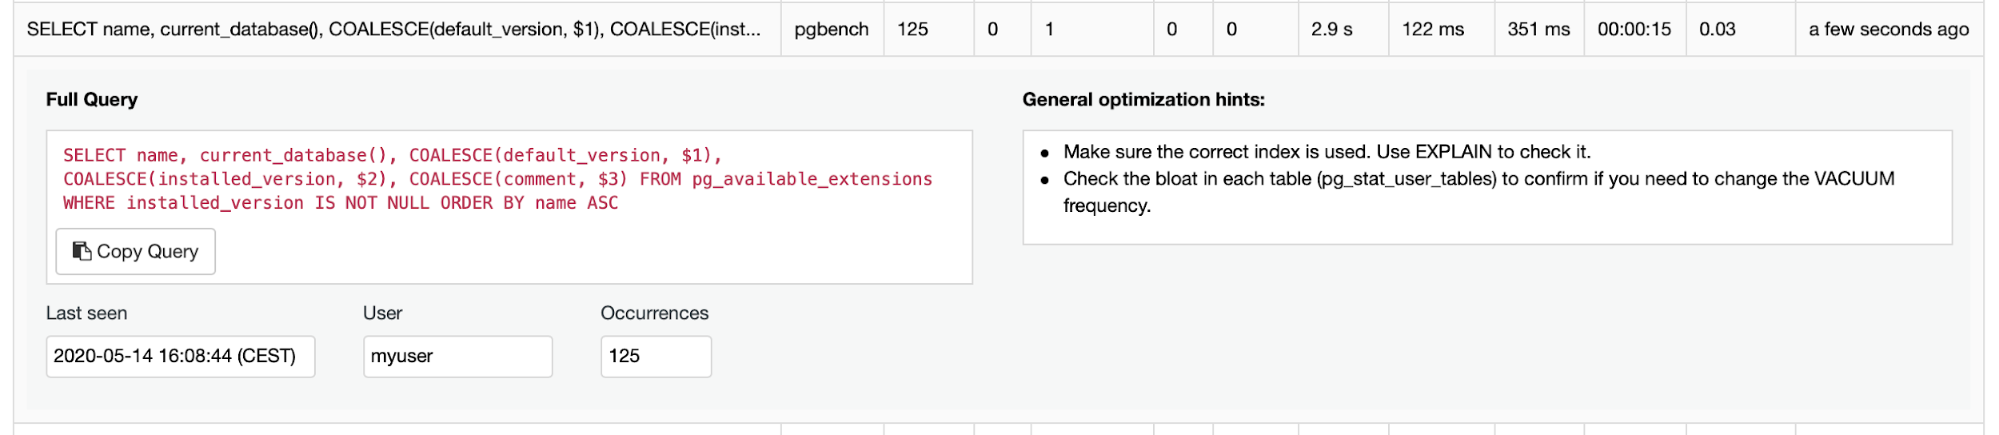
Each query can be clicked on, it shows full query text, some additional details and the general optimization hints.
ClusterControl also comes with the Query Outliers module.
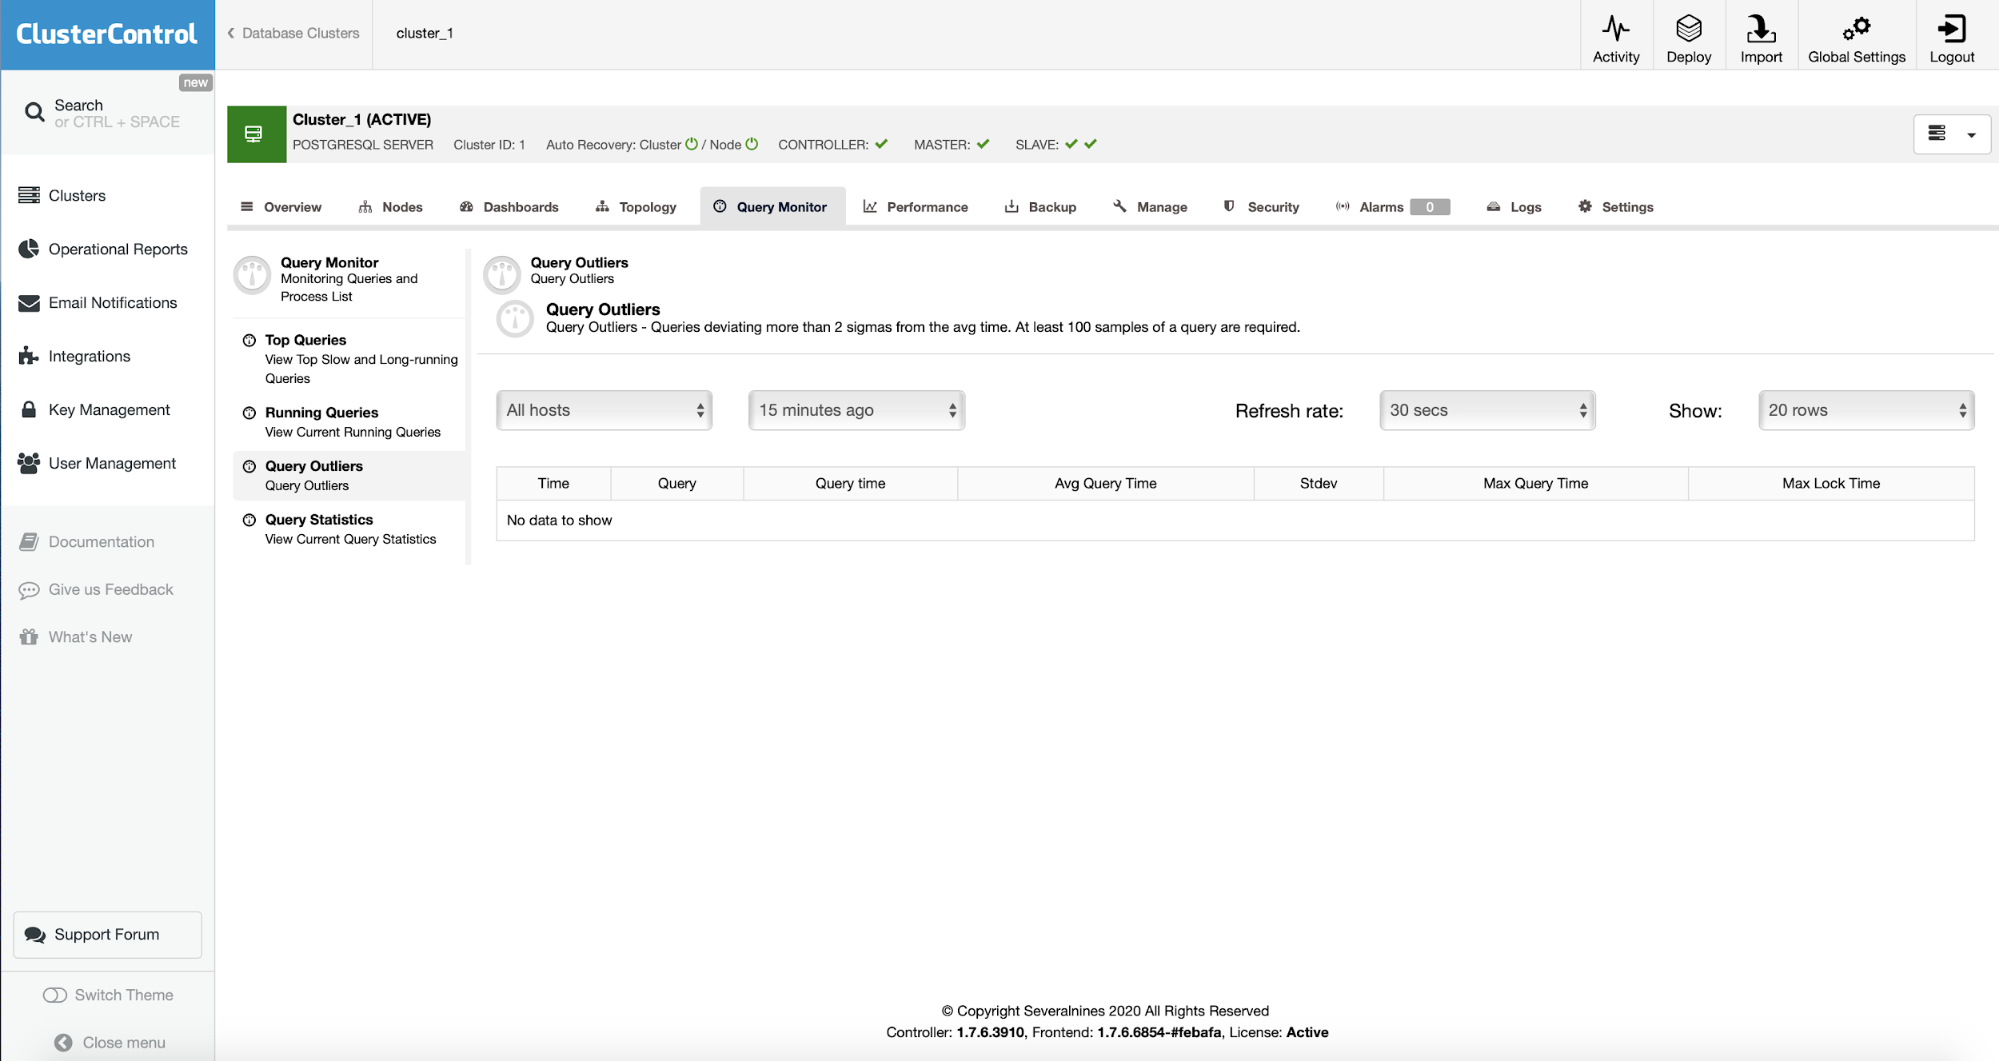
If there are any queries that deviate from the average performance of that particular query type, they will be shown in this section, allowing the user to better understand which queries behave inconsistently and try to find the root cause for this.
PostgreSQL Table and Index Metrics
On top of data directly related to the query performance, both tools provide information about other internals that may affect query performance.
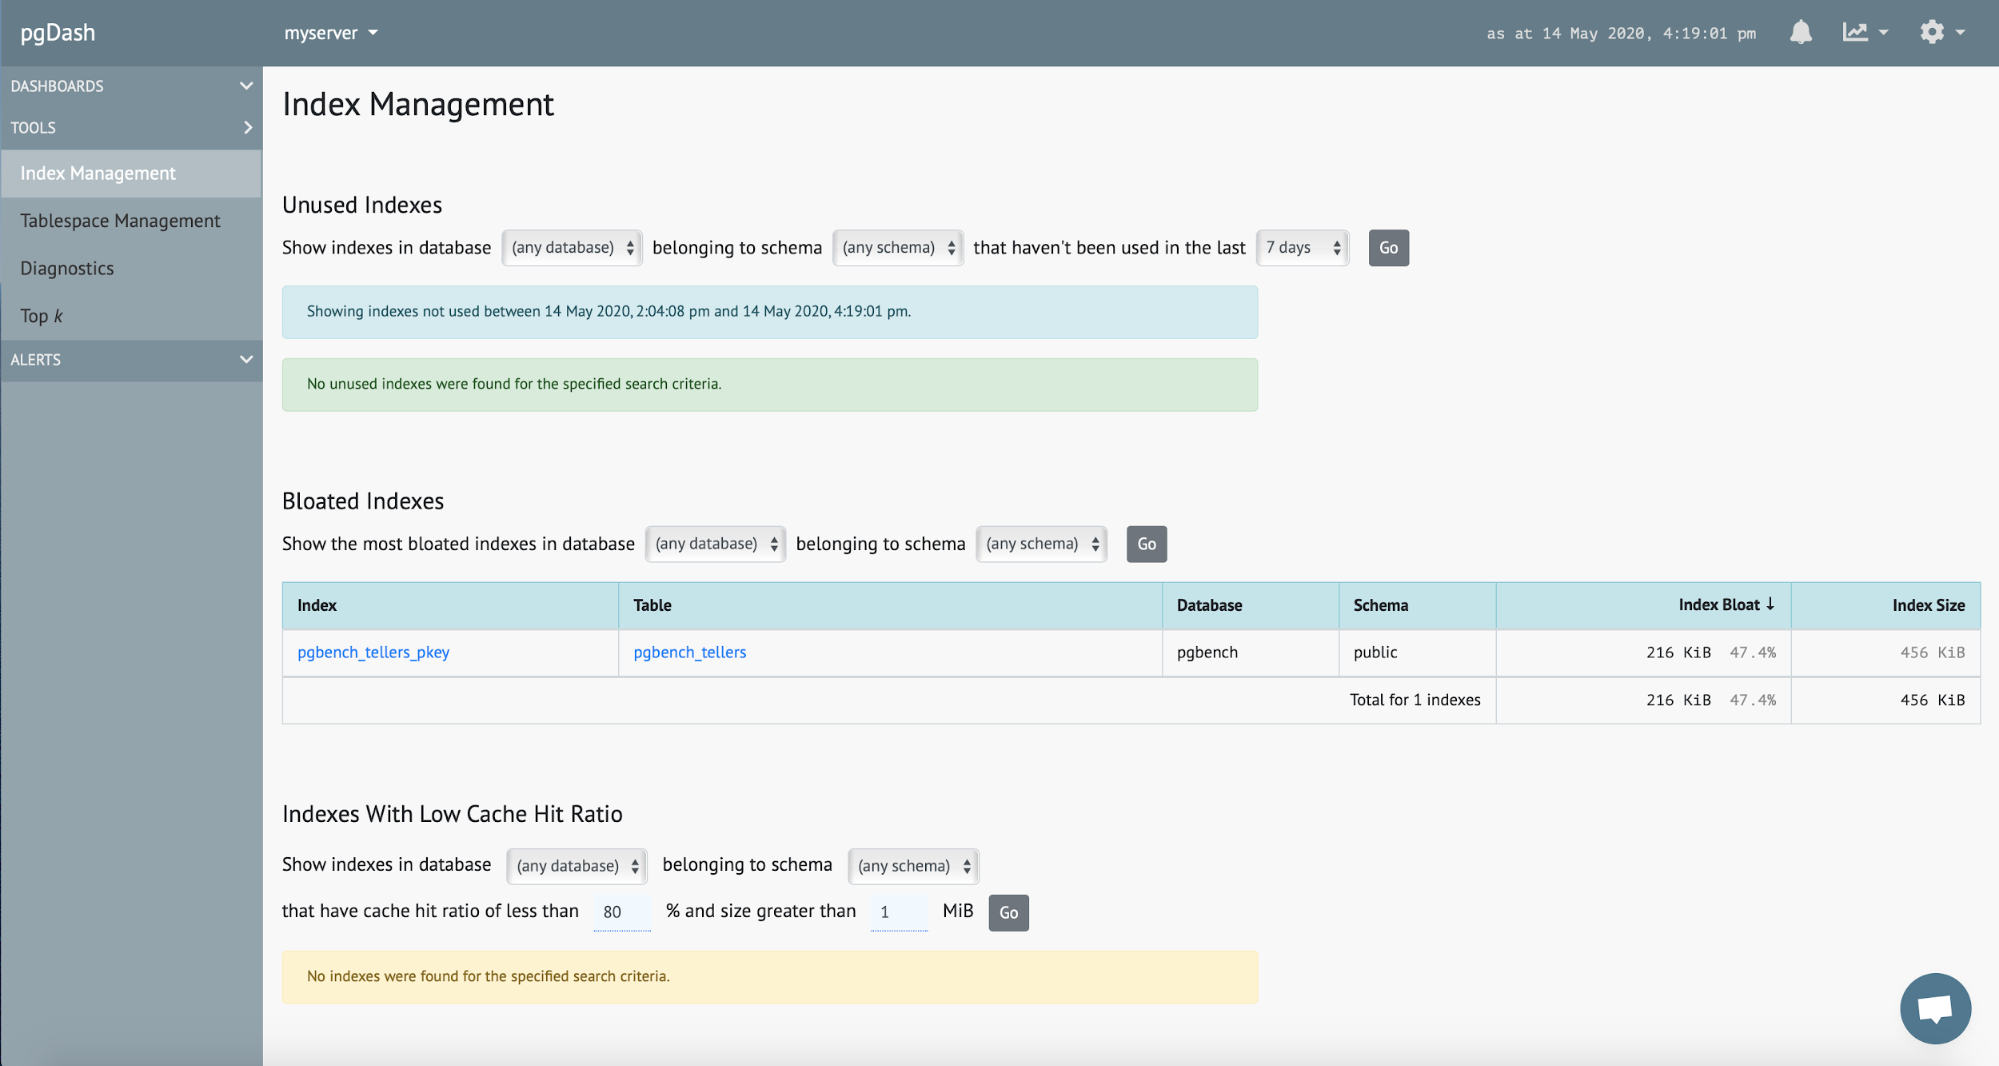
pgDash has a “Tools” section in which you can collect information about indexes, table size and bloat:
Similar data is available In ClusterControl, in Query Statistics:
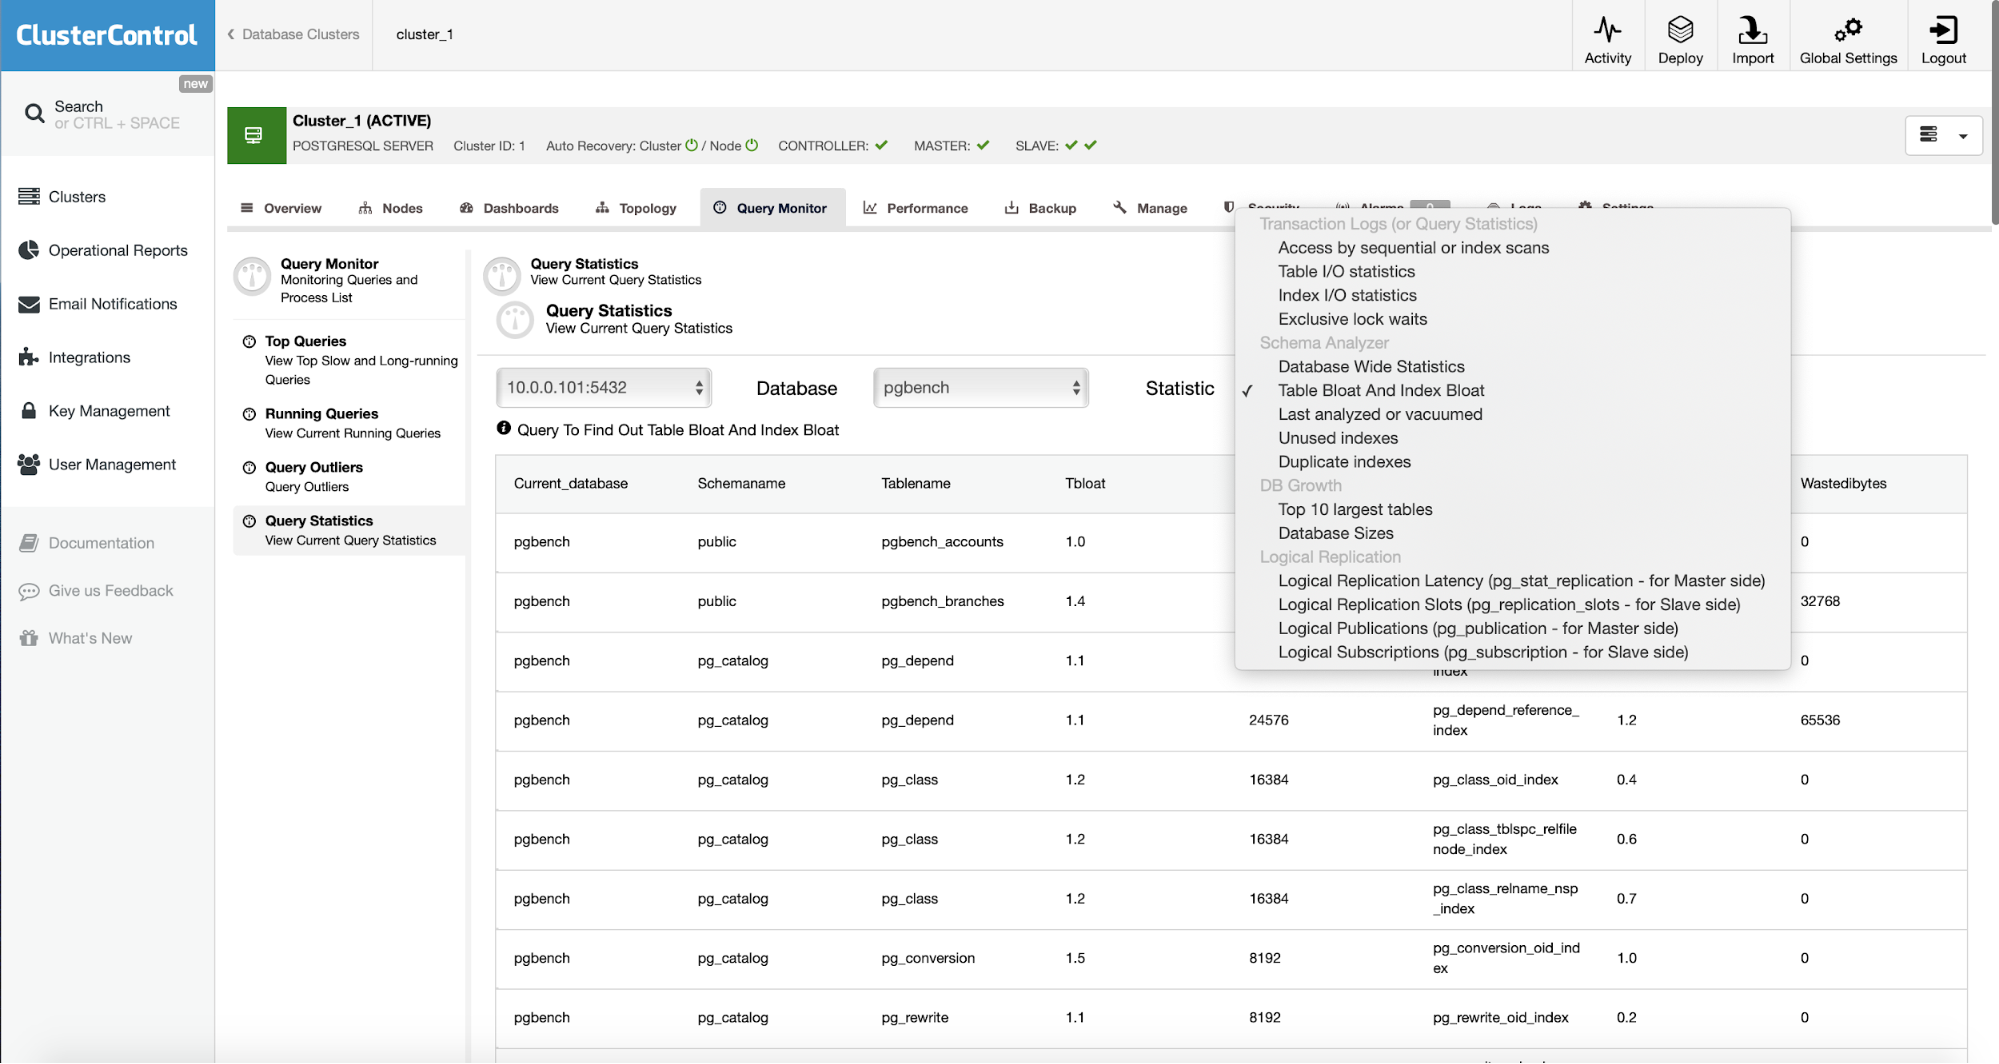
It is possible to check the I/O statistics for table and indexes, table and index bloat, unused or duplicated indexes. You can also check which tables are more likely to be accessed using index or sequential scans. You can as well check the size of the largest tables and databases.
Conclusion
We hope this short blog gives you insight into how ClusterControl compares with pgDash in features related to query performance. Please keep in mind that ClusterControl is intended not only to assist you with performance monitoring but also to build and deploy HA stacks for multiple Open Source databases, perform the configuration management, define and execute backup schedules and many more features. If you are interested in ClusterControl, you can download it for free.


