blog
Monitoring Percona XtraDB Cluster – Key Metrics

Percona XtraDB Cluster is a very well known high availability solution in MySQL world. It is based on Galera Cluster and it does provide virtually synchronous replication across multiple nodes. As with every database, it is crucial to keep track of what is happening in the system, if performance is on the expected levels and, if not, what is the bottleneck. This is of utmost importance to be able to react properly in the situation, where performance is impacted. Of course, Percona XtraDB Cluster comes with multiple metrics and it is not always clear which of them are the most important ones to track the state of the database. In this blog we will discuss a couple of the key metrics you want to keep an eye on while working with PXC.
To make it clear, we will be focusing on the metrics unique to PXC and Galera, we will not be covering metrics for MySQL or InnoDB. Those metrics have been discussed in our previous blogs.
Let’s take a look at some of the most important information that PXC presents to us.
Flow Control
Flow control is pretty much the most important metric you can monitor in any Galera Cluster therefore let’s have a bit of background. Galera is a multi-master, virtually synchronous cluster. It is possible to execute writes on any of the database nodes that form it. Every write has to be sent to all of the nodes in the cluster to ensure that it can be applied – this process is called the certification. No transaction can be applied before all nodes agree it can be committed. If any of the nodes has performance problems that makes it unable to cope with the traffic, it will start issuing flow control messages which are intended to inform the rest of the cluster about the performance problems and ask them to reduce the workload and help the delayed node to catch up with the rest of the cluster.
You can track when nodes had to introduce artificial pause to let their lagging peers to catch up using flow control paused metric (wsrep_flow_control_paused):
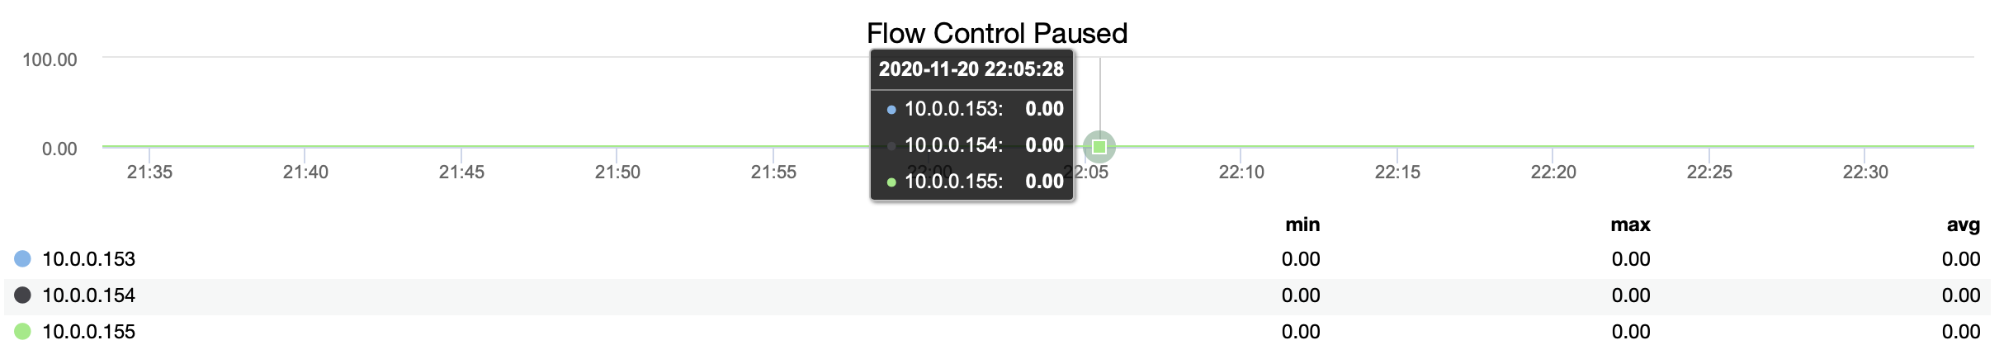
You can also track if the node is sending or receiving the flow control messages (wsrep_flow_control_recv and wsrep_flow_control_sent).
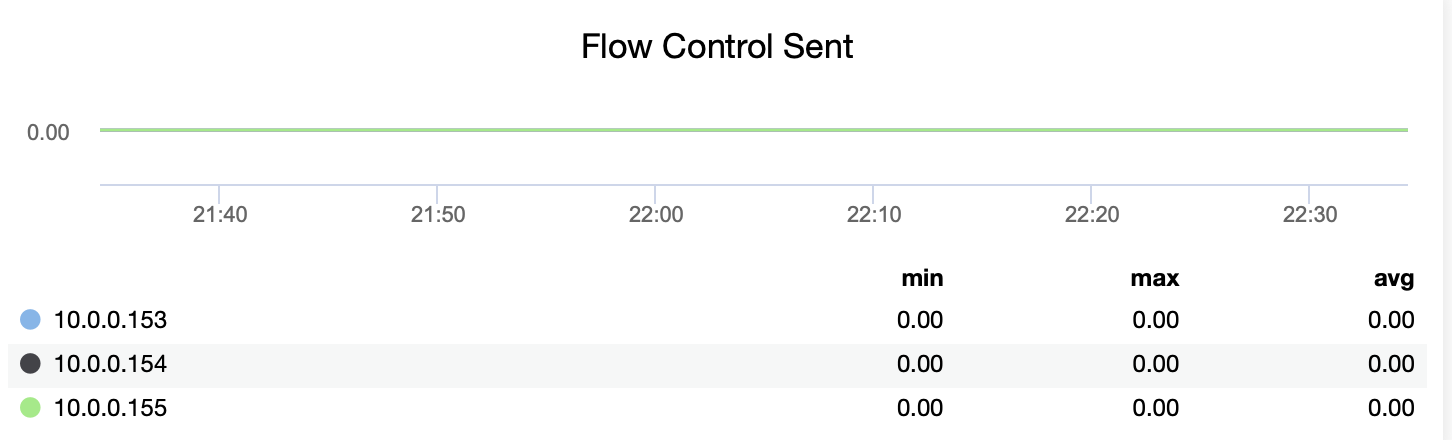
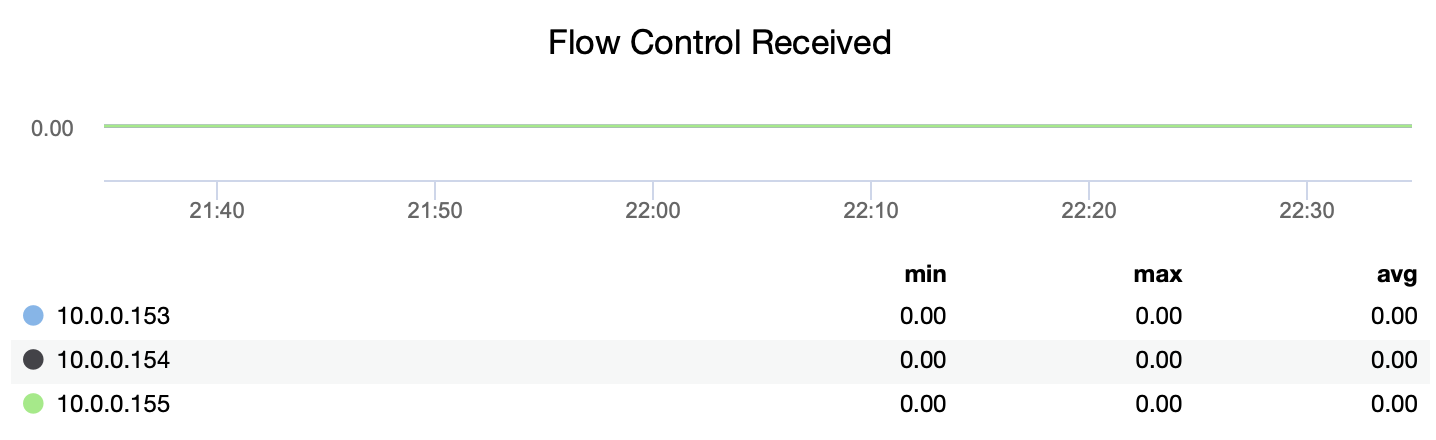
This information will help you understand better which node is not performing on the same level as its peers. You can then focus on that node and try to understand what is the issue and how to remove the bottleneck.
Send and Receive Queues
Those metrics are sort of related to the flow control. As we have discussed, a node may be lagging behind other nodes in the cluster. It can be caused by a non-even workload split or by other reasons (some process running in the background, backup or some custom, heavy queries). Before the flow control kicks in, lagging nodes will attempt to store the incoming writesets in the receive queue (wsrep_local_recv_queue) hoping that the performance impact is transient and it will be able to catch up very soon. Only if the queue becomes too big (it is governed by gcs.fc_limit setting), flow control messages start to be sent across the cluster.
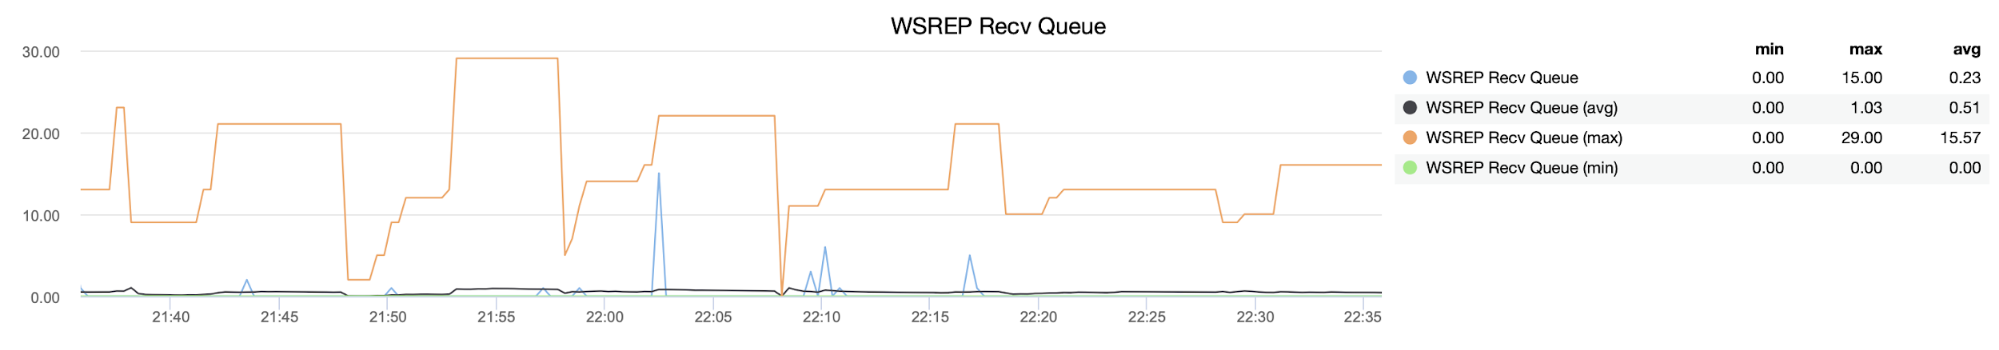
You can think of a receive queue as the early marker which shows that there are problems with the performance and the flow control may kick in.
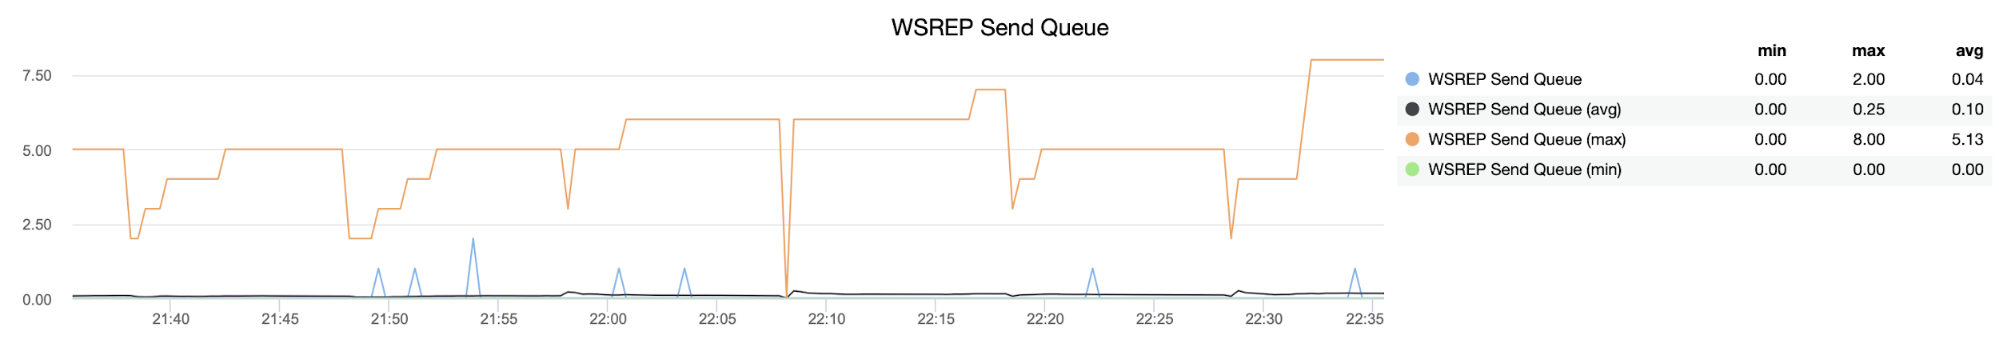
On the other hand, send queue (wsrep_local_send_queue) will tell you that the node is not able to send the writesets to other members of the cluster which may indicate problems with the network connectivity (pushing the writesets to the network is not really resource-intensive).
Parallelization Metrics
Percona XtraDB cluster can be configured to use multiple threads to apply the incoming writesets – it allows it to better handle multiple threads connecting to the cluster and issuing writes at the same time. There are two main metrics that you may want to keep an eye on.
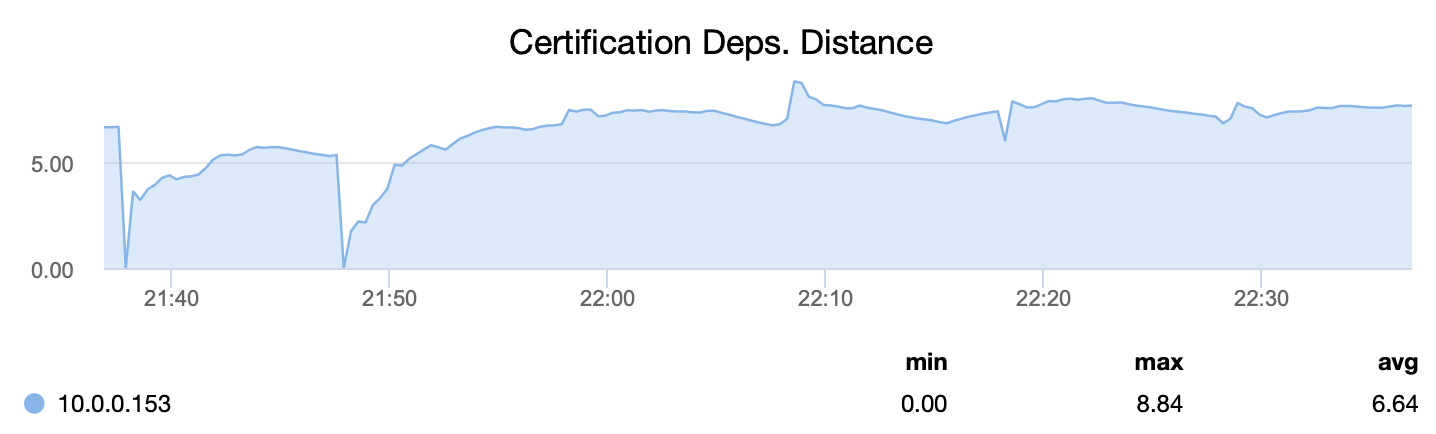
First, wsrep_cert_deps_distance, tells us what is the parallelization potential – how many writesets can, potentially, be applied at the same time. Based on this value you can configure the number of parallel slave threads (wsrep_slave_threads) that will work on applying incoming writesets. The rule of thumb is that there is no point in configuring more threads than the value of wsrep_cert_deps_distance.
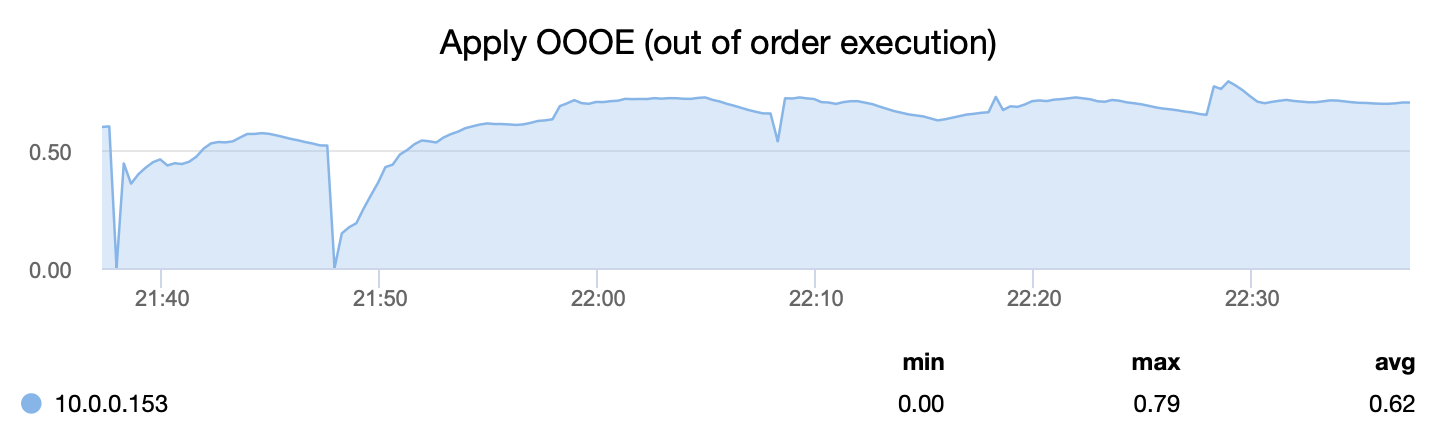
Second metric, on the other hand, tells us how efficiently we were able to parallelize the process of applying writesets – wsrep_apply_oooe tells us how often applier started to apply writesets out of order (which points towards better parallelization).
Conclusion
As you can see, there are a couple of metrics worth looking at in Percona XtraDB Cluster. Of course, as we stated at the beginning of this blog, those are metrics strictly related to PXC and Galera Cluster in general.
You should also keep an eye on regular MySQL and InnoDB metrics to get a better understanding of the state of your database. And remember, you can monitor this technology for free using the ClusterControl Community Edition.


