blog
What to Look for if Your PostgreSQL Replication is Lagging

Put a Virtual DBA on Every Database Server with DBScout
Connect in minutes and optimize your database servers with guardrailed auto-fixes, severity-ranked findings, and permission-based interventions.
PostgreSQL is designed to handle multiple threads, such as query parallelism, or deploying worker threads to handle specific tasks based on the assigned values in the configuration. But, sometimes replication lag and other issues can occur (due to a bad configuration), causing your server to go south.
Identifying replication lag in PostgreSQL is not complicated, but there are a few different approaches to look into the problem. In this blog post, cover everything you need to know when you’re experiencing PostgreSQL replication lag.
Types of Replication in PostgreSQL
Before diving into the topic, let’s see first how replication in PostgreSQL evolves as there are diverse set of approaches and solutions when dealing with replication.
Warm standby for PostgreSQL was implemented in version 8.2 (back in 2006) and was based on the log shipping method. This means that the WAL records are directly moved from one database server to another to be applied, or simply an analogous approach to PITR, or very much like what you are doing with rsync.
This approach, even old, is still used today and some institutions actually prefer this older approach. This approach implements a file-based log shipping by transferring WAL records one file (WAL segment) at a time. Though it has a downside; A major failure on the primary servers, transactions not yet shipped will be lost. There is a window for data loss (you can tune this by using the archive_timeout parameter, which can be set to as low as a few seconds, but such a low setting will substantially increase the bandwidth required for file shipping).
In PostgreSQL version 9.0, Streaming Replication was introduced. This feature allowed us to stay more up-to-date when compared to file-based log shipping. Its approach is by transferring WAL records (a WAL file is composed of WAL records) on the fly (merely a record based log shipping), between a master server and one or several standby servers. This protocol does not need to wait for the WAL file to be filled, unlike file-based log shipping. In practice, a process called WAL receiver, running on the standby server, will connect to the primary server using a TCP/IP connection. In the primary server, another process exists named WAL sender. It’s role is in charge of sending the WAL registries to the standby server(s) as they happen.
Asynchronous Replication setups in streaming replication can incur problems such as data loss or slave lag, so version 9.1 introduces synchronous replication. In synchronous replication, each commit of a write transaction will wait until confirmation is received that the commit has been written to the write-ahead log on disk of both the primary and standby server. This method minimizes the possibility of data loss, as for that to happen we will need for both, the master and the standby to fail at the same time.
The obvious downside of this configuration is that the response time for each write transaction increases, as we need to wait until all parties have responded. Unlike MySQL, there’s no support such as in a semi-synchronous environment of MySQL, it will failback to asynchronous if timeout has occurred. So in With PostgreSQL, the time for a commit is (at minimum) the round trip between the primary and the standby. Read-only transactions will not be affected by that.
As it evolves, PostgreSQL is continuously improving and yet its replication is diverse. For example, you can use physical streaming asynchronous replication or use logical streaming replication. Both are monitored differently though use the same approach when sending data over replication, which is still streaming replication. For more details check in the manual for different types of solutions in PostgreSQL when dealing with replication.
Causes of PostgreSQL Replication Lag
As defined in our previous blog, a replication lag is the cost of delay for transaction(s) or operation(s) calculated by its time difference of execution between the primary/master against the standby/slave node.
Since PostgreSQL is using streaming replication, it’s designed to be fast as changes are recorded as a set of sequence of log records (byte-by-byte) as intercepted by the WAL receiver then writes these log records to the WAL file. Then the startup process by PostgreSQL replays the data from that WAL segment and streaming replication begins. In PostgreSQL, a replication lag can occur by these factors:
- Network issues
- Not able to find the WAL segment from the primary. Usually, this is due to the checkpointing behavior where WAL segments are rotated or recycled
- Busy nodes (primary and standby(s)). Can be caused by external processes or some bad queries caused to be a resource intensive
- Bad hardware or hardware issues causing to take some lag
- Poor configuration in PostgreSQL such as small numbers of max_wal_senders being set while processing tons of transaction requests (or large volume of changes).
What To Look for With PostgreSQL Replication Lag
PostgreSQL replication is yet diverse but monitoring the replication health is subtle yet not complicated. In this approach we’ll showcase are based on a primary-standby setup with asynchronous streaming replication. The logical replication cannot benefit most of the cases we’re discussing here but the view pg_stat_subscription can help you collect information. However, we’ll not focus on that in this blog.
Using pg_stat_replication View
The most common approach is to run a query referencing this view in the primary node. Remember, you can only harvest information from the primary node using this view. This view contains the following table definition based on PostgreSQL 11 as shown below:
postgres=# d pg_stat_replication

                    View "pg_catalog.pg_stat_replication"

      Column      | Type           | Collation | Nullable | Default

------------------+--------------------------+-----------+----------+---------

 pid              | integer           | | |

 usesysid         | oid           | | |

 usename          | name           | | |

 application_name | text                     | | |

 client_addr      | inet           | | |

 client_hostname  | text           | | |

 client_port      | integer           | | |

 backend_start    | timestamp with time zone |           | |

 backend_xmin     | xid           | | |

 state            | text           | | |

 sent_lsn         | pg_lsn           | | |

 write_lsn        | pg_lsn           | | |

 flush_lsn        | pg_lsn           | | |

 replay_lsn       | pg_lsn           | | |

 write_lag        | interval           | | |

 flush_lag        | interval           | | |

 replay_lag       | interval           | | |

 sync_priority    | integer           | | |

 sync_state       | text           | | |
Where the fields are defined as (includes PG < 10 version),
- pid: Process id of walsender process
- usesysid: OID of user which is used for Streaming replication.
- username: Name of user which is used for Streaming replication
- application_name: Application name connected to master
- client_addr: Address of standby/streaming replication
- client_hostname: Hostname of standby.
- client_port: TCP port number on which standby communicating with WAL sender
- backend_start: Start time when SR connected to Master.
- backend_xmin: standby’s xmin horizon reported by hot_standby_feedback.
- state: Current WAL sender state i.e streaming
- sent_lsn/sent_location: Last transaction location sent to standby.
- write_lsn/write_location: Last transaction written on disk at standby
- flush_lsn/flush_location: Last transaction flush on disk at standby.
- replay_lsn/replay_location: Last transaction flush on disk at standby.
- write_lag: Elapsed time during committed WALs from primary to the standby (but not yet committed in the standby)
- flush_lag: Elapsed time during committed WALs from primary to the standby (WAL’s has already been flushed but not yet applied)
- replay_lag: Elapsed time during committed WALs from primary to the standby (fully committed in standby node)
- sync_priority: Priority of standby server being chosen as synchronous standby
- sync_state: Sync State of standby (is it async or synchronous).
A sample query would look as follows in PostgreSQL 9.6,
paultest=# select * from pg_stat_replication;

-[ RECORD 1 ]----+------------------------------

pid              | 7174

usesysid         | 16385

usename          | cmon_replication

application_name | pgsql_1_node_1

client_addr      | 192.168.30.30

client_hostname  |

client_port      | 10580

backend_start    | 2020-02-20 18:45:52.892062+00

backend_xmin     |

state            | streaming

sent_location    | 1/9FD5D78

write_location   | 1/9FD5D78

flush_location   | 1/9FD5D78

replay_location  | 1/9FD5D78

sync_priority    | 0

sync_state       | async

-[ RECORD 2 ]----+------------------------------

pid              | 7175

usesysid         | 16385

usename          | cmon_replication

application_name | pgsql_80_node_2

client_addr      | 192.168.30.20

client_hostname  |

client_port      | 60686

backend_start    | 2020-02-20 18:45:52.899446+00

backend_xmin     |

state            | streaming

sent_location    | 1/9FD5D78

write_location   | 1/9FD5D78

flush_location   | 1/9FD5D78

replay_location  | 1/9FD5D78

sync_priority    | 0

sync_state       | async
This basically tells you what blocks of location in the WAL segments that have been written, flushed, or applied. It provides you a granular overlook of the replication status.
Queries to Use In the Standby Node
In the standby node, there are functions that are supported for which you can mitigate this into a query and provide you the overview of your standby replication’s health. To do this, you can run the following query below (query is based on PG version > 10),
postgres=#  select pg_is_in_recovery(),pg_is_wal_replay_paused(), pg_last_wal_receive_lsn(), pg_last_wal_replay_lsn(), pg_last_xact_replay_timestamp();

-[ RECORD 1 ]-----------------+------------------------------

pg_is_in_recovery             | t

pg_is_wal_replay_paused       | f

pg_last_wal_receive_lsn       | 0/2705BDA0

pg_last_wal_replay_lsn        | 0/2705BDA0

pg_last_xact_replay_timestamp | 2020-02-21 02:18:54.603677+00
In older versions, you can use the following query:
postgres=# select pg_is_in_recovery(),pg_last_xlog_receive_location(), pg_last_xlog_replay_location(), pg_last_xact_replay_timestamp();

-[ RECORD 1 ]-----------------+------------------------------

pg_is_in_recovery             | t

pg_last_xlog_receive_location | 1/9FD6490

pg_last_xlog_replay_location  | 1/9FD6490

pg_last_xact_replay_timestamp | 2020-02-21 08:32:40.485958-06
What does the query tell? Functions are defined accordingly here,
- pg_is_in_recovery(): (boolean) True if recovery is still in progress.
- pg_last_wal_receive_lsn()/pg_last_xlog_receive_location(): (pg_lsn) The write-ahead log location received and synced to disk by streaming replication.
- pg_last_wal_replay_lsn()/pg_last_xlog_replay_location(): (pg_lsn) The last write-ahead log location replayed during recovery. If recovery is still in progress this will increase monotonically.
- pg_last_xact_replay_timestamp(): (timestamp with time zone) Get timestamp of last transaction replayed during recovery.
Using some basic math, you can combine these functions. The most common used function that are used by DBA’s are,
SELECT CASE WHEN pg_last_wal_receive_lsn() = pg_last_wal_replay_lsn()

THEN 0

ELSE EXTRACT (EPOCH FROM now() - pg_last_xact_replay_timestamp())

END AS log_delay;
or in versions PG < 10,
SELECT CASE WHEN pg_last_xlog_receive_location() = pg_last_xlog_replay_location()

THEN 0

ELSE EXTRACT (EPOCH FROM now() - pg_last_xact_replay_timestamp())

END AS log_delay;
Although this query has been in-practice and is used by DBA’s. Still, it doesn’t provide you an accurate view of the lag. Why? Let’s discuss this in the next section.
Identifying Lag Caused by WAL Segment’s Absence
PostgreSQL standby nodes, which are in recovery mode, does not report to you the exact state of what’s happening of your replication. Not unless you view the PG log, you can gather information of what’s going on. There’s no query you can run to determine this. In most cases, organizations and even small institutions come up with 3rd party softwares to let them be alerted when an alarm is raised.
One of these is ClusterControl, which offers you observability, sends alerts when alarms are raised or recovers your node in case of disaster or catastrophe happens. Let’s take this scenario, my primary-standby async streaming replication cluster has failed. How would you know if something’s wrong? Let’s combine the following:
Step 1: Determine if There’s a Lag
postgres=# SELECT CASE WHEN pg_last_wal_receive_lsn() = pg_last_wal_replay_lsn()

postgres-# THEN 0

postgres-# ELSE EXTRACT (EPOCH FROM now() - pg_last_xact_replay_timestamp())

postgres-# END AS log_delay;

-[ RECORD 1 ]

log_delay | 0
Step 2: Determine the WAL Segments Received From the Primary and Compare with Standby Node
## Get the master's current LSN. Run the query below in the master

postgres=# SELECT pg_current_wal_lsn();

-[ RECORD 1 ]------+-----------

pg_current_wal_lsn | 0/925D7E70
For older versions of PG < 10, use pg_current_xlog_location.
## Get the current WAL segments received (flushed or applied/replayed)

postgres=# select pg_is_in_recovery(),pg_is_wal_replay_paused(), pg_last_wal_receive_lsn(), pg_last_wal_replay_lsn(), pg_last_xact_replay_timestamp();

-[ RECORD 1 ]-----------------+------------------------------

pg_is_in_recovery             | t

pg_is_wal_replay_paused       | f

pg_last_wal_receive_lsn       | 0/2705BDA0

pg_last_wal_replay_lsn        | 0/2705BDA0

pg_last_xact_replay_timestamp | 2020-02-21 02:18:54.603677+00
That seems to look bad.
Step 3: Determine How Bad it Could Be
Now, let’s mix the formula from step #1 and in step #2 and get the diff. How to do this, PostgreSQL has a function called pg_wal_lsn_diff which is defined as,
pg_wal_lsn_diff(lsn pg_lsn, lsn pg_lsn) / pg_xlog_location_diff (location pg_lsn, location pg_lsn): (numeric) Calculate the difference between two write-ahead log locations
Now, let’s use it to determine the lag. You can run it in any PG node, since it’s we’ll just provide the static values:
postgres=# select pg_wal_lsn_diff('0/925D7E70','0/2705BDA0');                                                                                                                                     -[ RECORD 1 ]---+-----------

pg_wal_lsn_diff | 1800913104
Let’s estimate how much is 1800913104, that seems to be about 1.6GiB might have been absent in the standby node,
postgres=# select round(1800913104/pow(1024,3.0),2) missing_lsn_GiB;

-[ RECORD 1 ]---+-----

missing_lsn_gib | 1.68
Lastly, you can proceed or even prior to the query look at the logs like using tail -5f to follow and check what’s going on. Do this for both primary/standby nodes. In this example, we’ll see that it has a problem,
## Primary
root@debnode4:/var/lib/postgresql/11/main# tail -5f log/postgresql-2020-02-21_033512.log
2020-02-21 16:44:33.574 UTC [25023] ERROR: requested WAL segment 000000030000000000000027 has already been removed
...
## Standby
root@debnode5:/var/lib/postgresql/11/main# tail -5f log/postgresql-2020-02-21_014137.log
2020-02-21 16:45:23.599 UTC [26976] LOG: started streaming WAL from primary at 0/27000000 on timeline 3
2020-02-21 16:45:23.599 UTC [26976] FATAL: could not receive data from WAL stream: ERROR: requested WAL segment 000000030000000000000027 has already been removed
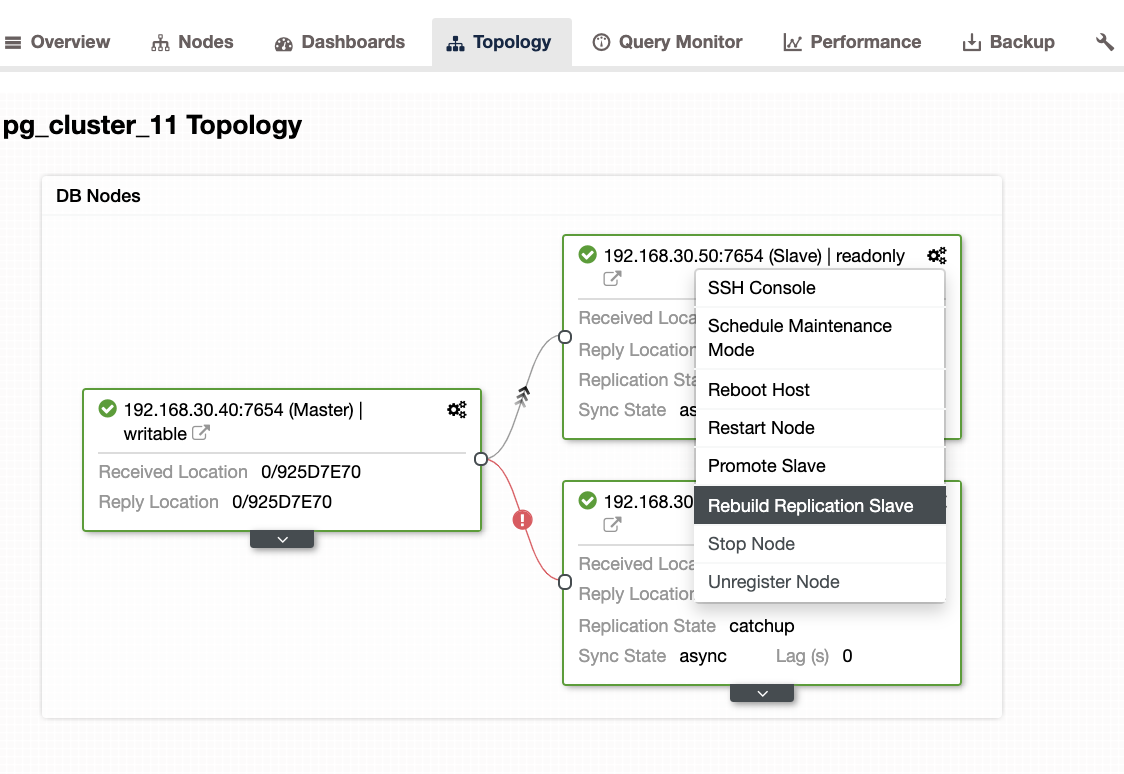
...When encountering this issue, it’s better to rebuild your standby nodes. In ClusterControl, it’s as easy as one click. Just go to the Nodes/Topology section, and rebuild the node just like below:
Other Things to Check
You can use the same approach in our previous blog (in MySQL), using system tools such as ps, top, iostat, netstat combination. For example, you can also get the current recovered WAL segment from the standby node,
root@debnode5:/var/lib/postgresql/11/main# ps axufwww|egrep "postgre[s].*startup"

postgres  8065 0.0 8.3 715820 170872 ?       Ss 01:41 0:03 _ postgres: 11/main: startup   recovering 000000030000000000000027
How Can ClusterControl Help?
ClusterControl offers an efficient way on monitoring your database nodes from primary to the slave nodes. When going to the Overview tab, you have already the view of your replication health:
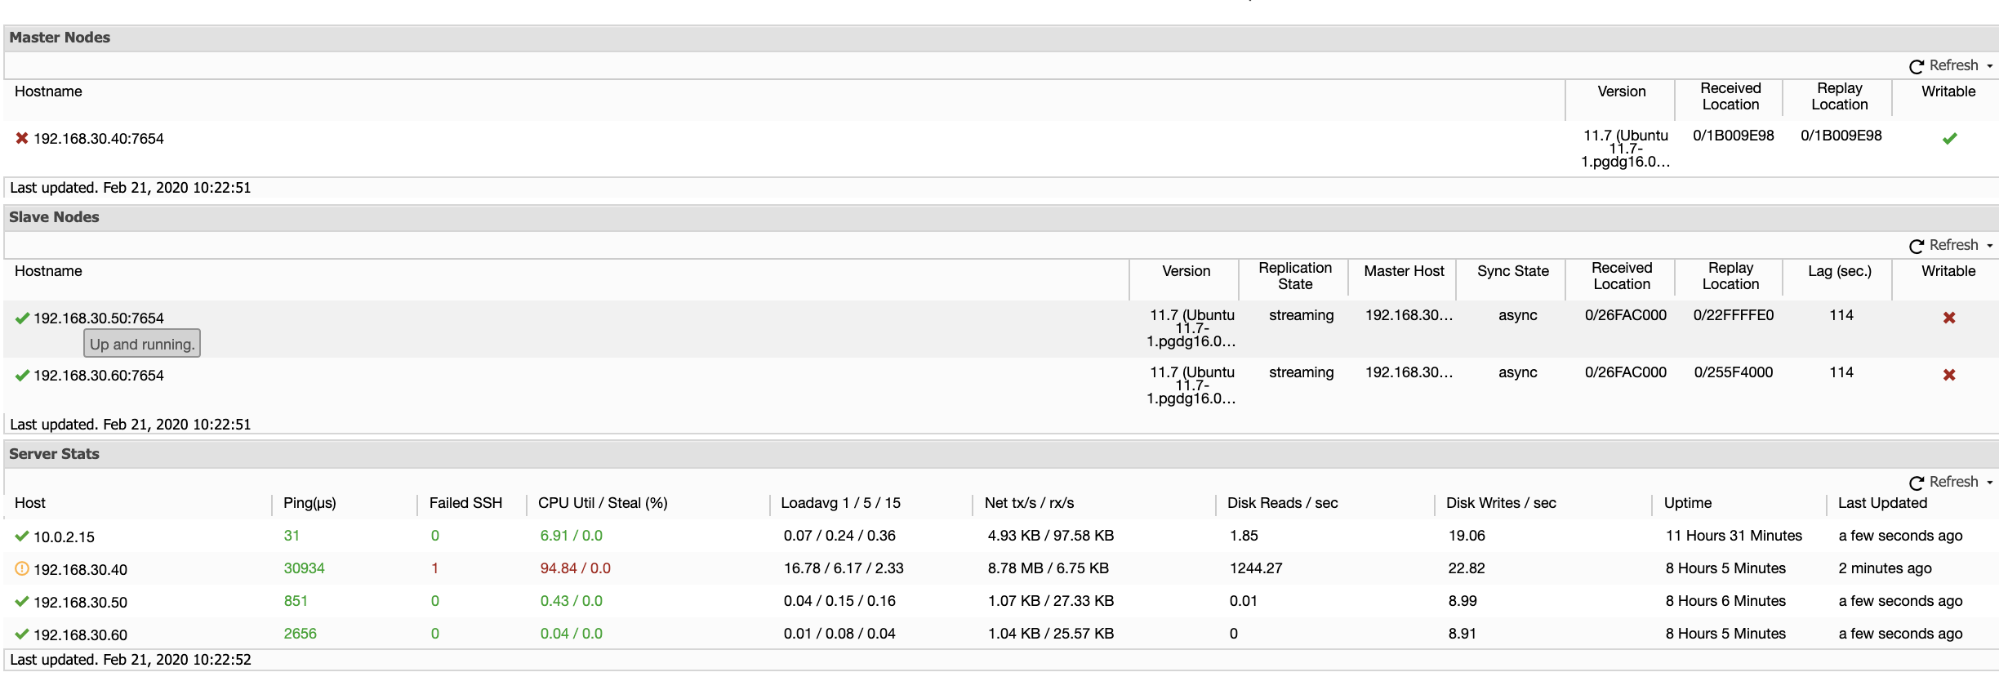
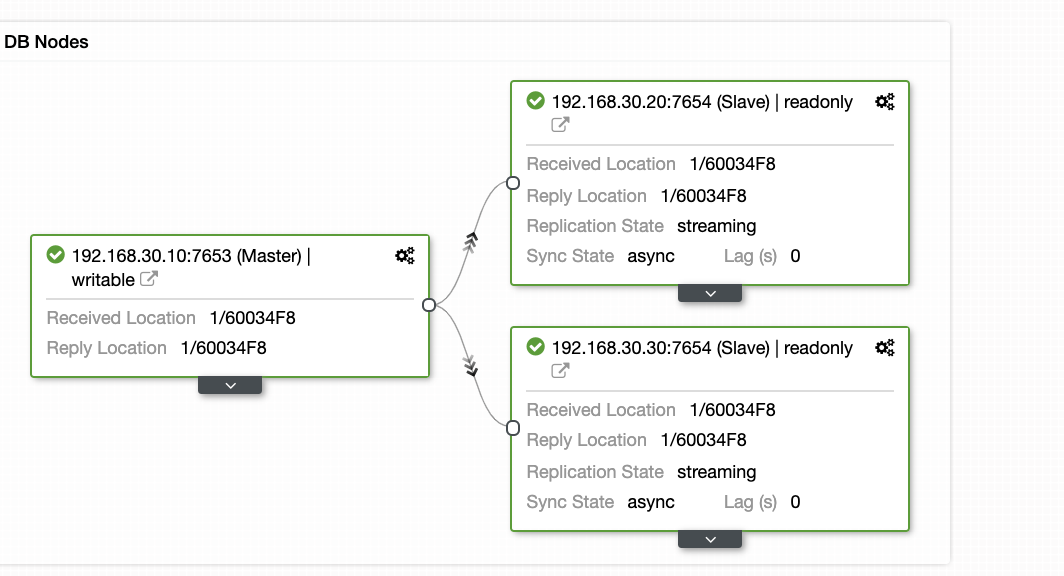
Basically, the two screenshots above displays how’s the replication health and what’s the current WAL segments. That’s not at all. ClusterControl also shows the current activity of what’s going on with your Cluster.
Conclusion
Monitoring replication health in PostgreSQL can be accomplished in various ways; using third party observability tooling or platforms that include it as a feature can help you monitor and address issues before they become critical. The most important thing is that you have your disaster recovery plan and business continuity planned ahead.
Replication lag is only one of many cluster health indicators that can affect operational reliability and you should consider employing a robust platform like ClusterControl to help you run your database operations reliably at scale — try it free for 30-days.


