blog
Not Happy with Your Moodle Performance? Here's How to Maximise Your Server Resources

To run a clustered Moodle system efficiently, one has to allocate sufficient resources to the essential services required by Moodle. This is not an easy task, and it requires a lot of ongoing tuning until the server is stable. For bare-metal servers, the hardware resources are usually fixed with anticipation of maximum performance, but the next question is how are we going to maximize the server resources to their full potential.
We have seen some production setups and we can tell that some of the resources are underutilized. For example, a 4-core proxy server is only using not more than a single core the whole time, a database server with 64GB RAM in total but only used up to 16GB of RAM, leaving 48GB of free memory and many more such cases that fundamentally wasting the precious resources. This blog post will be focusing on maximizing the Linux server resources for your Moodle installation, especially on the primary resources like CPU, memory and disks.
Application Tier
Apache Web Server
To configure Apache to use more of your CPUs, you need to get rid of the bottle-neck that prevents Apache from using more CPUs. By default, Apache (and any other multi-process application) will use all available cores as possible. As long as you don’t limit Apache to use fewer cores than you have in the server, there’s no other action you need to take.
How Apache works on multi-core systems and how you configure it is greatly influenced by which Multi-Processing Modules (MPM) you use. The most common MPM is prefork (mpm_prefork). Prefork gives you a separate process for every request. Processes can be easily spread out by the OS to use all cores. However, it is not a multi-threaded operation. If you install Apache with the PHP module (mod_php), it will by default use mpm_prefork which is not multi-threaded.
The worker (mpm_worker) and event (mpm_event) enable multi-threaded operation, but it isn’t compatible with the PHP Apache module which is not thread-safe on Unix environments (in particular many of its most popular extensions). It is not possible to embed an interpreter in each event/worker MPM process. PHP needs to live as a separate process, connected through Apache’s CGI or FastCGI interface. For PHP, there is an extension called PHP-FPM (FastCGI Process Manager) and once activated, Apache will serve all static resources (images, CSS, etc.) directly while PHP-FPM serves the PHP-related requests.
The integration of PHP-FPM requires extra steps in the installation, as shown in the following steps for RedHat-based servers:
- Install php-fpm package.
- Active mpm_worker or mpm_event configuration inside /etc/httpd/conf.modules.d/00-mpm.conf, for multi-threaded Apache process.
- Configure Apache to use php-fpm inside /etc/httpd/conf.d/php.conf.
- Configure php-fpm (socket, pool,listener, etc) inside /etc/php-fpm.d/www.conf.
- Enable and start PHP-FPM as a service.
With this configuration, PHP and Apache live as two independent processes. To load PHP configurations, simply restart the php-fpm service without impacting the Apache webserver.
Memory utilization by Apache processes is typically 10MB, yet Moodle can easily use up to 100MB per process, so a general rule of thumb is to divide your available memory in megabytes by 100 to get a relevant setting for MaxClients.
Nginx Web Server
Nginx is very popular due to its small memory footprint and better performance if compared to Apache. It is also a popular HTTP reverse proxy (load balancer) that can serve static files and cache. Moodle has documentation on how to configure Nginx as the webserver for Moodle.
Nginx is well-tuned for a web server, so nothing much should be done to maximize the server’s resources. The variable worker_processes sets the optimal value depending on many factors including the number of CPU cores, the number of hard disk drives that store data and the load pattern. When one is in doubt, setting it to the number of available CPU cores would be a good start (the value “auto” will try to auto-detect it).
In terms of memory, the default configuration is good enough for most cases. Further tuning might be required if you have a limited RAM as you can see listed in the performance tips guide here.
HAProxy Load Balancer
Apart from Nginx, HAProxy is also a common reverse proxy that sits on top of Moodle applications as HTTP load balancer and SSL terminator. By default, HAProxy runs in one single process with “nbproc 1” configuration. While this is good enough for most cases, we could utilize HAProxy to run with many processes called multi-process (v1.1.7 and later) or with many threads called multi-thread (v1.8 and later) to utilize all available CPU cores.
However, things get a bit more complicated when having many processes due to:
- The HAProxy peers’ protocol, which is used to synchronize stick tables across HAProxy instances, may only be used in single-process configurations, leading to complexity when many tables need to be synchronized.
- There is no information sharing between HAProxy processes, so all data, configuration parameters, statistics, limits, and rates are per-process.
- Health checks are performed by each process, resulting in more health checking traffic than strictly necessary and causing transient inconsistencies during state changes.
- The HAProxy Runtime API applies to a single process, so any Runtime API commands need to be sent to all individual processes.
By default, HAProxy will start with one process and one thread. To start more threads, you should set the option “nbthread” in the global configuration section. The option “nbthread” is compatible with “nbproc“, which means that it is even possible to start multiple HAProxy processes with multiple threads in each. Both the processes and threads should then also be mapped to CPU cores by using the configuration directive “cpu-map”. The configuration needed to run a single HAProxy process (1) with 4 threads (1-4) mapped to the first four CPU cores (0-3) can be translated with the following lines in haproxy.cfg:
global

  nbproc 1

  nbthread 4

  cpu-map auto:1/1-4 0-3
Instead of having one thread for the scheduler and several threads for the workers, the above allows us to run a scheduler in every thread. This has allowed the proven, high-performance, event-driven engine component of HAProxy to run per-thread and to remain essentially unchanged. Additionally, in this way, the multithreading behavior was made very similar to the multiprocess one as far as usage is concerned, but it comes without the multiprocess limitations.
Database Tier
Moodle features a database abstraction layer called XMLDB, that is, Moodle’s working code is the same in MySQL, MariaDB, MSSQL Server, Oracle and PostgreSQL. Based on the documentation on the official Moodle website, PostgreSQL is the preferred engine to host the Moodle database with large tables. However, we have seen many deployments that are using a much more complicated setup like Galera Cluster, InnoDB Cluster and MySQL/MariaDB replications, with the help of database load balancers in between.
In this section, we are going to cover only two of the most popular database servers, which is MySQL/MariaDB and PostgreSQL.
MySQL/MariaDB
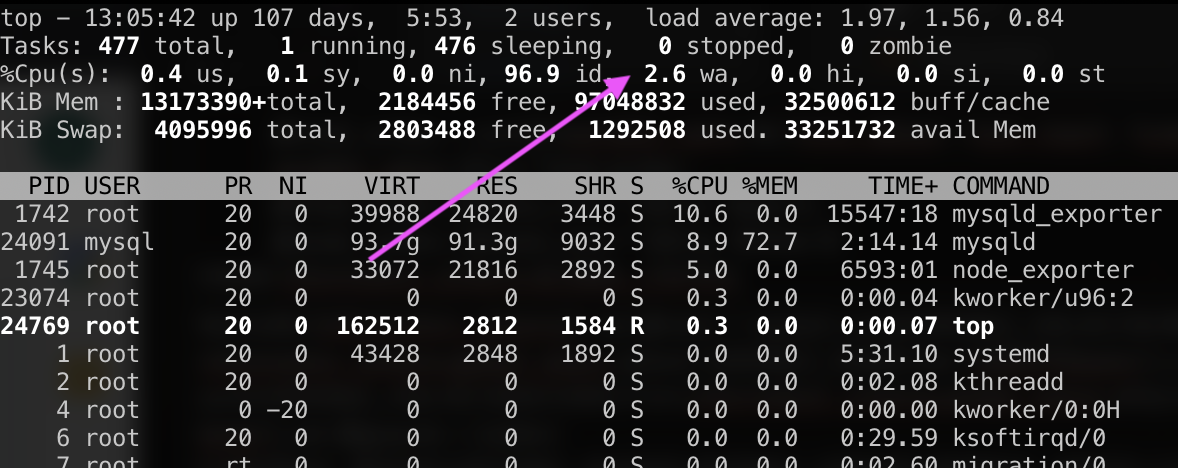
If the Unix top tool shows that the CPU usage percentage with your workload is less than 70%, your workload is probably disk-bound (disk IO becomes the bottleneck). For servers with multi-core, you should have a high value of close to 100% for every core. Monitor the CPU “wa” value as highlighted below:
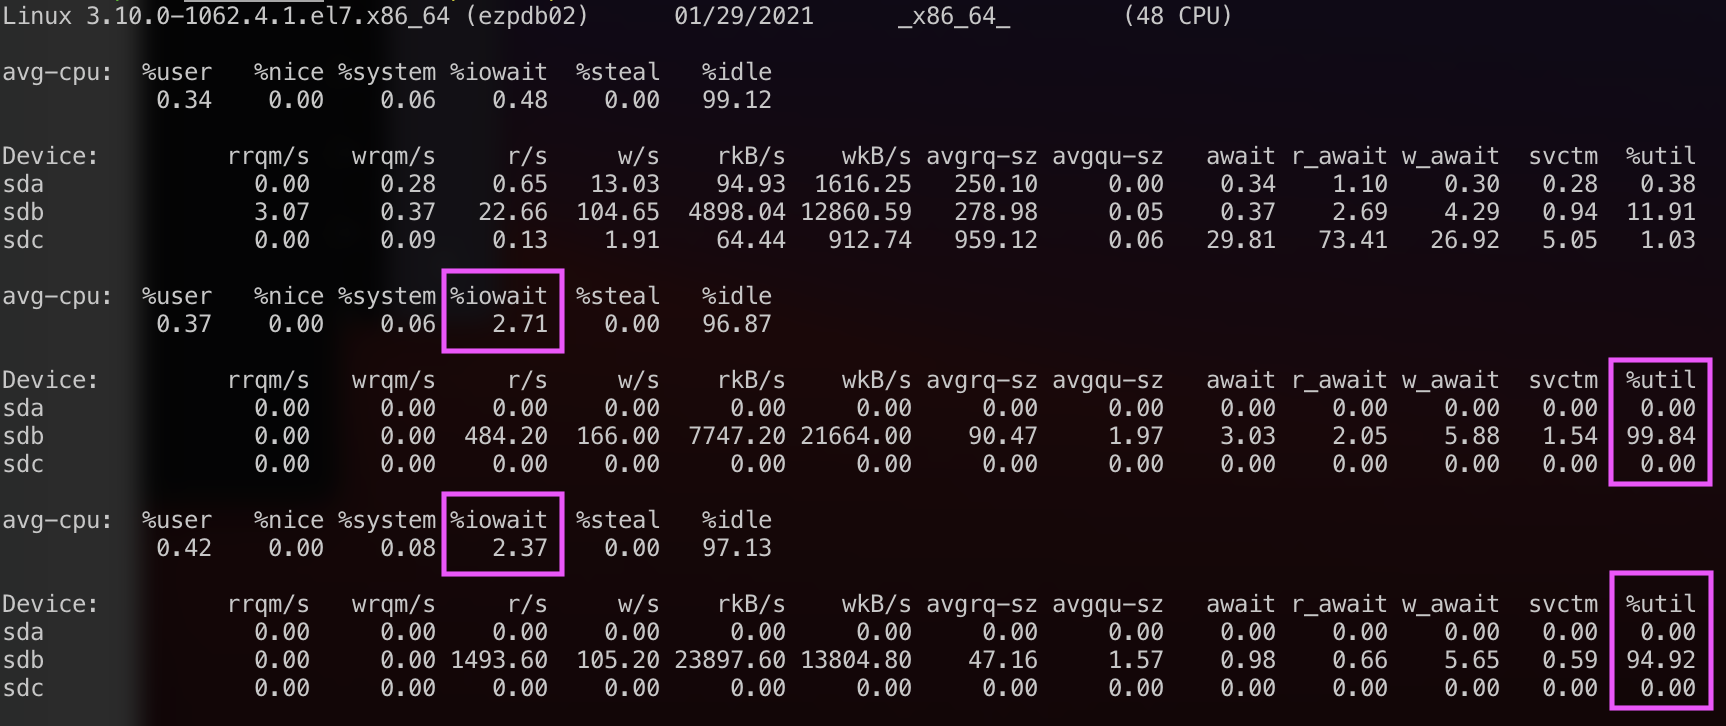
A decent RBMS server should have an average iowait value to be less than 1 most of the time. If the iowait is consistently higher, the disk may be the bottleneck. Use the iostat tool to see how the disk performs:
Maybe you are making too many transaction commits, or the InnoDB buffer pool (innodb_buffer_pool_size) is too small. In most cases, making the buffer pool bigger can help to reduce the IO load, especially for read operations. Do not set it equal to more than 80% of physical memory. The write operations still require flushing to the disk for durability purposes, which can be tuned with variable innodb_flush_log_at_trx_commit. The value of 1 is the safest option, but also the slowest.
Only after the bottleneck on disks is resolved, we can focus on maximizing the CPU resources. To make use of the available CPU cores, make sure that MySQL/MariaDB is configured with higher innodb_read_io_threads and innodb_write_io_threads. The default value is 4 with a maximum of 64. These variables should be used in conjunction with innodb_thread_concurrency=0. That way, InnoDB decides the best number of innodb_concurrency_tickets to open for a given MySQL instance setup. Once you set innodb_thread_concurrency to 0, you can set innodb_read_io_threads and innodb_write_io_threads (both since MySQL 5.1.38) to the maximum value of 64. This should engage more cores.
Currently, replication does not scale well on multi-core machines. The single slave thread executes replication events one by one and may not cope with a load produced by concurrent multiple client connections served by a separate master server’s CPU. There is an enhancement for the slave called multi-threaded replication (MTR) with version 5.6. MTR has since then been improved with MySQL 5.7. It still needs to be used with caution when not using GTID or you might get into trouble.
For more details on MySQL/MariaDB performance tuning, check out this blog post, MySQL Performance Cheat Sheet. For Galera Cluster, see Improve Performance of Galera Cluster for MySQL or MariaDB.
PostgreSQL
Similar to Apache, the PostgreSQL server is process-based (not threaded, like MySQL or MariaDB). Each database session connects to a single PostgreSQL operating system (OS) process. Multiple sessions are automatically spread across all available CPUs by the OS. The OS also uses CPUs to handle disk I/O and run other non-database tasks. Client applications can use threads, each of which connects to a separate database process. Therefore, on PostgreSQL systems, maximizing CPU is not really a concern if you have no bottlenecks on the disk subsystems (see the MySQL/MariaDB section to eliminate disk bottlenecks).
The shared_buffers parameter determines how much memory is dedicated to the server for caching data. The default value for this parameter is 128MB. The value should be set to 15% to 25% of the machine’s total RAM. For example, if the machine’s RAM size is 32 GB, then the recommended value for shared_buffers is 8 GB. Note that the database server needs to be restarted after this change.
The work_mem parameter provides the amount of memory to be used by internal sort operations and hash tables before writing to temporary disk files. Sort operations are used for order by, distinct, and merge join operations. Hash tables are used in hash joins and hash-based aggregation. The default value for this parameter is 4MB.
Setting the correct value of the work_mem parameter can result in less disk-swapping, and therefore far quicker queries. We can use the formula below to calculate the optimal work_mem value for the database server – total RAM x 0.25 / max_connections, where the max_connections parameter is the maximum number of concurrent connections to the database server. By default, it is set to 100 connections.
For more PostgreSQL performance tuning tips, check out this blog post, Tuning IO Operations in PostgreSQL.
File Storage Tier
Moodle utilizes a data directory called Moodledata directory. This directory holds all users’ static files managed by the Moodle system and usually is shared among many Moodle instances. Notice the file server should be set up with a centralized approach in Moodle. This means it can turn into a bottleneck very easily. Make sure the disk subsystem is relatively fast with SSDs and RAID with stripe configuration like RAID0 (not recommended) or RAID10 (stripe of mirrors – the safest). Despite RAID10 requiring at least 4 disks, it is much better to spend a bit more for the storage because it is not a straightforward process to scale if compared to other tiers.
In Linux journaled file systems like xfs and ext4, Linux records the access time for every disk read or write which negatively affects IO performance. This means that even reading data from a file triggers a write to disk. We can disable this by setting “noatime” mount option in /etc/fstab for the partition holding the Moodle data directory, for example:
/dev/sdb1 /storage/moodledata ext4 defaults,noatime 0 2The same configuration is also applicable for networked or clustered file systems like NFS, CephFS, GFS and OCFS2.
Cache Tier
Moodle supports integrations with key/value cache systems like Redis and Memcache to handle sessions and caches. We have covered this in this blog post, Using Redis to Offload Galera Cluster from Session Management Data in Moodle. Cache servers can significantly help Moodle to maximize database usage and improve locking performance resulting in higher concurrency.
Note that having Redis will increase the CPU usage of the server. Be aware especially If you want to co-locate Redis with the application or the database on the same server by making sure the server has enough CPUs. The best option is to run Redis on a standalone instance or use a clustered Redis solution called Redis Sentinel.
Final Thoughts
Maximizing the server resources will reduce the likelihood of wasting precious resources on a busy system, especially for non-dynamic environments like bare-metal servers, where the primary focus is performance and consistency.