blog
How to Run and Configure ProxySQL 2.0 for MySQL Galera Cluster on Docker

ProxySQL is an intelligent and high-performance SQL proxy which supports MySQL, MariaDB and ClickHouse. Recently, ProxySQL 2.0 has become GA and it comes with new exciting features such as GTID consistent reads, frontend SSL, Galera and MySQL Group Replication native support.
It is relatively easy to run ProxySQL as Docker container. We have previously written about how to run ProxySQL on Kubernetes as a helper container or as a Kubernetes service, which is based on ProxySQL 1.x. In this blog post, we are going to use the new version ProxySQL 2.x which uses a different approach for Galera Cluster configuration.
ProxySQL 2.x Docker Image
We have released a new ProxySQL 2.0 Docker image container and it’s available in Docker Hub. The README provides a number of configuration examples particularly for Galera and MySQL Replication, pre and post v2.x. The configuration lines can be defined in a text file and mapped into the container’s path at /etc/proxysql.cnf to be loaded into ProxySQL service.
The image “latest” tag still points to 1.x until ProxySQL 2.0 officially becomes GA (we haven’t seen any official release blog/article from ProxySQL team yet). Which means, whenever you install ProxySQL image using latest tag from Severalnines, you will still get version 1.x with it. Take note the new example configurations also enable ProxySQL web stats (introduced in 1.4.4 but still in beta) – a simple dashboard that summarizes the overall configuration and status of ProxySQL itself.
ProxySQL 2.x Support for Galera Cluster
Let’s talk about Galera Cluster native support in greater detail. The new mysql_galera_hostgroups table consists of the following fields:
- writer_hostgroup: ID of the hostgroup that will contain all the members that are writers (read_only=0).
- backup_writer_hostgroup: If the cluster is running in multi-writer mode (i.e. there are multiple nodes with read_only=0) and max_writers is set to a smaller number than the total number of nodes, the additional nodes are moved to this backup writer hostgroup.
- reader_hostgroup: ID of the hostgroup that will contain all the members that are readers (i.e. nodes that have read_only=1)
- offline_hostgroup: When ProxySQL monitoring determines a host to be OFFLINE, the host will be moved to the offline_hostgroup.
- active: a boolean value (0 or 1) to activate a hostgroup
- max_writers: Controls the maximum number of allowable nodes in the writer hostgroup, as mentioned previously, additional nodes will be moved to the backup_writer_hostgroup.
- writer_is_also_reader: When 1, a node in the writer_hostgroup will also be placed in the reader_hostgroup so that it will be used for reads. When set to 2, the nodes from backup_writer_hostgroup will be placed in the reader_hostgroup, instead of the node(s) in the writer_hostgroup.
- max_transactions_behind: determines the maximum number of writesets a node in the cluster can have queued before the node is SHUNNED to prevent stale reads (this is determined by querying the wsrep_local_recv_queue Galera variable).
- comment: Text field that can be used for any purposes defined by the user
Here is an example configuration for mysql_galera_hostgroups in table format:
Admin> select * from mysql_galera_hostgroupsG
*************************** 1. row ***************************
       writer_hostgroup: 10
backup_writer_hostgroup: 20
       reader_hostgroup: 30
      offline_hostgroup: 9999
                 active: 1
            max_writers: 1
  writer_is_also_reader: 2
max_transactions_behind: 20
                comment:
ProxySQL performs Galera health checks by monitoring the following MySQL status/variable:
- read_only – If ON, then ProxySQL will group the defined host into reader_hostgroup unless writer_is_also_reader is 1.
- wsrep_desync – If ON, ProxySQL will mark the node as unavailable, moving it to offline_hostgroup.
- wsrep_reject_queries – If this variable is ON, ProxySQL will mark the node as unavailable, moving it to the offline_hostgroup (useful in certain maintenance situations).
- wsrep_sst_donor_rejects_queries – If this variable is ON, ProxySQL will mark the node as unavailable while the Galera node is serving as an SST donor, moving it to the offline_hostgroup.
- wsrep_local_state – If this status returns other than 4 (4 means Synced), ProxySQL will mark the node as unavailable and move it into offline_hostgroup.
- wsrep_local_recv_queue – If this status is higher than max_transactions_behind, the node will be shunned.
- wsrep_cluster_status – If this status returns other than Primary, ProxySQL will mark the node as unavailable and move it into offline_hostgroup.
Having said that, by combining these new parameters in mysql_galera_hostgroups together with mysql_query_rules, ProxySQL 2.x has the flexibility to fit into much more Galera use cases. For example, one can have a single-writer, multi-writer and multi-reader hostgroups defined as the destination hostgroup of a query rule, with the ability to limit the number of writers and finer control on the stale reads behaviour.
Contrast this to ProxySQL 1.x, where the user had to explicitly define a scheduler to call an external script to perform the backend health checks and update the database servers state. This requires some customization to the script (user has to update the ProxySQL admin user/password/port) plus it depended on an additional tool (MySQL client) to connect to ProxySQL admin interface.
Here is an example configuration of Galera health check script scheduler in table format for ProxySQL 1.x:
Admin> select * from schedulerG
*************************** 1. row ***************************
         id: 1
     active: 1
interval_ms: 2000
   filename: /usr/share/proxysql/tools/proxysql_galera_checker.sh
       arg1: 10
       arg2: 20
       arg3: 1
       arg4: 1
       arg5: /var/lib/proxysql/proxysql_galera_checker.log
    comment:
Besides, since ProxySQL scheduler thread executes any script independently, there are many versions of health check scripts available out there. All ProxySQL instances deployed by ClusterControl uses the default script provided by the ProxySQL installer package.
In ProxySQL 2.x, max_writers and writer_is_also_reader variables can determine how ProxySQL dynamically groups the backend MySQL servers and will directly affect the connection distribution and query routing. For example, consider the following MySQL backend servers:
Admin> select hostgroup_id, hostname, status, weight from mysql_servers;
+--------------+--------------+--------+--------+
| hostgroup_id | hostname     | status | weight |
+--------------+--------------+--------+--------+
| 10           | DB1          | ONLINE | 1      |
| 10           | DB2          | ONLINE | 1      |
| 10           | DB3          | ONLINE | 1      |
+--------------+--------------+--------+--------+
Together with the following Galera hostgroups definition:
Admin> select * from mysql_galera_hostgroupsG
*************************** 1. row ***************************
       writer_hostgroup: 10
backup_writer_hostgroup: 20
       reader_hostgroup: 30
      offline_hostgroup: 9999
                 active: 1
            max_writers: 1
  writer_is_also_reader: 2
max_transactions_behind: 20
                comment:
Considering all hosts are up and running, ProxySQL will most likely group the hosts as below:
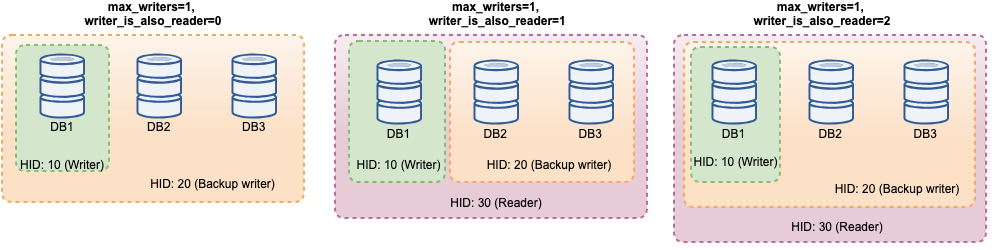
Let’s look at them one by one:
| Configuration | Description |
|---|---|
| writer_is_also_reader=0 |
|
| writer_is_also_reader=1 |
|
| writer_is_also_reader=2 |
|
With this configuration, one can have various choices for hostgroup destination to cater for specific workloads. “Hotspot” writes can be configured to go to only one server to reduce multi-master conflicts, non-conflicting writes can be distributed equally on the other masters, most reads can be distributed evenly on all MySQL servers or non-writers, critical reads can be forwarded to the most up-to-date servers and analytical reads can be forwarded to a slave replica.
ProxySQL Deployment for Galera Cluster
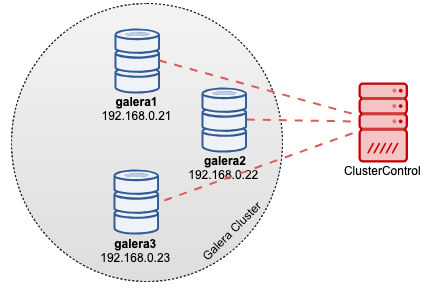
In this example, suppose we already have a three-node Galera Cluster deployed by ClusterControl as shown in the following diagram:
Our WordPress applications are running on Docker while the WordPress database is hosted on our Galera Cluster running on bare-metal servers. We decided to run a ProxySQL container alongside our WordPress containers to have a better control on WordPress database query routing and fully utilize our database cluster infrastructure. Since the read-write ratio is around 80%-20%, we want to configure ProxySQL to:
- Forward all writes to one Galera node (less conflict, focus on write)
- Balance all reads to the other two Galera nodes (better distribution for the majority of the workload)
Firstly, create a ProxySQL configuration file inside the Docker host so we can map it into our container:
$ mkdir /root/proxysql-docker
$ vim /root/proxysql-docker/proxysql.cnf
Then, copy the following lines (we will explain the configuration lines further down):
datadir="/var/lib/proxysql"

admin_variables=
{
    admin_credentials="admin:admin"
    mysql_ifaces="0.0.0.0:6032"
    refresh_interval=2000
    web_enabled=true
    web_port=6080
    stats_credentials="stats:admin"
}

mysql_variables=
{
    threads=4
    max_connections=2048
    default_query_delay=0
    default_query_timeout=36000000
    have_compress=true
    poll_timeout=2000
    interfaces="0.0.0.0:6033;/tmp/proxysql.sock"
    default_schema="information_schema"
    stacksize=1048576
    server_version="5.1.30"
    connect_timeout_server=10000
    monitor_history=60000
    monitor_connect_interval=200000
    monitor_ping_interval=200000
    ping_interval_server_msec=10000
    ping_timeout_server=200
    commands_stats=true
    sessions_sort=true
    monitor_username="proxysql"
    monitor_password="proxysqlpassword"
    monitor_galera_healthcheck_interval=2000
    monitor_galera_healthcheck_timeout=800
}

mysql_galera_hostgroups =
(
    {
        writer_hostgroup=10
        backup_writer_hostgroup=20
        reader_hostgroup=30
        offline_hostgroup=9999
        max_writers=1
        writer_is_also_reader=1
        max_transactions_behind=30
        active=1
    }
)

mysql_servers =
(
    { address="db1.cluster.local" , port=3306 , hostgroup=10, max_connections=100 },
    { address="db2.cluster.local" , port=3306 , hostgroup=10, max_connections=100 },
    { address="db3.cluster.local" , port=3306 , hostgroup=10, max_connections=100 }
)

mysql_query_rules =
(
    {
        rule_id=100
        active=1
        match_pattern="^SELECT .* FOR UPDATE"
        destination_hostgroup=10
        apply=1
    },
    {
        rule_id=200
        active=1
        match_pattern="^SELECT .*"
        destination_hostgroup=30
        apply=1
    },
    {
        rule_id=300
        active=1
        match_pattern=".*"
        destination_hostgroup=10
        apply=1
    }
)

mysql_users =
(
    { username = "wordpress", password = "passw0rd", default_hostgroup = 10, transaction_persistent = 0, active = 1 },
    { username = "sbtest", password = "passw0rd", default_hostgroup = 10, transaction_persistent = 0, active = 1 }
)
Now, let’s pay a visit to some of the most configuration sections. Firstly, we define the Galera hostgroups configuration as below:
mysql_galera_hostgroups =
(
    {
        writer_hostgroup=10
        backup_writer_hostgroup=20
        reader_hostgroup=30
        offline_hostgroup=9999
        max_writers=1
        writer_is_also_reader=1
        max_transactions_behind=30
        active=1
    }
)
Hostgroup 10 will be the writer_hostgroup, hostgroup 20 for backup_writer and hostgroup 30 for reader. We set max_writers to 1 so we can have a single-writer hostgroup for hostgroup 10 where all writes should be sent to. Then, we define writer_is_also_reader to 1 which will make all Galera nodes as reader as well, suitable for queries that can be equally distributed to all nodes. Hostgroup 9999 is reserved for offline_hostgroup if ProxySQL detects unoperational Galera nodes.
Then, we configure our MySQL servers with default to hostgroup 10:
mysql_servers =
(
    { address="db1.cluster.local" , port=3306 , hostgroup=10, max_connections=100 },
    { address="db2.cluster.local" , port=3306 , hostgroup=10, max_connections=100 },
    { address="db3.cluster.local" , port=3306 , hostgroup=10, max_connections=100 }
)
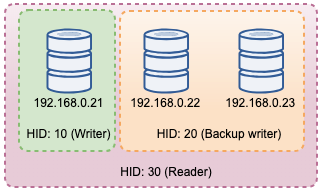
With the above configurations, ProxySQL will “see” our hostgroups as below:
Then, we define the query routing through query rules. Based on our requirement, all reads should be sent to all Galera nodes except the writer (hostgroup 20) and everything else is forwarded to hostgroup 10 for single writer:
mysql_query_rules =
(
    {
        rule_id=100
        active=1
        match_pattern="^SELECT .* FOR UPDATE"
        destination_hostgroup=10
        apply=1
    },
    {
        rule_id=200
        active=1
        match_pattern="^SELECT .*"
        destination_hostgroup=20
        apply=1
    },
    {
        rule_id=300
        active=1
        match_pattern=".*"
        destination_hostgroup=10
        apply=1
    }
)
Finally, we define the MySQL users that will be passed through ProxySQL:
mysql_users =
(
    { username = "wordpress", password = "passw0rd", default_hostgroup = 10, transaction_persistent = 0, active = 1 },
    { username = "sbtest", password = "passw0rd", default_hostgroup = 10, transaction_persistent = 0, active = 1 }
)
We set transaction_persistent to 0 so all connections coming from these users will respect the query rules for reads and writes routing. Otherwise, the connections would end up hitting one hostgroup which defeats the purpose of load balancing. Do not forget to create those users first on all MySQL servers. For ClusterControl user, you may use Manage -> Schemas and Users feature to create those users.
We are now ready to start our container. We are going to map the ProxySQL configuration file as bind mount when starting up the ProxySQL container. Thus, the run command will be:
$ docker run -d
--name proxysql2
--hostname proxysql2
--publish 6033:6033
--publish 6032:6032
--publish 6080:6080
--restart=unless-stopped
-v /root/proxysql/proxysql.cnf:/etc/proxysql.cnf
severalnines/proxysql:2.0
Finally, change the WordPress database pointing to ProxySQL container port 6033, for instance:
$ docker run -d
--name wordpress
--publish 80:80
--restart=unless-stopped
-e WORDPRESS_DB_HOST=proxysql2:6033
-e WORDPRESS_DB_USER=wordpress
-e WORDPRESS_DB_HOST=passw0rd
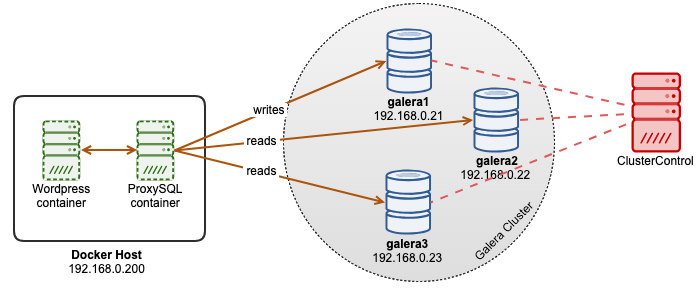
wordpressAt this point, our architecture is looking something like this:
If you want ProxySQL container to be persistent, map /var/lib/proxysql/ to a Docker volume or bind mount, for example:
$ docker run -d
--name proxysql2
--hostname proxysql2
--publish 6033:6033
--publish 6032:6032
--publish 6080:6080
--restart=unless-stopped
-v /root/proxysql/proxysql.cnf:/etc/proxysql.cnf
-v proxysql-volume:/var/lib/proxysql
severalnines/proxysql:2.0
Keep in mind that running with persistent storage like the above will make our /root/proxysql/proxysql.cnf obsolete on the second restart. This is due to ProxySQL multi-layer configuration whereby if /var/lib/proxysql/proxysql.db exists, ProxySQL will skip loading options from configuration file and load whatever is in the SQLite database instead (unless you start proxysql service with –initial flag). Having said that, the next ProxySQL configuration management has to be performed via ProxySQL admin console on port 6032, instead of using configuration file.
Monitoring
ProxySQL process log by default logging to syslog and you can view them by using standard docker command:
$ docker ps
$ docker logs proxysql2
To verify the current hostgroup, query the runtime_mysql_servers table:
$ docker exec -it proxysql2 mysql -uadmin -padmin -h127.0.0.1 -P6032 --prompt='Admin> '
Admin> select hostgroup_id,hostname,status from runtime_mysql_servers;
+--------------+--------------+--------+
| hostgroup_id | hostname | status |
+--------------+--------------+--------+
| 10 | 192.168.0.21 | ONLINE |
| 30 | 192.168.0.21 | ONLINE |
| 30 | 192.168.0.22 | ONLINE |
| 30 | 192.168.0.23 | ONLINE |
| 20 | 192.168.0.22 | ONLINE |
| 20 | 192.168.0.23 | ONLINE |
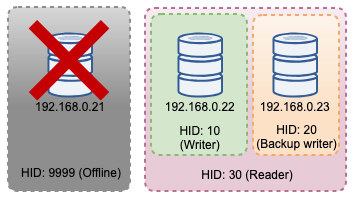
+--------------+--------------+--------+If the selected writer goes down, it will be transferred to the offline_hostgroup (HID 9999):
Admin> select hostgroup_id,hostname,status from runtime_mysql_servers;
+--------------+--------------+--------+
| hostgroup_id | hostname     | status |
+--------------+--------------+--------+
| 10           | 192.168.0.22 | ONLINE |
| 9999         | 192.168.0.21 | ONLINE |
| 30           | 192.168.0.22 | ONLINE |
| 30           | 192.168.0.23 | ONLINE |
| 20           | 192.168.0.23 | ONLINE |
+--------------+--------------+--------+
The above topology changes can be illustrated in the following diagram:
We have also enabled the web stats UI with admin-web_enabled=true.To access the web UI, simply go to the Docker host in port 6080, for example: http://192.168.0.200:8060 and you will be prompted with username/password pop up. Enter the credentials as defined under admin-stats_credentials and you should see the following page:
By monitoring MySQL connection pool table, we can get connection distribution overview for all hostgroups:
Admin> select hostgroup, srv_host, status, ConnUsed, MaxConnUsed, Queries from stats.stats_mysql_connection_pool order by srv_host;
+-----------+--------------+--------+----------+-------------+---------+
| hostgroup | srv_host     | status | ConnUsed | MaxConnUsed | Queries |
+-----------+--------------+--------+----------+-------------+---------+
| 20        | 192.168.0.23 | ONLINE | 5        | 24          | 11458   |
| 30        | 192.168.0.23 | ONLINE | 0        | 0           | 0       |
| 20        | 192.168.0.22 | ONLINE | 2        | 24          | 11485   |
| 30        | 192.168.0.22 | ONLINE | 0        | 0           | 0       |
| 10        | 192.168.0.21 | ONLINE | 32       | 32          | 9746    |
| 30        | 192.168.0.21 | ONLINE | 0        | 0           | 0       |
+-----------+--------------+--------+----------+-------------+---------+
The output above shows that hostgroup 30 does not process anything because our query rules do not have this hostgroup configured as destination hostgroup.
The statistics related to the Galera nodes can be viewed in the mysql_server_galera_log table:
Admin>  select * from mysql_server_galera_log order by time_start_us desc limit 3G
*************************** 1. row ***************************
                       hostname: 192.168.0.23
                           port: 3306
                  time_start_us: 1552992553332489
                success_time_us: 2045
              primary_partition: YES
                      read_only: NO
         wsrep_local_recv_queue: 0
              wsrep_local_state: 4
                   wsrep_desync: NO
           wsrep_reject_queries: NO
wsrep_sst_donor_rejects_queries: NO
                          error: NULL
*************************** 2. row ***************************
                       hostname: 192.168.0.22
                           port: 3306
                  time_start_us: 1552992553329653
                success_time_us: 2799
              primary_partition: YES
                      read_only: NO
         wsrep_local_recv_queue: 0
              wsrep_local_state: 4
                   wsrep_desync: NO
           wsrep_reject_queries: NO
wsrep_sst_donor_rejects_queries: NO
                          error: NULL
*************************** 3. row ***************************
                       hostname: 192.168.0.21
                           port: 3306
                  time_start_us: 1552992553329013
                success_time_us: 2715
              primary_partition: YES
                      read_only: NO
         wsrep_local_recv_queue: 0
              wsrep_local_state: 4
                   wsrep_desync: NO
           wsrep_reject_queries: NO
wsrep_sst_donor_rejects_queries: NO
                          error: NULL
The resultset returns the related MySQL variable/status state for every Galera node for a particular timestamp. In this configuration, we configured the Galera health check to run every 2 seconds (monitor_galera_healthcheck_interval=2000). Hence, the maximum failover time would be around 2 seconds if a topology change happens to the cluster.