blog
How to Monitor Your ProxySQL with Prometheus and ClusterControl

ClusterControl 1.7.0 introduces a bold new feature – integration with Prometheus for agent-based monitoring. We called this SCUMM (Severalnines ClusterControl Unified Management and Monitoring). In the previous versions, the monitoring tasks were solely performed agentlessly. If you wonder how ClusterControl performs its monitoring functions, check out this documentation page.
ProxySQL, a high performance reverse-proxy which understands MySQL protocols, commonly sits on top of MySQL Replication and Galera Cluster to act as a gateway to the backend MySQL service. It can be configured as a query router, query firewall, query caching, traffic dispatcher and many more. ProxySQL also collects and exposes key metrics via its STATS schema which is very useful to analyze performance and understand what actually happens behind the scenes. Visit our comprehensive tutorial for ProxySQL to learn more about it.
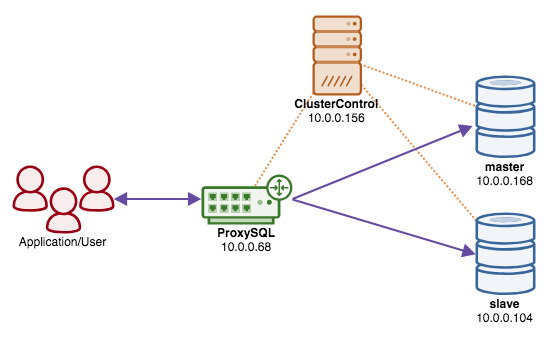
In this blog post, we are going to look into monitoring the ProxySQL instances in-depth with this new approach. In this example, we have a ProxySQL instance on top of our two-node MySQL Replication (1 master, 1 slave), deployed via ClusterControl. Our high-level architecture looks something like this:
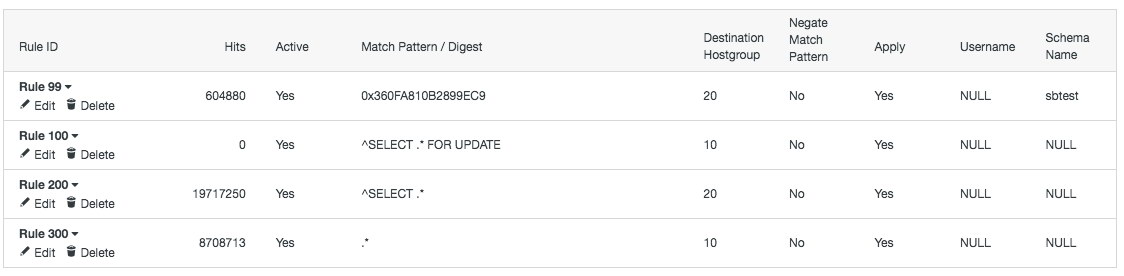
We also have the following query rules defined in the ProxySQL instance (just for reference, to make sense of the collected monitoring metrics further down):
Enabling Prometheus
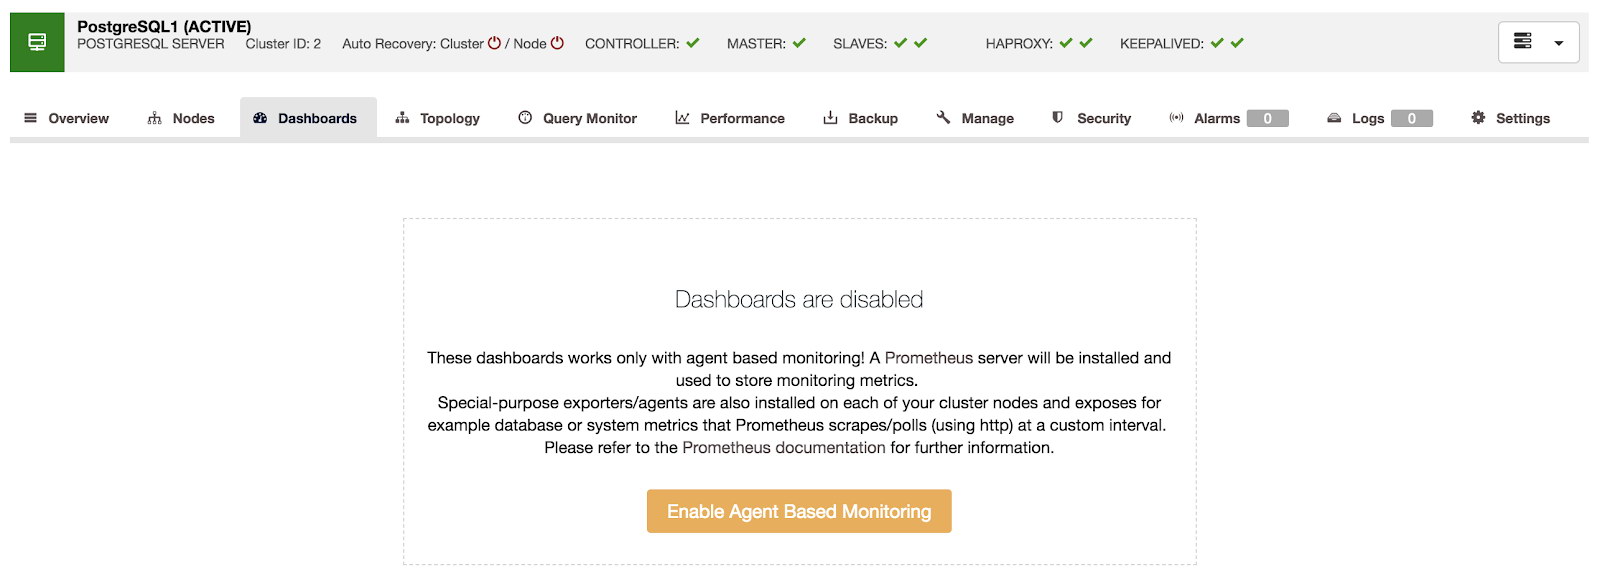
ClusterControl’s agent-based monitoring is enabled per cluster. ClusterControl can deploy a new Prometheus server for you, or use an existing Prometheus server (deployed by ClusterControl for other cluster). Enabling Prometheus is pretty straightforward. Just go to ClusterControl -> pick the cluster -> Dashboards -> Enable Agent Based Monitoring:
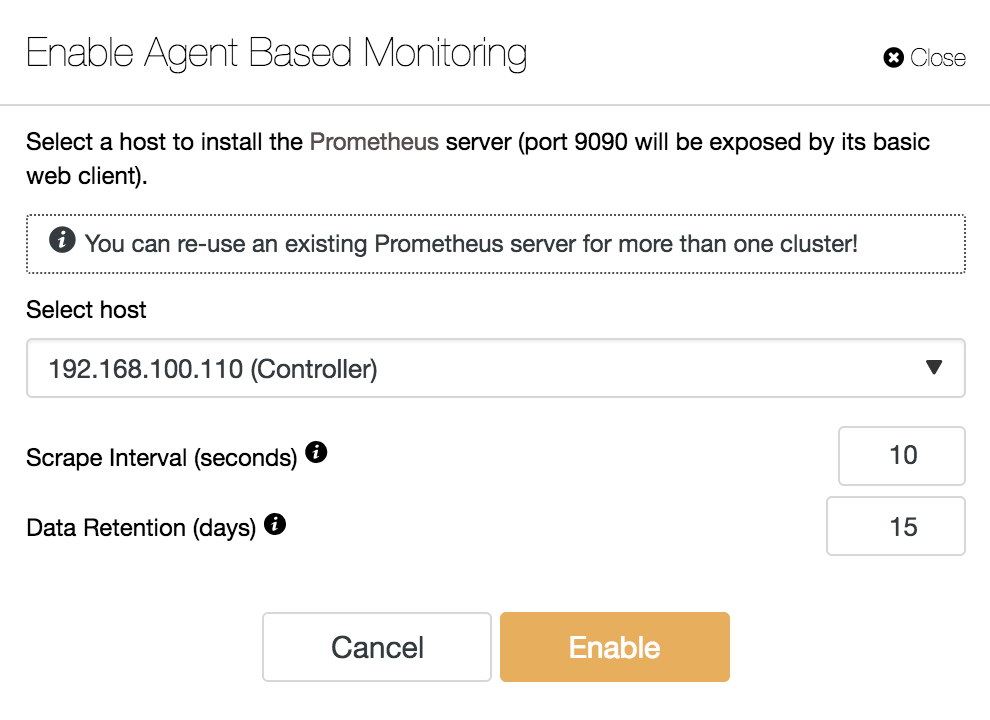
Then, specify the IP address or hostname of the new Prometheus server, or just pick an existing Prometheus host from the dropdown:
ClusterControl will install and configure the necessary packages (Prometheus on the Prometheus server, exporters on the database and ProxySQL nodes), connect to the Prometheus as data source and start visualizing the monitoring data in the UI.
Once the deployment job finishes, you should be able to access the Dashboards tab as shown in the next section.
ProxySQL Dashboard
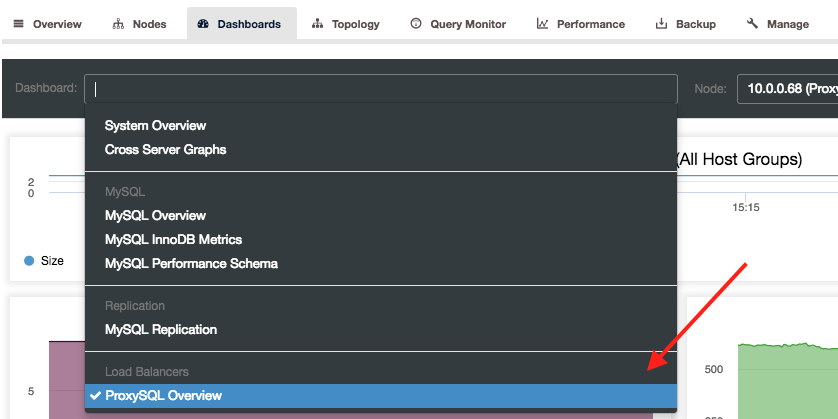
You can access the ProxySQL Dashboards by going to the respective cluster under Dashboards tab. Clicking on the Dashboard dropdown will list out dashboards related to our cluster (MySQL Replication). You can find the ProxySQL Overview dashboard under the “Load Balancers” section:
There are a number of panels for ProxySQL, some of them are self-explanatory. Nevertheless, let’s visit them one by one.
Hostgroup Size
Hostgroup size is simply the total number of host on all hostgroups:
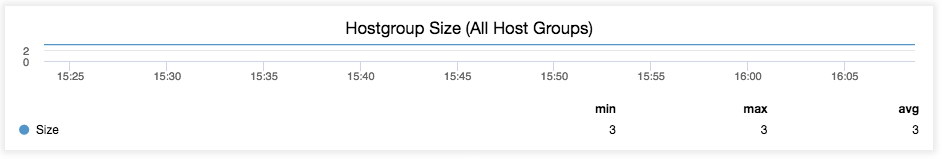
In this case, we have two hostgroups – 10 (writer) and 20 (reader). Hostgroup 10 consists of one host (master) while hostgroup 20 has two hosts (master and slave), which sums up to a total of three hosts.
Unless you change the hostgroup configuration (introduce new host, removing existing host) from ProxySQL, you should expect that nothing will change in this graph.
Client Connections
The number of client connection being processed by ProxySQL for all hostgroups:
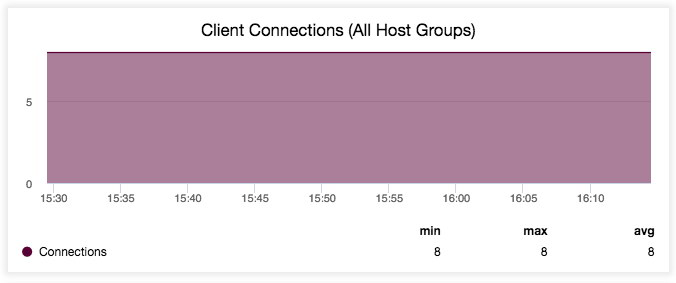
The above graph simply tells us that there are consistently 8 MySQL clients connected to our ProxySQL instance on port 6033 for the last 45 minutes (you can change this under the “Range Selection” option). If you stop connecting your application to ProxySQL (or bypass it), the value should eventually drop to 0.
Client Questions
The graph visualizes the number of Questions being processed by ProxySQL for all hostgroups:
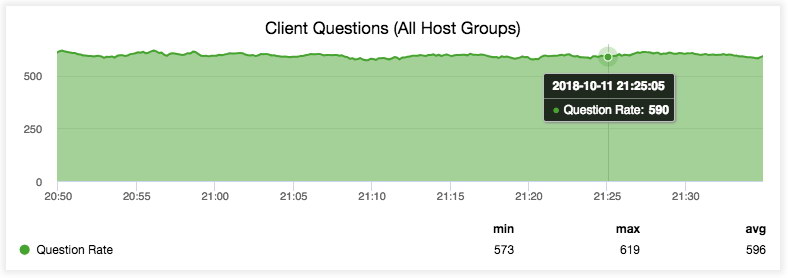
According to MySQL documentation, Questions are simply the number of statements executed by the server. This includes only statements sent to the server by clients and not statements executed within stored programs, unlike the Queries variable. This variable does not count COM_PING, COM_STATISTICS, COM_STMT_PREPARE, COM_STMT_CLOSE, or COM_STMT_RESET commands. Again, if you stop connecting your application to ProxySQL (or bypass it), the value should drop to 0.
Active Backend Connections
The number of connections that ProxySQL maintains to the backend MySQL servers per host:
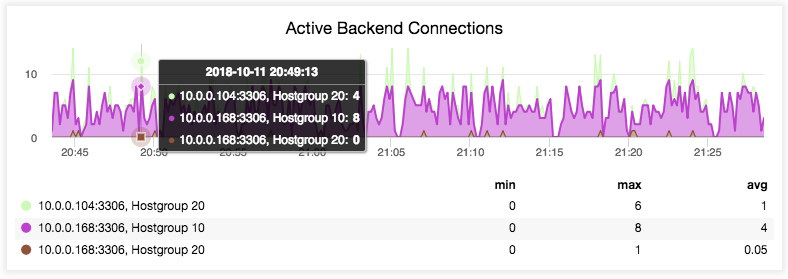
It simply tells us how many connections are currently being used by ProxySQL for sending queries to the backend server. As long as the max value is not close to the connection limit for the particular server (set via max_connections when the server is added into ProxySQL hostgroup), we are in a good shape.
Failed Backend Connections
The number of connections that were not established successfully by ProxySQL:
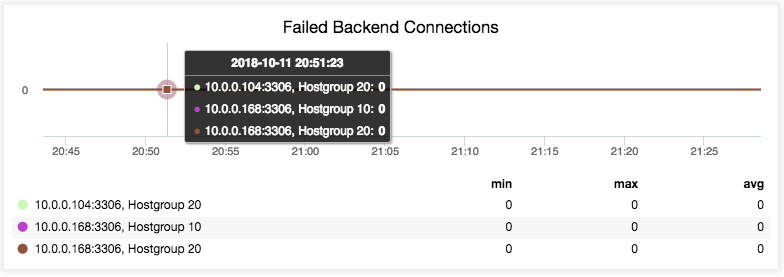
The above example simply shows that no backend connection failure happened in the last 45 minutes.
Queries Routed
This graph provides insight on the distribution of incoming statements to the backend servers:
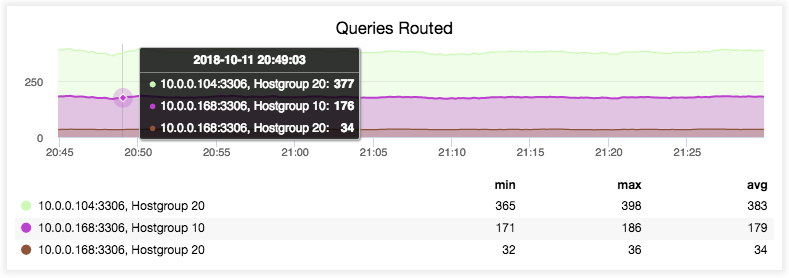
As you can see, most of the reads are going to the reader hostgroup (HG20). From here we can understand the balancing pattern being performed by ProxySQL which matches our query rules in this read-intensive workload.
Connection Free
The graph shows how many connections are currently free:
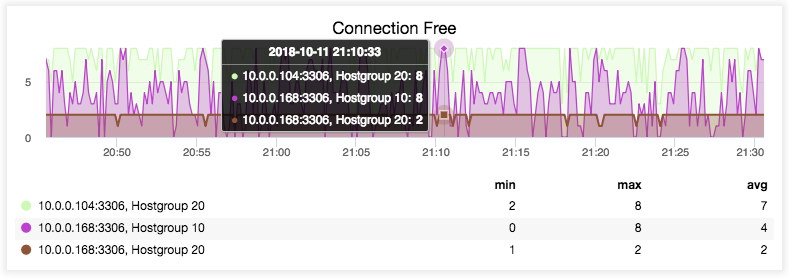
The connections are kept open in order to minimize the time cost of sending a query to the backend server.
Latency
The current ping time in microseconds, as reported from ProxySQL monitoring thread:
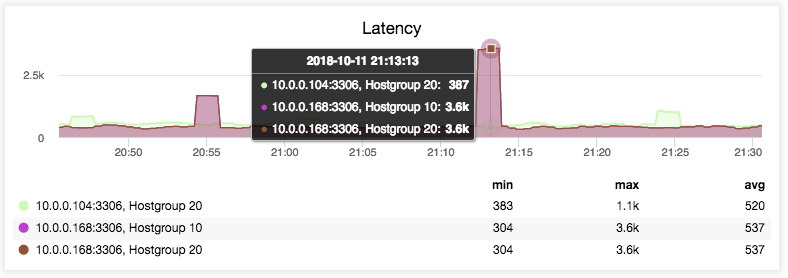
This simply tells us how stable the connection is from the ProxySQL to the backend MySQL servers. High value for a long consistent time mostly indicates network issue between them.
Query Cache Memory
This graph visualizes memory consumption of queries that are being cached by ProxySQL:
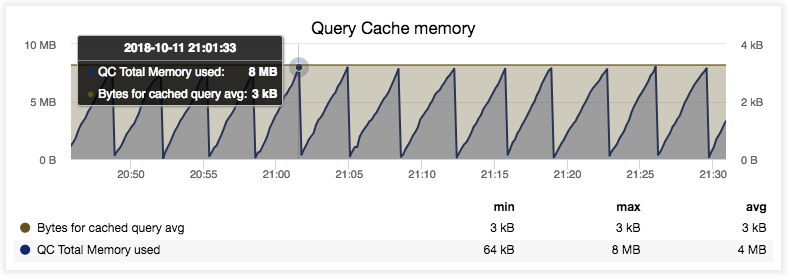
From the graph above, we can tell that ProxySQL consumes a total amount of 8MB of memory by the query cache. After it reaches 8MB limit (configurable via mysql-query_cache_size_MB variable), the memory will be purged by ProxySQL’s purge thread. This graph will not be populated if you have no query cache rule defined.
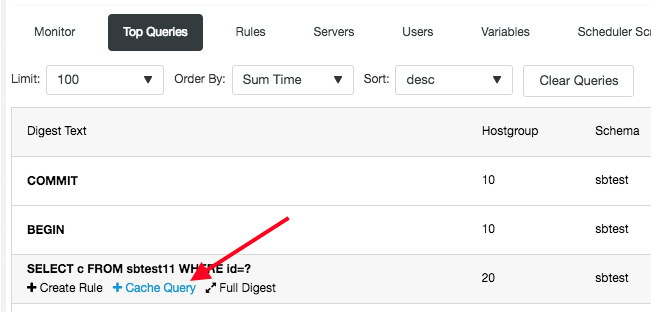
By the way, caching a query in ProxySQL can be done in just two clicks with ClusterControl. Go to the ProxySQL’s Top Queries page, rollover on a query, click Query Cache and click on “Add Rule”:
Query Cache Efficiency
This graph visualizes the efficiency of cached queries:
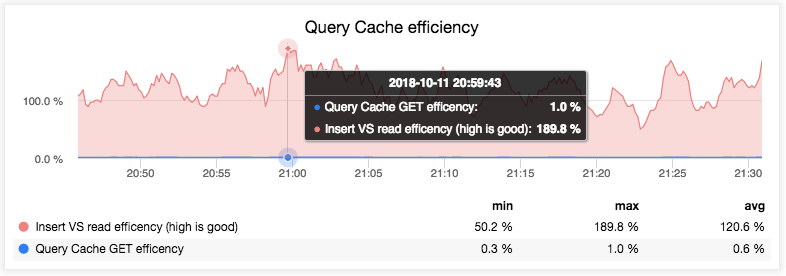
The blue line tells us the successful ratio of GET requests executed against the Query Cache where the resultset was present and not expired. The pink line shows the ratio of data written (insert) into or read from the Query Cache. In this case, our data read from Query Cache is higher from data written indicating an efficient cache configuration.
This graph will not be populated if you have no query cache rule defined.
Network Traffic
This graph visualizes the network traffic (data receive + data sent) from/to the backend MySQL servers, per host:
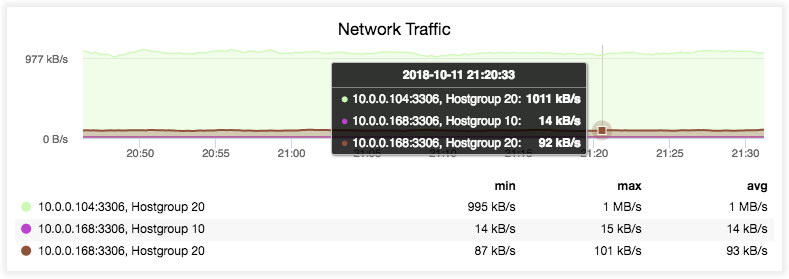
The above screenshot tells us that a significant amount of traffic is being forwarded/received from/to the reader hostgroup (HG20). In this read-intensive workload, read operations commonly consume a much higher traffic mainly due to the result set size of the SELECT statements.
Only a smaller ratio of the traffic is forwarded/received from/to the write hostgroup (HG10), which is expected since the write operations usually consume less network traffic with significantly small result set being returned to the clients.
Mirrorring Efficiency
The graph simply shows the traffic mirroring related status like Mirror_concurrency vs Mirror_queue_length:
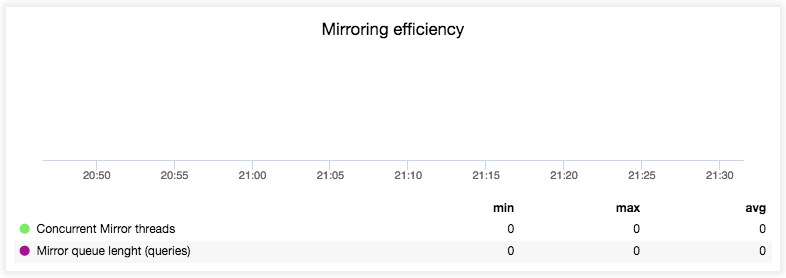
The graph is only populated if you have configured traffic mirroring (mirror_hostgroup inside query rule). If the mirror queue is picking up, reducing the mirroring concurrency limit will increase the mirroring efficiency, which can be controlled via mysql-mirror_max_concurrency variable. In simple words, the zero queue entries is what the most efficient mirroring is all about.
Memory Utilization
The graph illustrates the memory utilization by main components inside ProxySQL – connection pool, query cache and persistent storage (SQLite):
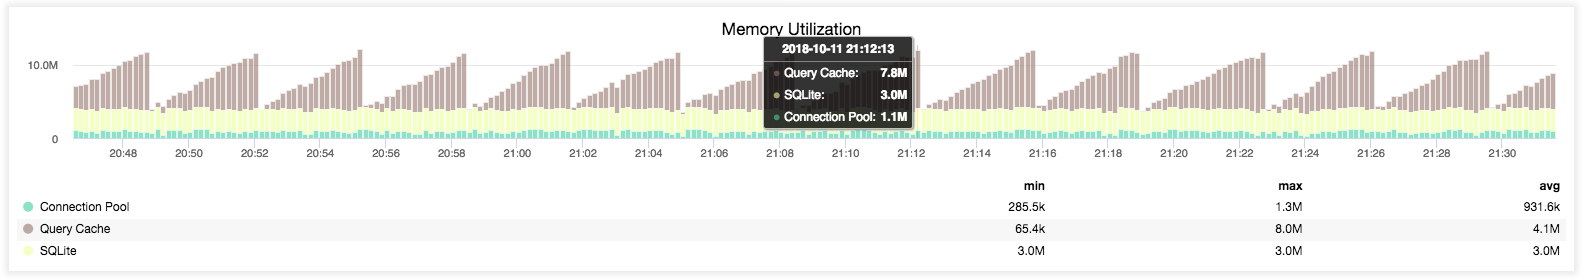
The above screenshot tells us that ProxySQL memory footprint is rather small which is less than 12 MB in total. The connection pool only consumes 1.3 MB tops to accommodate our 8-thread (clients) workload. With more free RAM available on the host, we should be able to increase the number of client connections to ProxySQL by three-fold to four-fold or cache much more hot queries inside ProxySQL to offload our MySQL backend servers.
Bonus Feature – Node Performance
ClusterControl 1.7.0 now includes host performance metrics for the ProxySQL instances. In the previous version, ClusterControl only monitored the ProxySQL related metrics as exposed by ProxySQL stats schema. This new feature can be accessed under the Node’s tab -> ProxySQL instance -> Node Performance:
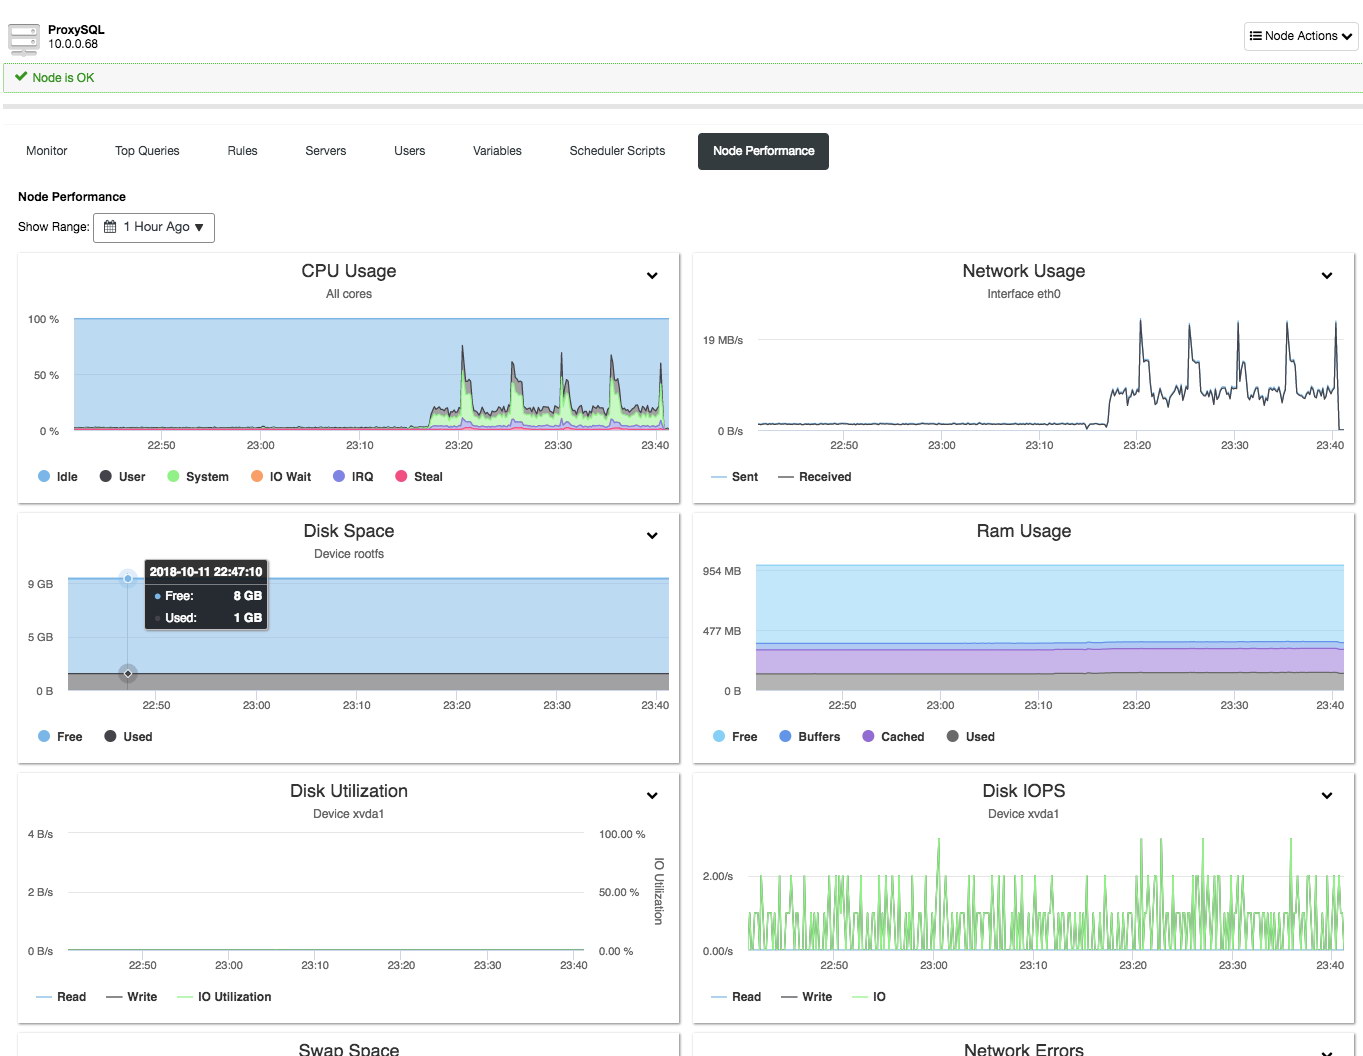
The histograms provide insight to the key host metrics, similar to what are being sampled for database nodes under Nodes -> Overview section. If your ProxySQL instance is co-located in the same server with the application, you are literally using ClusterControl to monitor the application server as well. How cool is that?!
Final Thoughts
ClusterControl integration with Prometheus offers an alternative way to monitor and analyze your database stack, up until the reverse-proxy tier. You now have a choice to offload the monitoring jobs to Prometheus, or keep on using the default ClusterControl agentless monitoring approach for your database infrastructure.