blog
How Performant is Your ProxySQL Node?

ProxySQL has gained a lot of interest right now in the MySQL and MariaDB database world, not to mention ClickHouse which helps make the case for ProxySQL.
It’s safe to say that ProxySQL has become the default database proxy for the MySQL family of databases (such as Percona Server, Oracle MySQL, Galera Cluster or even with MariaDB).
ProxySQL is, in fact, an efficient problem solver with extremely rich functionalities that manage database client-server communication; acting as the middleware in a very advanced and performant approach.
It has made possible the ability to shape the database traffic by delaying, caching, or rewriting queries on the fly. It can also be used to create an environment in which failovers will not affect applications and will be transparent to them. The ProxySQL community is very responsive and constantly builds fixes, patches, and version releases on a timely basis.
But how performant is your ProxySQL setup, and how can you determine that your setup has been tuned correctly? This blog focuses on determining how performant your ProxySQL nodes are and how to monitor it efficiently.
Common Problems You Can Encounter With ProxySQL
ProxySQL’s default installation comes with a light-weight, simple tuning tool that is able to handle average to heavy load. Although this can depend on the type of queries sent to the middleware, it can impact and start to experience bottlenecks and latency.
Latency Issues
For example, what can lead to latency issues can be hard to determine if you lack a monitoring system. Likewise, you can manually monitor or check the stats schema just like below:
mysql> select * from stats_mysql_connection_poolG

*************************** 1. row ***************************

        hostgroup: 20

         srv_host: 192.168.10.225

         srv_port: 3306

           status: ONLINE

         ConnUsed: 0

         ConnFree: 0

           ConnOK: 0

          ConnERR: 0

      MaxConnUsed: 0

          Queries: 0

Queries_GTID_sync: 0

  Bytes_data_sent: 0

  Bytes_data_recv: 0

       Latency_us: 1151

*************************** 2. row ***************************

        hostgroup: 20

         srv_host: 192.168.10.226

         srv_port: 3306

           status: ONLINE

         ConnUsed: 0

         ConnFree: 0

           ConnOK: 0

          ConnERR: 0

      MaxConnUsed: 0

          Queries: 0

Queries_GTID_sync: 0

  Bytes_data_sent: 0

  Bytes_data_recv: 0

       Latency_us: 470

*************************** 3. row ***************************

        hostgroup: 10

         srv_host: 192.168.10.227

         srv_port: 3306

           status: ONLINE

         ConnUsed: 0

         ConnFree: 0

           ConnOK: 0

          ConnERR: 0

      MaxConnUsed: 0

          Queries: 0

Queries_GTID_sync: 0

  Bytes_data_sent: 0

  Bytes_data_recv: 0

       Latency_us: 10855

*************************** 4. row ***************************

        hostgroup: 40

         srv_host: 192.168.10.225

         srv_port: 3306

           status: ONLINE

         ConnUsed: 0

         ConnFree: 0

           ConnOK: 0

          ConnERR: 0

      MaxConnUsed: 0

          Queries: 0

Queries_GTID_sync: 0

  Bytes_data_sent: 0

  Bytes_data_recv: 0

       Latency_us: 1151

*************************** 5. row ***************************

        hostgroup: 40

         srv_host: 192.168.10.226

         srv_port: 3306

           status: ONLINE

         ConnUsed: 0

         ConnFree: 0

           ConnOK: 0

          ConnERR: 0

      MaxConnUsed: 0

          Queries: 0

Queries_GTID_sync: 0

  Bytes_data_sent: 0

  Bytes_data_recv: 0

       Latency_us: 470

5 rows in set (0.01 sec)
This allows you to monitor latency based on the hostgroup. But it adds up the hassle unless you have to innovate and develop a script(s) that will manage to notify you.
Client Connection Errors
Maximum connection timeout due to maximum connections in the backend (database node itself) can lead you to perplexity if you are not able to determine what’s the main source of the problem. You can check the stats database though to check for such aborted connections in the client or even the server and it’s denied connections as follows,
mysql> select * from stats.stats_mysql_global where variable_name like '%connect%';

+-------------------------------------+----------------+

| Variable_Name                       | Variable_Value |

+-------------------------------------+----------------+

| Client_Connections_aborted          | 0 |

| Client_Connections_connected        | 205 |

| Client_Connections_created          | 10067 |

| Server_Connections_aborted          | 44 |

| Server_Connections_connected        | 30 |

| Server_Connections_created          | 14892 |

| Server_Connections_delayed          | 0 |

| Client_Connections_non_idle         | 205 |

| Access_Denied_Max_Connections       | 0 |

| Access_Denied_Max_User_Connections  | 0 |

| MySQL_Monitor_connect_check_OK      | 41350 |

| MySQL_Monitor_connect_check_ERR     | 92 |

| max_connect_timeouts                | 0 |

| Client_Connections_hostgroup_locked | 0              |

| mysql_killed_backend_connections    | 0 |

+-------------------------------------+----------------+

15 rows in set (0.01 sec)
It’s also ideal if you can verify and check the backend user’s max number of connections to see what are the number of connection limits it can open or use. For example, I have the following in my test,
mysql> select username, active, transaction_persistent, max_connections from mysql_users;

+---------------+--------+------------------------+-----------------+

| username      | active | transaction_persistent | max_connections |

+---------------+--------+------------------------+-----------------+

| proxydemo     | 1 | 1                   | 10000 |

| proxysql-paul | 1      | 1 | 10000           |

+---------------+--------+------------------------+-----------------+

2 rows in set (0.00 sec)
Slow Queries
Identifying the slow queries cannot be that difficult in ProxySQL, but it can be inefficient if done manually. You can check this if doing manual with the variable,
mysql> select * from stats_mysql_global where  variable_name like '%slow%';

+---------------+----------------+

| Variable_Name | Variable_Value |

+---------------+----------------+

| Slow_queries  | 2 |

+---------------+----------------+

1 row in set (0.00 sec)
While that can provide you some numbers, you might check on the table stats_mysql_query_digest under the stats schema if you want to dig deeper. For example below,
mysql> select count_star,sum_time,(sum_time/count_star)/1000 as average_time_ms,digest_text

    -> from stats_mysql_query_digest

    -> where count_star > 100 order by average_time_ms desc limit 10;

+------------+----------+-----------------+--------------------------------------+

| count_star | sum_time | average_time_ms | digest_text                          |

+------------+----------+-----------------+--------------------------------------+

| 884        | 15083961 | 17              | UPDATE sbtest1 SET k=k+? WHERE id=?  |

| 930        | 16000111 | 17              | UPDATE sbtest9 SET k=k+? WHERE id=?  |

| 914        | 15695810 | 17              | UPDATE sbtest4 SET k=k+? WHERE id=?  |

| 874        | 14467420 | 16              | UPDATE sbtest8 SET k=k+? WHERE id=?  |

| 904        | 15294520 | 16              | UPDATE sbtest3 SET k=k+? WHERE id=?  |

| 917        | 15228077 | 16              | UPDATE sbtest6 SET k=k+? WHERE id=?  |

| 907        | 14613238 | 16              | UPDATE sbtest2 SET k=k+? WHERE id=?  |

| 900        | 15113004 | 16              | UPDATE sbtest5 SET k=k+? WHERE id=?  |

| 917        | 15299381 | 16              | UPDATE sbtest7 SET k=k+? WHERE id=?  |

| 883        | 15010119 | 16              | UPDATE sbtest10 SET k=k+? WHERE id=? |

+------------+----------+-----------------+--------------------------------------+

10 rows in set (0.01 sec)
which catches top 10 slow queries based on a sampling by 100.
Memory Utilization
Hardware items such as CPU, Disk, and Memory have to be monitored to ensure that your ProxySQL is performant. However, the most crucial thing is the memory, as ProxySQL will utilize heavily in the memory due to the query cache mechanism. By default, the query cache, which is dependent on the variable mysql-query_cache_size_MB defaults to 256 Mib. With that regard, it can come to a situation where it uses memory and you need to determine and diagnose if you find issues within your ProxySQL node or even being noticed within the application layer.
When identifying this, you might end up checking the tables in the stats_history and stats schemas. You can see the list of tables which can help you during diagnosis,
mysql> show tables from stats;

| stats_memory_metrics                 |

19 rows in set (0.00 sec)

or,

mysql> show tables from stats_history;

+------------------------+

| tables                 |

+------------------------+

| mysql_connections      |

| mysql_connections_day  |

| mysql_connections_hour |

| mysql_query_cache      |

| mysql_query_cache_day  |

| mysql_query_cache_hour |

| system_cpu             |

| system_cpu_day         |

| system_cpu_hour        |

| system_memory          |

| system_memory_day      |

| system_memory_hour     |

+------------------------+

15 rows in set (0.00 sec)
Efficiently Determining The Performance of your ProxySQL
There are multiple ways to determine the performance of your ProxySQL node. Using ClusterControl offers you the ability to determine this with simple yet straightforward graphs. For example, when ProxySQL is integrated into your cluster, you’ll be able to set your query rules, change user’s max_connections, determine the top queries, change a user host group, and provide you the performance of your ProxySQL node. See the screenshots below…
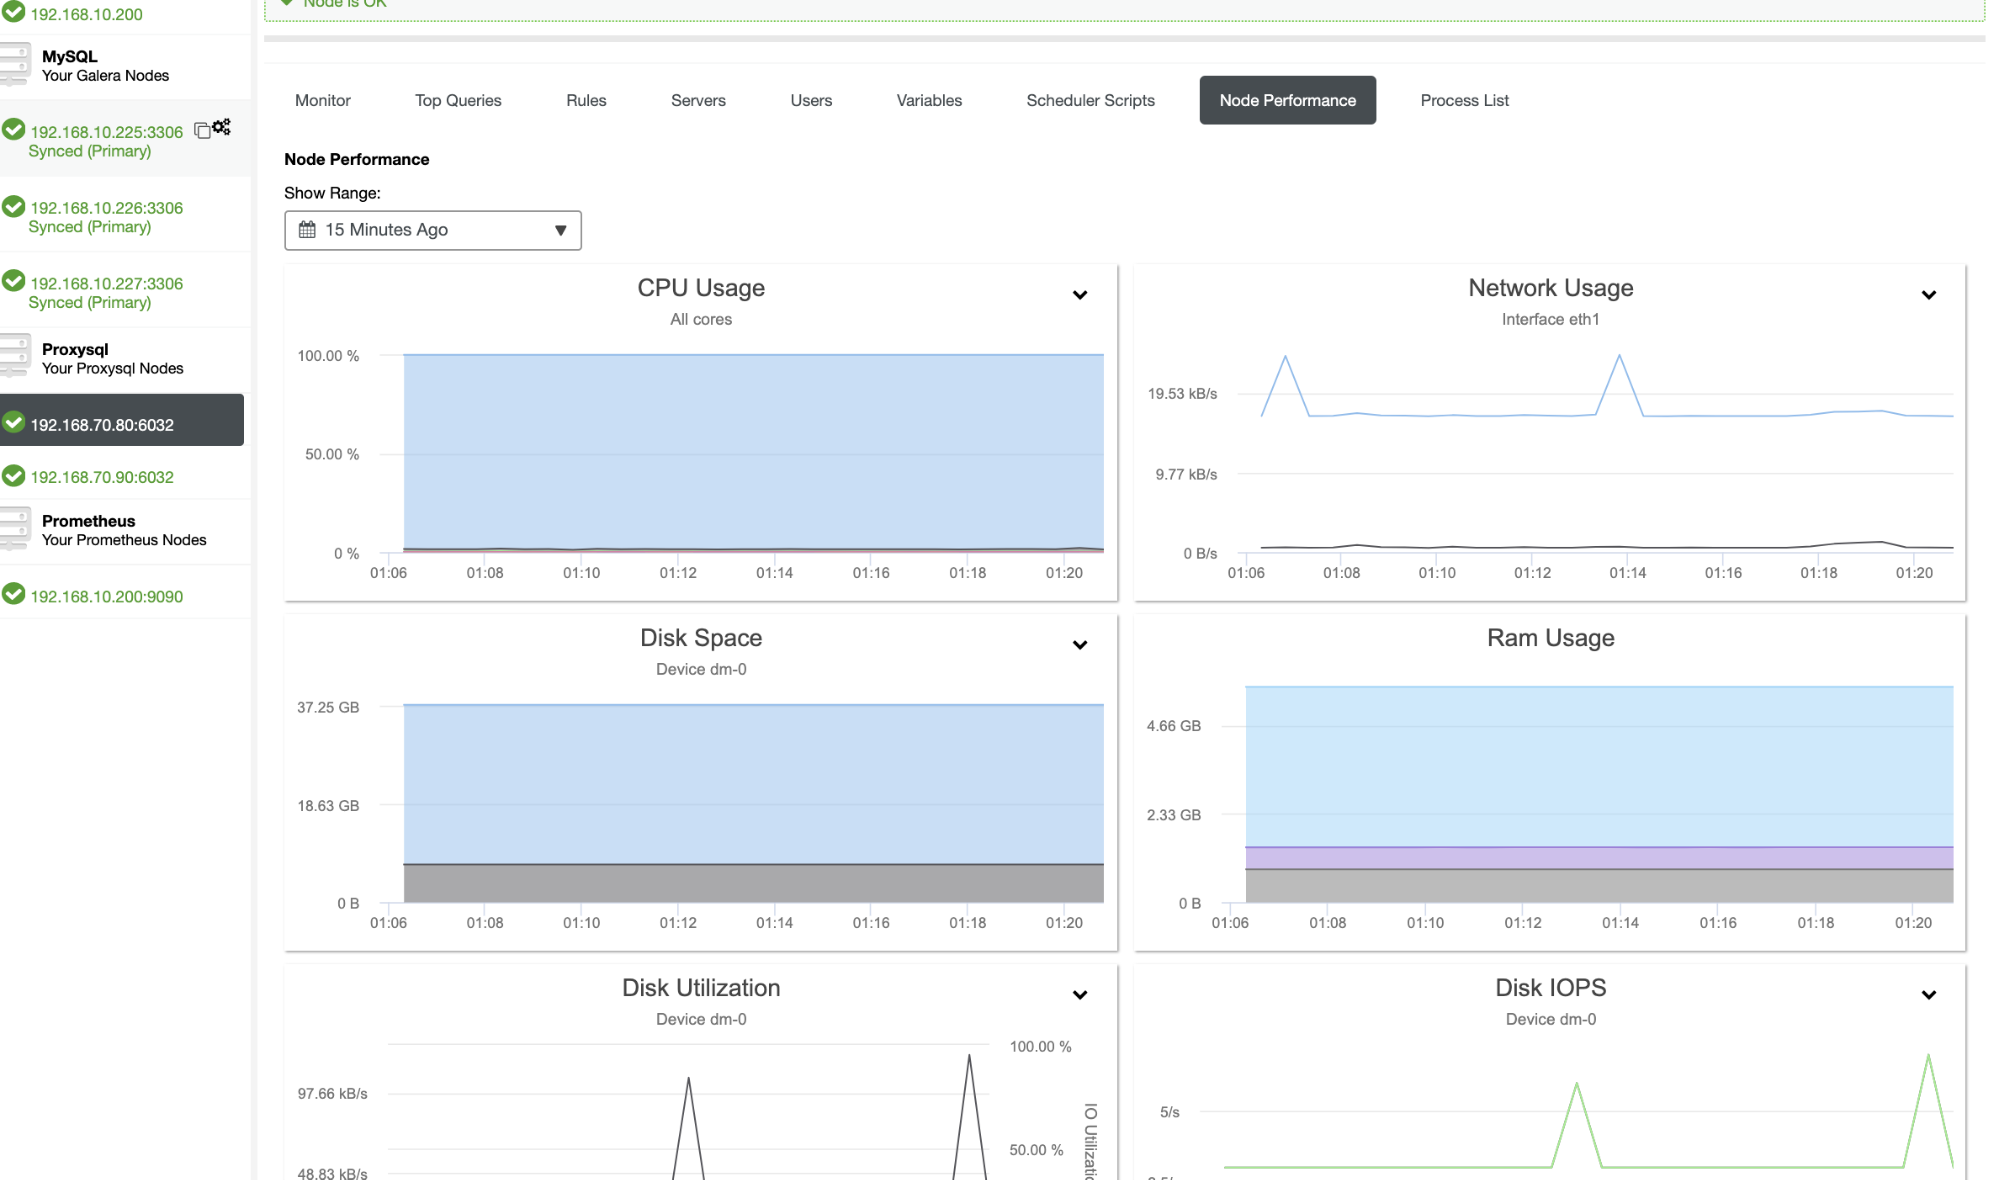
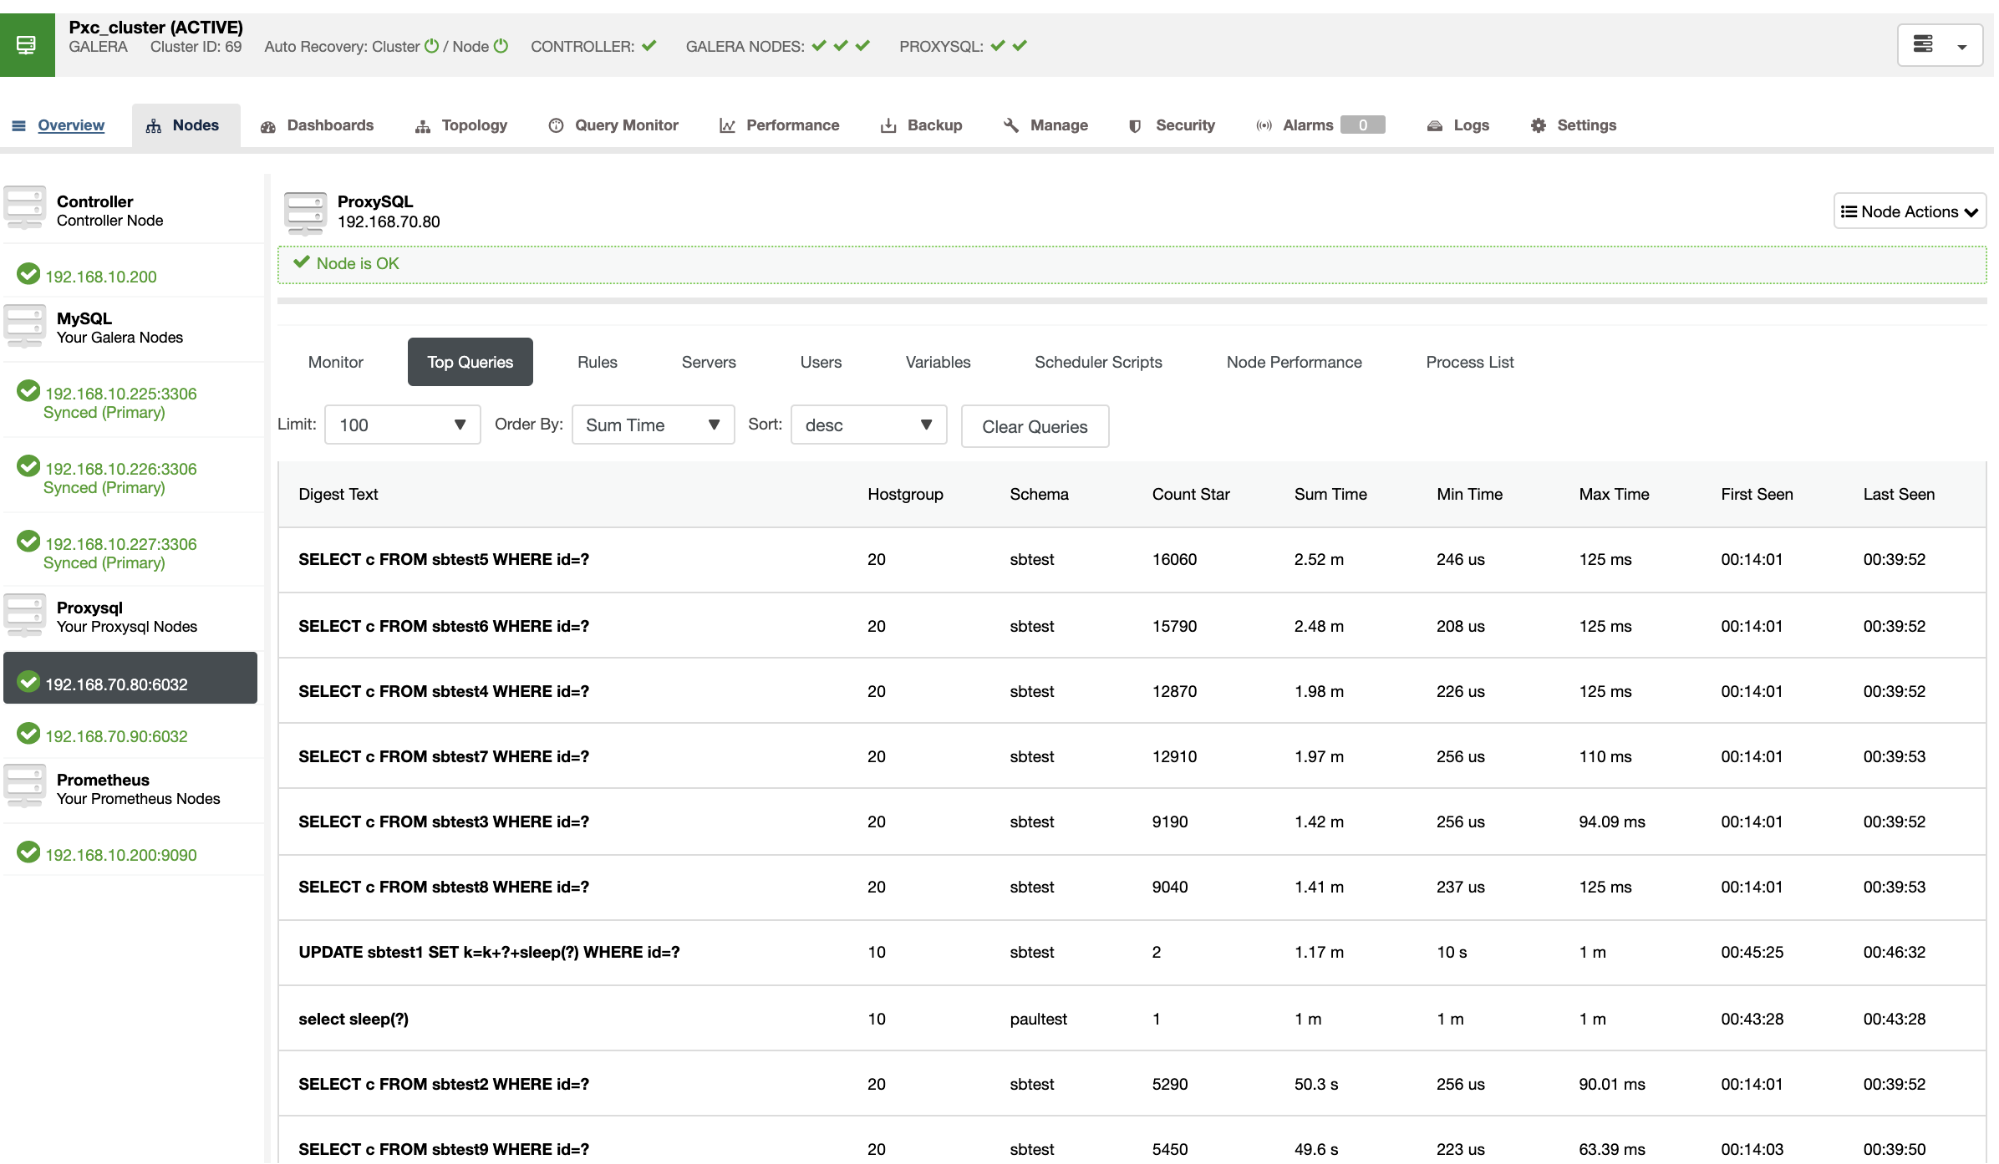
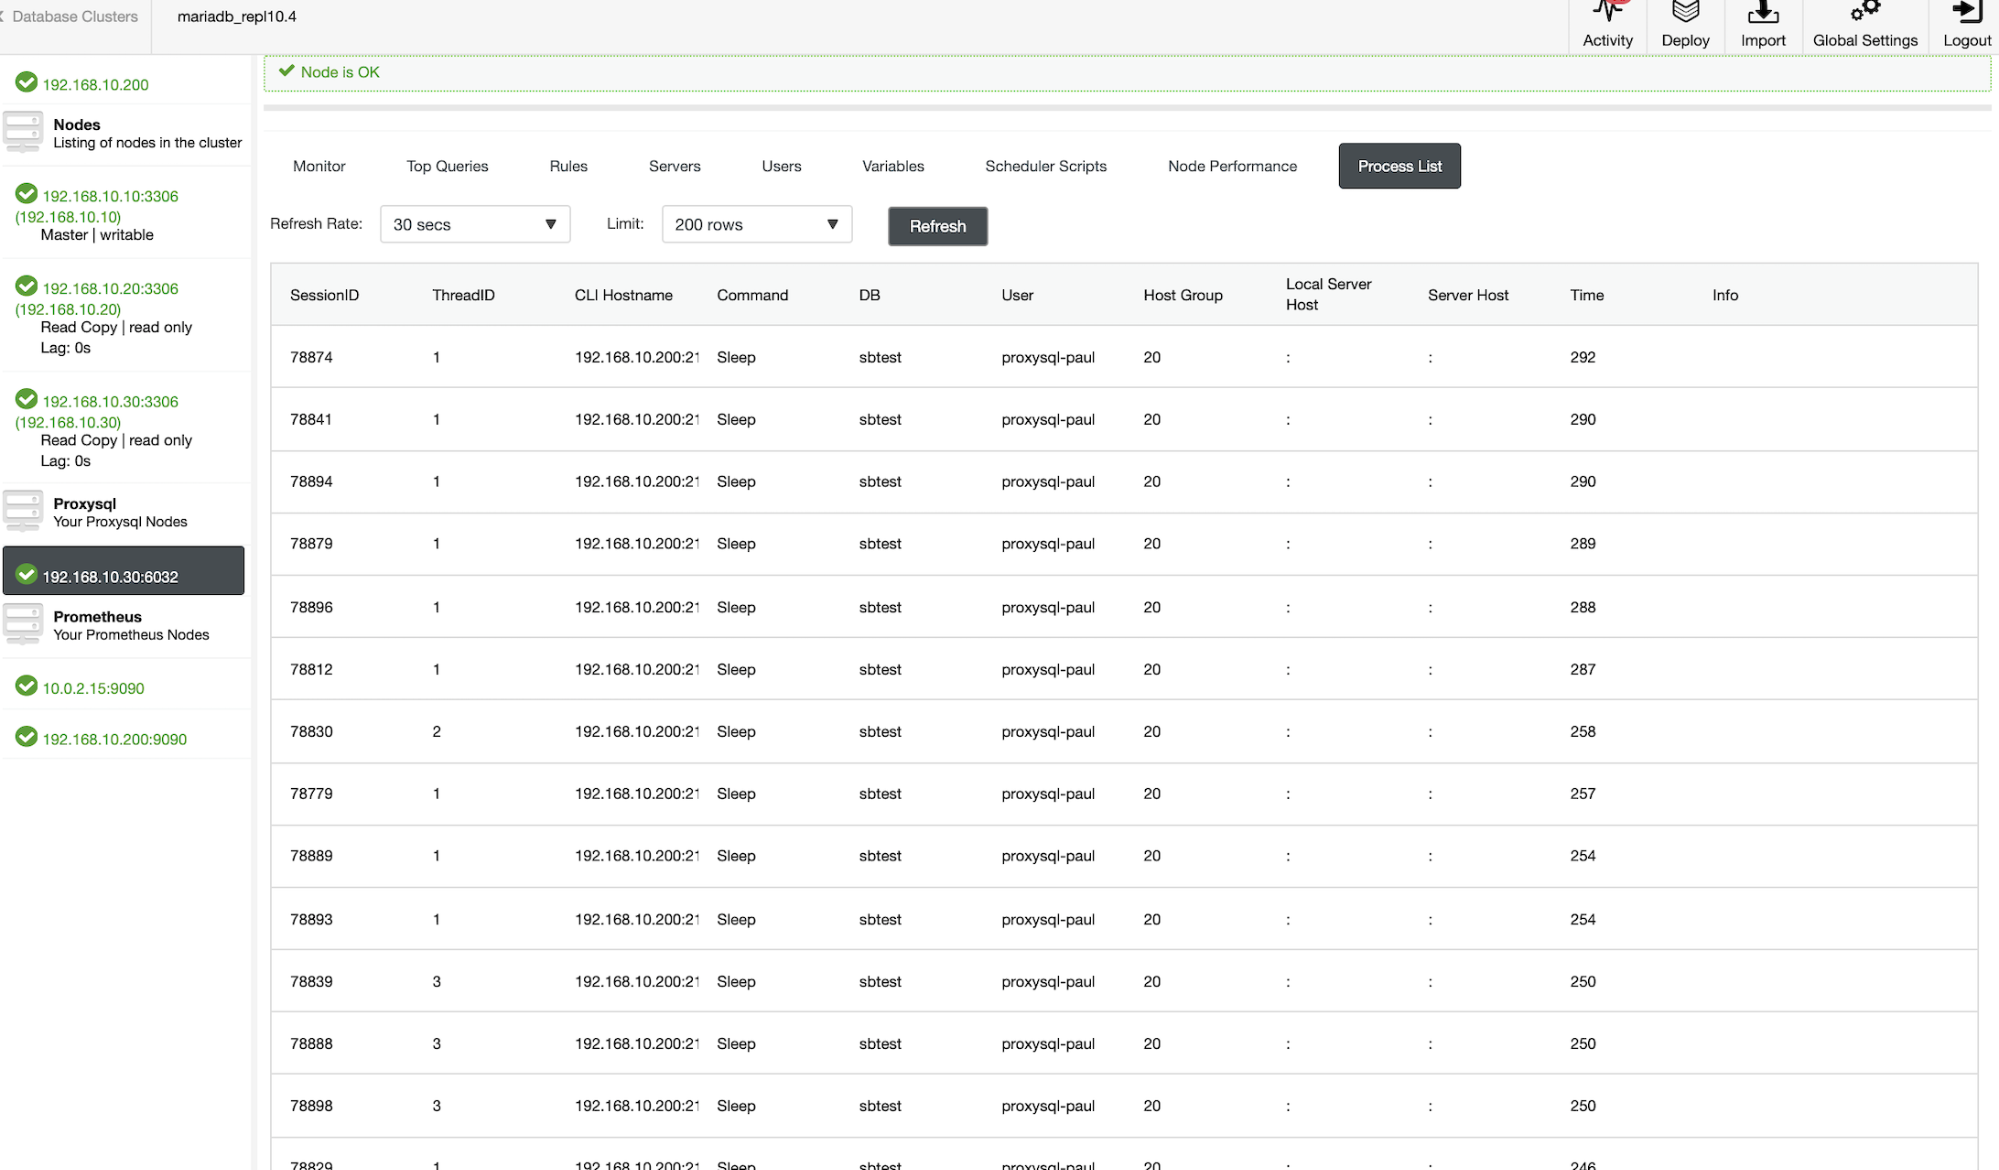
All you see is the proof of how proficiently ClusterControl can give you insights of the performance of your ProxySQL node. But this does not limit you to that. ClusterControl also has rich and powerful dashboards we call SCUMM, which includes ProxySQL Overview dashboard.
If you intend to determine slow queries, you can simply take a glance to the dashboard. Checking your latency distribution over the different hostgroups where your backend nodes are assigned helps you to have a quick insight of the performance based on distribution. You can monitor the client and server connections, providing you query cache insights. Most importantly and not the least, it gives you the memory utilization that ProxySQL node is using. See the graphs below…
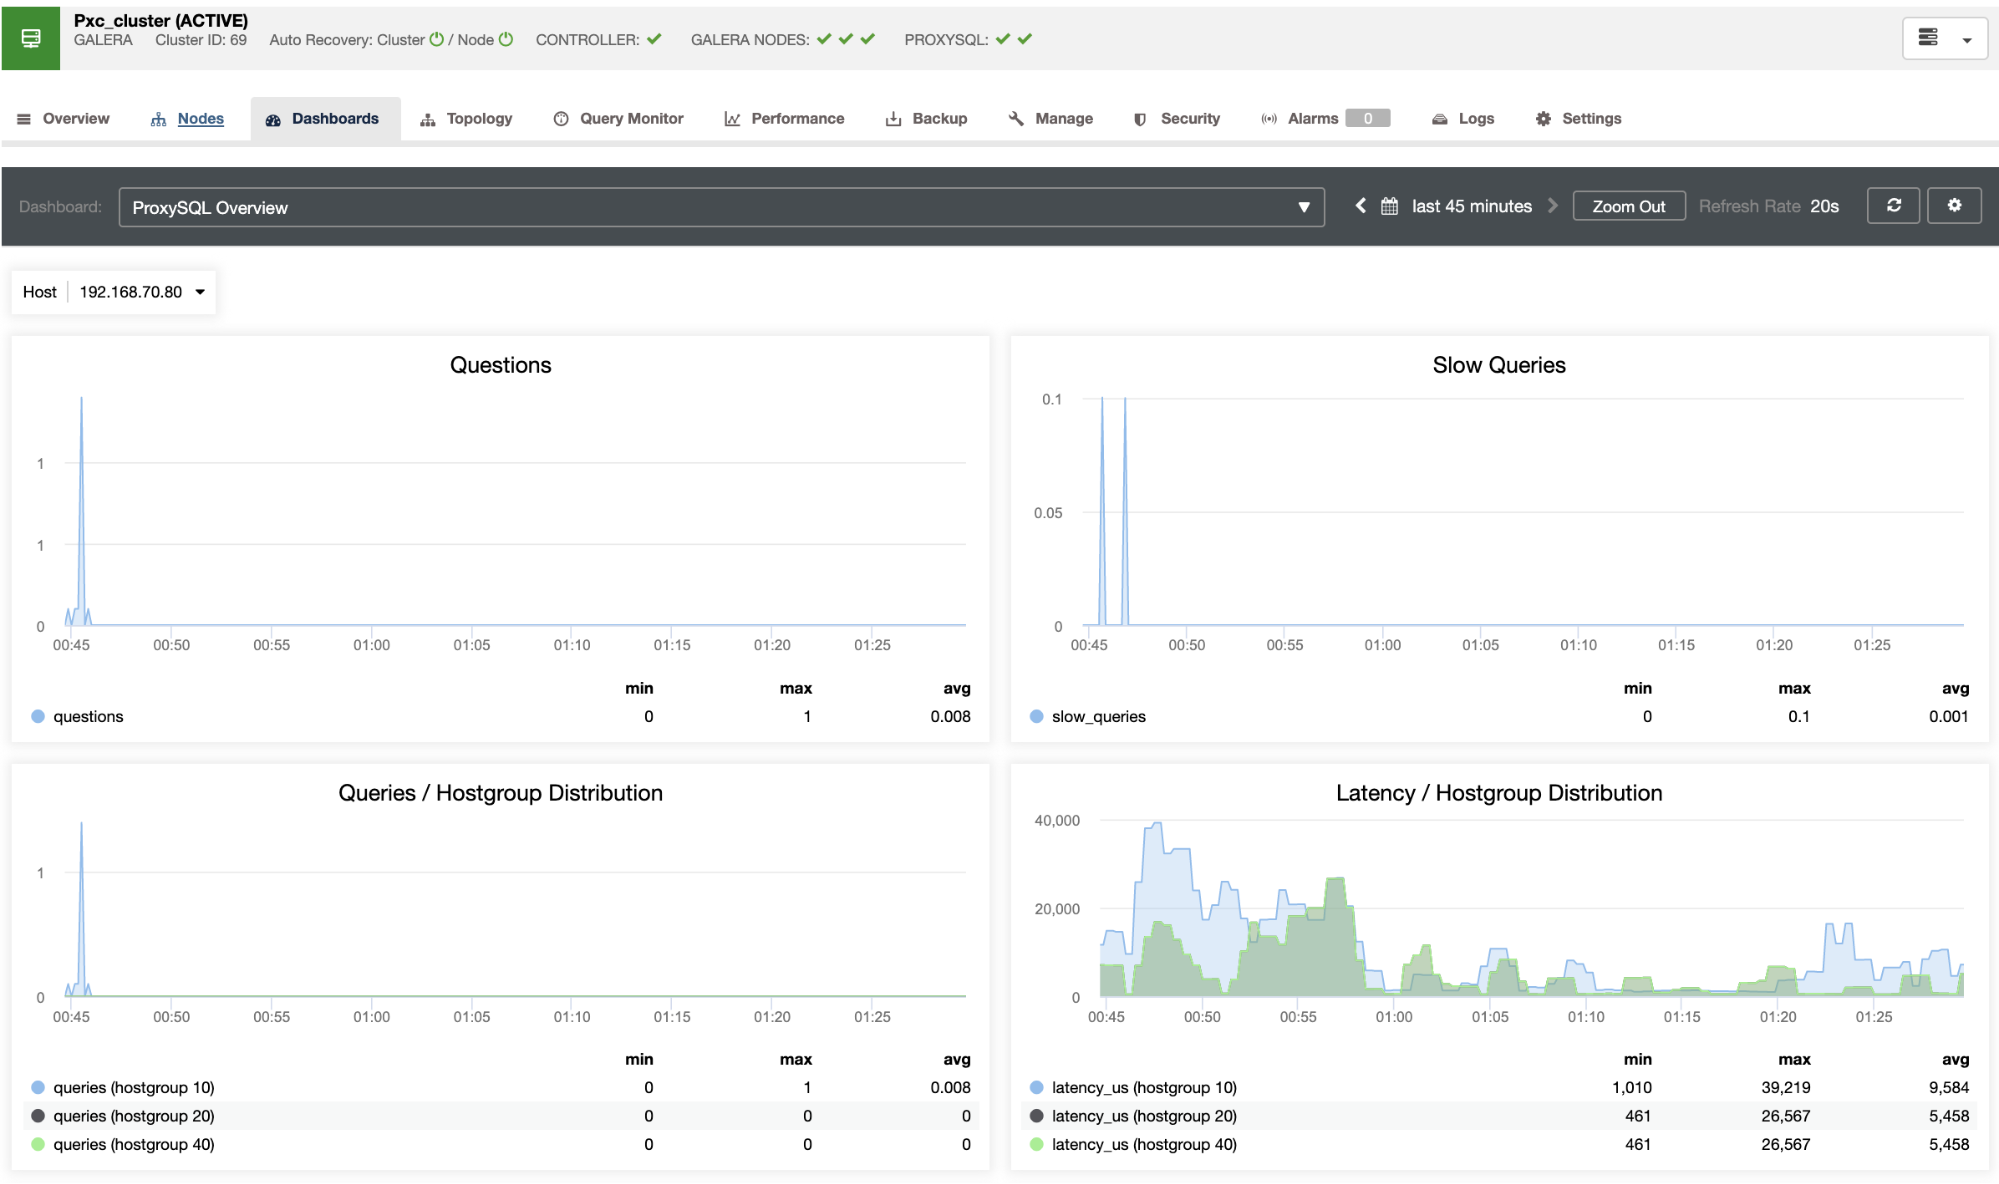
These graphs are part of the dashboard which simply helps you to easily determine the performance of your ProxySQL node.
ClusterControl doesn’t limit you when dealing with ProxySQL. Also, there’s a rich feature here where you can also take a backup or import the configuration which is very important when you are dealing with high-availability for your ProxySQL nodes.
Conclusion
It’s never been easier to monitor and determine if you have any issues with your ProxySQL. Like in the example of this blog, we’re showcasing ClusterControl as a tool that can provide you efficiency and give you insights to determine the outstanding issues that you are dealing with your performance related problems.


