blog
Agentless Database Monitoring with ClusterControl

With the growing complexity of database setups, many SysAdmins and DBAs are turning to an agentless approach to help ease the burden of database monitoring challenges. ClusterControl’s agentless monitoring allows you to monitor databases without installing agent software on each monitored system. ClusterControl implements monitoring using a remote data collector that uses the SSH protocol.
Before diving straight into the specifics of agentless monitoring, let’s first clarify the scope and meaning of monitoring within our context here. Monitoring comes after data trending — the metrics collection and storing process — which allows the monitoring system to process the collected data to produce justification for tuning, alerting, and displaying trending data for reporting.
Beginning in version 1.7.0 (released December 2018), ClusterControl supports two monitoring methods:
- Agentless monitoring (default)
- Agent-based monitoring with Prometheus
This post will walk through how to monitor your database servers and clusters with ClusterControl’s agentless monitoring. If you’re looking for more information on ClusterControl’s agent-based monitoring, you can refer to this documentation.
Generally, ClusterControl performs agentless monitoring, alerting, and trending duties using the following three methods:
- SSH – Host metrics collection (process, load balancers stats, resource usage, consumption, etc.) using SSH library
- Database client – Database metrics collection (status, queries, variables, usage, etc.) using the respective database client library
- Advisor – Mini programs written using ClusterControl DSL and running within ClusterControl itself for monitoring, tuning, and alerting purposes
SSH stands for Secure Shell, a secure network protocol used by most Linux-based servers for remote administration. ClusterControl Controller, or CMON, is the backend service performing automation, management, monitoring, and scheduling tasks, built on top of C++.
ClusterControl DSL (Domain Specific Language) allows you to extend the functionality of your ClusterControl platform by creating Advisors, Auto Tuners, or “Mini Programs.” The DSL syntax is based on JavaScript, with extensions to provide access to ClusterControl internal data structures and functions. The DSL allows you to execute SQL statements, run shell commands/programs across all your cluster hosts, and retrieve results to be processed for advisors/alerts or any other actions.
Monitoring Tools
All of the prerequisite tools are met by the installer script or automatically installed by ClusterControl during the database deployment stage or if the required file/binary/package does not exist on the target server before executing a job. Generally speaking, ClusterControl monitoring duty only requires OpenSSH server package on the monitored hosts. ClusterControl uses libssh client library to collect host metrics for the monitored hosts – CPU, memory, disk, network, IO, process, etc. OpenSSH client package is required on the ClusterControl host only to set up passwordless SSH and debugging purposes. Other SSH implementations like Dropbear and TinySSH are not supported.
When gathering the database stats and metrics, ClusterControl Controller (CMON) connects to the database server directly via database client libraries – libmysqlclient (MySQL/MariaDB and ProxySQL), libpq (PostgreSQL), and libmongocxx (MongoDB). That is why it’s crucial to set up proper privileges for a ClusterControl server from a database server’s perspective. For MySQL-based clusters, ClusterControl requires database user “cmon” while for other databases, any username can be used for monitoring, as long as it’s granted super-user privileges. Most of the time, ClusterControl will set up the required privileges (or use the specified database user) automatically during the cluster import or cluster deployment stage.
ClusterControl requires the following tools for load balancers:
- Maxctrl on the MariaDB MaxScale server
- netcat and/or socat on the HAProxy server to connect to the HAProxy socket file and retrieve the monitoring data
- ProxySQL requires a mysql client on the ProxySQL server
The following diagram illustrates both host and database monitoring processes executed by ClusterControl using libssh and database client libraries:
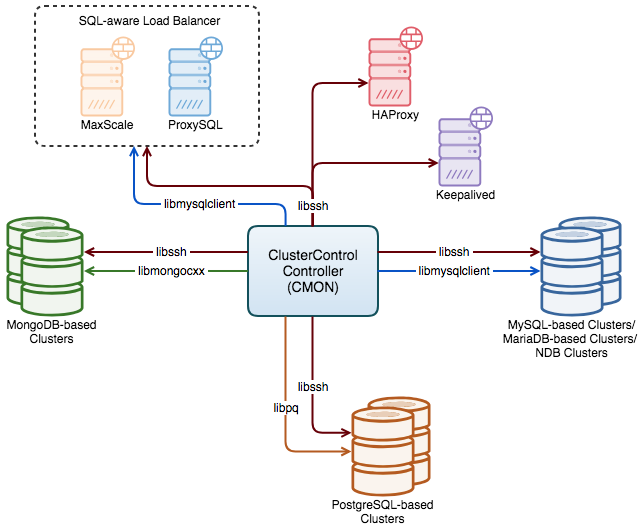
Although monitoring threads do not need database client packages installed on the monitored host, it’s highly recommended to have them for management purposes. For example, the MySQL client package comes with mysql, mysqldump, mysqlbinlog, and mysqladmin programs, which will be used by ClusterControl when performing backups and point-in-time recovery.
Monitoring Methods
For host and load balancer stats collection, ClusterControl executes this task via SSH with super-user privilege. Therefore, passwordless SSH with super-user privilege is vital to allow ClusterControl to run the necessary commands remotely with proper escalation. With this pull approach, there are a couple of advantages compared to other mechanisms:
- Agentless – There is no need for an agent to be installed, configured, and maintained.
- Unifying the management and monitoring configuration – SSH can be used to pull monitoring metrics or push management jobs on the target nodes.
- Simplify the deployment – The only requirement is proper passwordless SSH setup, and that’s it. SSH is also very secure and encrypted.
- Centralized setup – One ClusterControl server can manage multiple servers and clusters, provided it has sufficient resources.
However, the pull mechanism also has the following drawbacks:
- The monitoring data is accurate only from ClusterControl’s perspective. For example, if there is a network glitch and ClusterControl loses communication to the monitored host, the sampling will be skipped until the next available cycle.
- There will be network overhead for high granularity monitoring due to increased sampling rate where ClusterControl needs to establish more connections to every target host.
- ClusterControl will keep attempting to re-establish connection to the target node because it has no agent to do this on its behalf.
- Redundant data sampling if you have more than one ClusterControl server monitoring a cluster since each ClusterControl server has to pull the monitoring data for itself.
For MySQL query monitoring, starting from ClusterControl 1.9.0 (released July 2021), ClusterControl supports two types:
- Agentless query monitoring (default)
- Agent-based query monitoring using CMON query agent, which requires additional steps to enable it. Only for MySQL-based and PostgreSQL-based databases.
Agentless query monitoring monitors the queries in two different ways:
- Queries are retrieved from PERFORMANCE_SCHEMA by querying the schema on the database node via SSH.
- If PERFORMANCE_SCHEMA is disabled or unavailable, ClusterControl will parse the content of the Slow Query Log via SSH.
If Performance Schema is enabled, ClusterControl will use it to look for the slow queries. Otherwise, ClusterControl will parse the content of the MySQL slow query log (via slow_query_log=ON dynamic variable) based on the following flow:
- Start slow log (during MySQL runtime).
- Run it for a short period of time (a second or a couple of seconds).
- Stop log.
- Parse log.
- Truncate log (new log file).
- Go to 1.
The collected queries are hashed, calculated, and digested (normalize, average, count, sort) and then stored in the ClusterControl CMON database. Take note that for this sampling method, there is a slight chance some queries will not be captured, especially during the “stop log, parse log, truncate log” parts. You can enable Performance Schema if this is not an option.
Only queries that exceed the Long Query Time will be listed here using the Slow Query log. Suppose the data is not populated correctly, and you believe there should be something in there, it could be that either:
- ClusterControl did not collect enough queries to summarize and populate data. Try to lower the Long Query Time.
- You have configured Slow Query Log configuration options in the my.cnf of MySQL server, and Override Local Query is turned off. If you really want to use the value you defined inside my.cnf, you will probably have to lower the long_query_time value so ClusterControl can calculate a more accurate result.
- You have another ClusterControl node pulling the Slow Query log as well (in case you have a standby ClusterControl server). Only allow one ClusterControl server to do this job.
You can also use the ClusterControl Query Monitor for MySQL, MariaDB, and Percona Server.
For PostgreSQL query monitoring, ClusterControl requires the pg_stat_statements module to track execution statistics of all SQL statements. It populates the pg_stat_statements views and functions when displaying the queries in the UI (under Query Monitor tab).
Intervals and Timeouts
ClusterControl Controller (cmon) is a multi-threaded process. By default, the ClusterControl Controller sampling thread connects to each monitored host once and maintains a persistent connection until the host drops or disconnects when sampling host stats. It may establish more connections depending on the jobs assigned to the host since most of the management jobs run in their own thread. For example, cluster recovery runs on the recovery thread, Advisor execution runs on a cron-thread, and process monitoring runs on the process collector thread.
ClusterControl monitoring thread performs the following sampling operations in the following interval:
- MySQL query/status metrics: every second
- Process collection (/proc): every 10 seconds
- Server detection: every 10 seconds
- Host metrics (/proc, /sys): every 30 seconds (configurable via host_stats_collection_interval)
- Database metrics (PostgreSQL and MongoDB only): every 30 seconds (configurable via db_stats_collection_interval)
- Database schema metrics: every 3 hours (configurable via db_schema_stats_collection_interval)
- Load balancer metrics: every 15 seconds (configurable via lb_stats_collection_interval)
The imperative scripts (Advisors) can make use of SSH and database client libraries that come with CMON with the following restrictions:
- 5 seconds of hard limit for SSH execution.
- 10 seconds of default limit for database connection, configurable via net_read_timeout, net_write_timeout, connect_timeout in CMON configuration file.
- 60 seconds of total script execution time limit before CMON ungracefully aborts it.
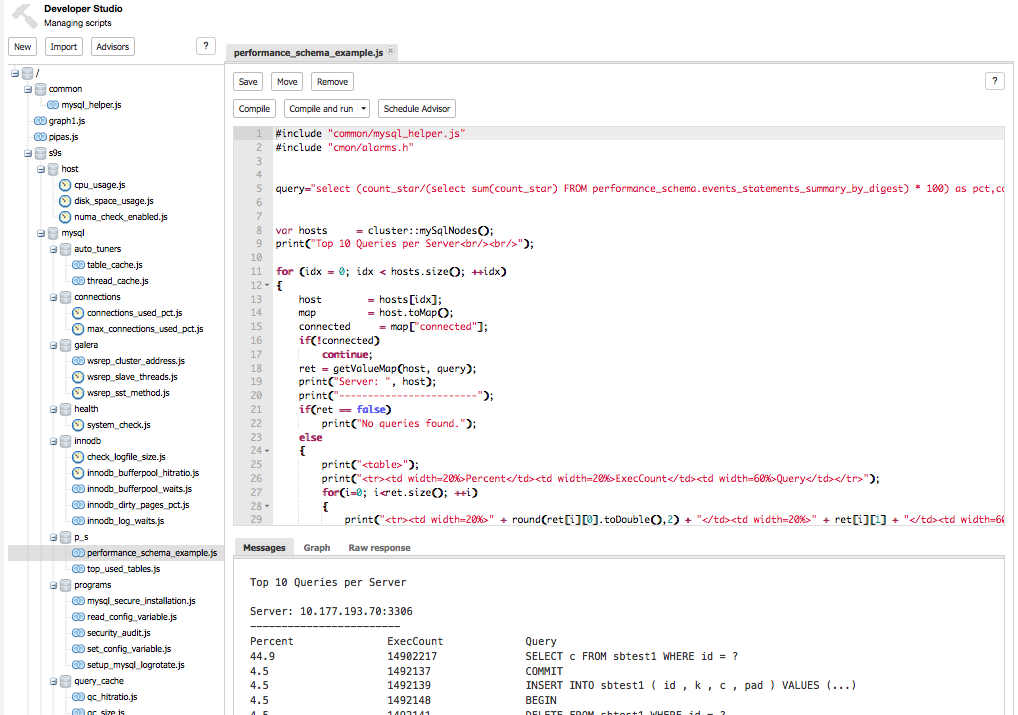
Advisors can be created, compiled, tested, and scheduled directly from ClusterControl’s UI under Manage → Developer Studio. The following screenshot shows an example of an Advisor to extract top 10 queries from PERFORMANCE_SCHEMA:
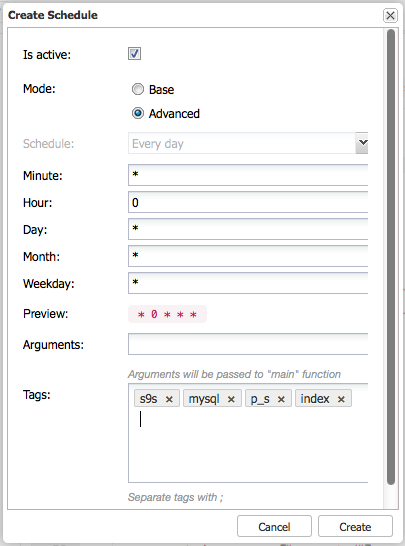
The execution of advisors is dependent on if it is activated and the scheduling time in cron format:
The results of the execution are displayed under Performance → Advisors, as shown in the following screenshot:
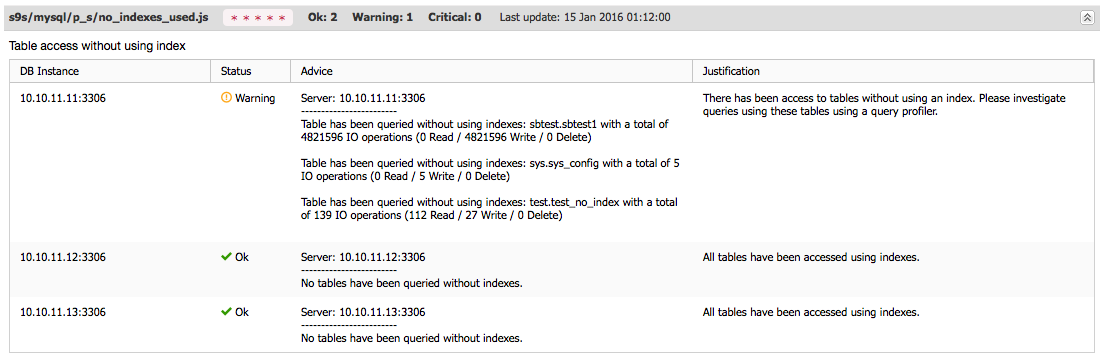
For more information on what Advisors are provided by default, check out our Developer Studio product page.
Data is stored directly into the CMON database for short-interval monitoring data like MySQL queries and status. Long-interval monitoring data like weekly/monthly/yearly data points are aggregated every 60 seconds and stored in memory for 10 minutes. These behaviors are not configurable due to the architecture design.
Parameters
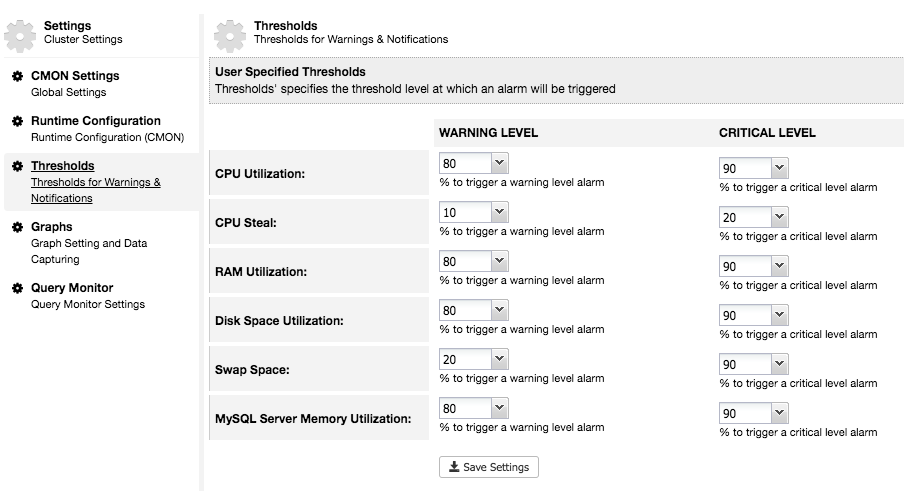
ClusterControl has many parameters to suit your monitoring and alerting policy. Most of them are configurable through ClusterControl UI → pick a cluster → Settings. The “Settings” tab provides many options to configure alerts, thresholds, notifications, graph layout, database counters, query monitoring, and so on. For example, warning and critical thresholds are configurable as follows:
The “Runtime Configuration” page shows a summarized list of the active ClusterControl Controller (CMON) runtime configuration parameters:
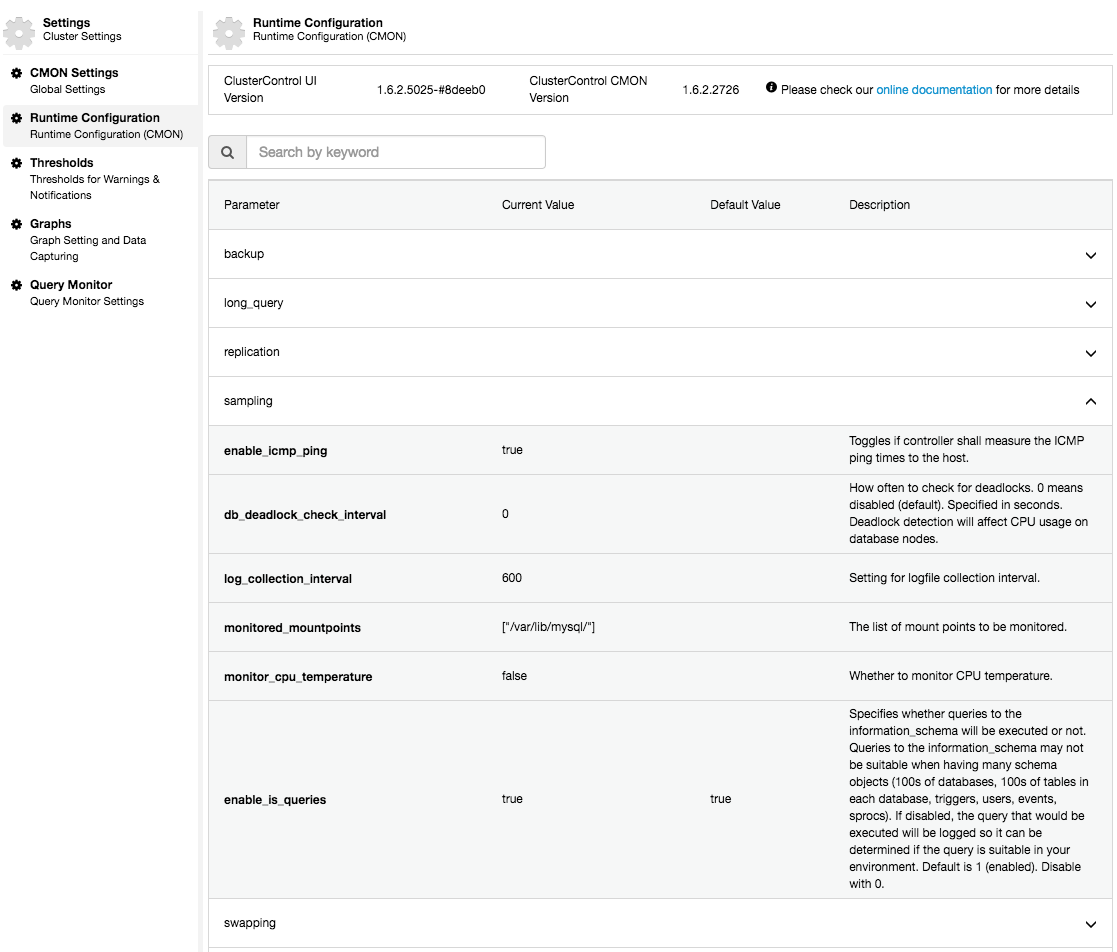
There are more than 170 ClusterControl Controller configuration options in total, and some of the advanced settings can be configured monitoring and alerting policy fine tuning. Some of these include:
- monitor_cpu_temperature
- swap_warning
- swap_critical
- redobuffer_warning
- redobuffer_critical
- indexmemory_warning
- indexmemory_critical
- datamemory_warning
- datamemory_critical
- tablespace_warning
- tablespace_critical
- redolog_warning
- redolog_critical
- max_replication_lag
- long_query_time
- log_queries_not_using_indexes
- query_monitor_use_local_settings
- enable_query_monitor
- enable_query_monitor_auto_purge_ps
You can change the parameters listed in the “Runtime Configuration” page by either using the UI or CMON configuration file located at /etc/cmon.d/cmon_X.cnf, where X is the cluster ID. You can list out all of the supported configuration options for CMON by using the following command:
$ cmon --help-configFinal Thoughts
Agentless monitoring has become one of the most effective methods for managing increasingly complex database infrastructures. It reduces the burden of many challenges associated with database monitoring and is easy to manage.
There are lots of agentless monitoring tools available today. However, not many of them also offer a complete platform full of features to help you manage every other aspect of your database clusters. To see what else ClusterControl can do, be sure to download your own free 30-day trial.
Are you looking for an agent-based alternative to database monitoring? Check out ClusterControl’s agent-based database monitoring infrastructure — SCUMM.