blog
What Do You Use To Monitor Query Performance?

If you have found yourself in the shoes of a database administrator or a database-savvy developer or a system administrator, you have most likely already heard about queries. Heck, it’s impossible not to, right? Queries are covered in the documentation of every database management system, from MySQL and PostgreSQL, to MongoDB. Coincidence? No. Queries are one of the most important things databases are based on – query performance is one of the main concerns to every database administrator.
How Do We Monitor Query Performance?
When it comes to database administration, different people have different skill sets and those different skill sets are one of the reasons why people might elect to monitor the performance of their queries differently:
For example, for a database-savvy system engineer, a simple EXPLAIN query would do. A developer might think “hmm, can’t I measure this by running a few queries when a button is clicked? Easy as that, right?”, however, a performance-hungry database administrator would probably elect to use different measures, such as tools relevant to the task. As far as tools are concerned, we obviously have a lot of options: some tools are designed to better help you form queries (we’re talking about SQL clients, CLI tools, and the like), while some tools offer a fully-fledged database management solution. One of those tools is ClusterControl – ClusterControl is a tool that can provide you with a lot of options ranging from query monitoring and alerting you once things go wrong to helping you back up your data and deploying your database clusters.
ClusterControl also comes with extensive performance management capabilities to let you keep an eye on the performance of your database clusters at any time. If you’re curious how everything looks like, here’s a schema analyzer:
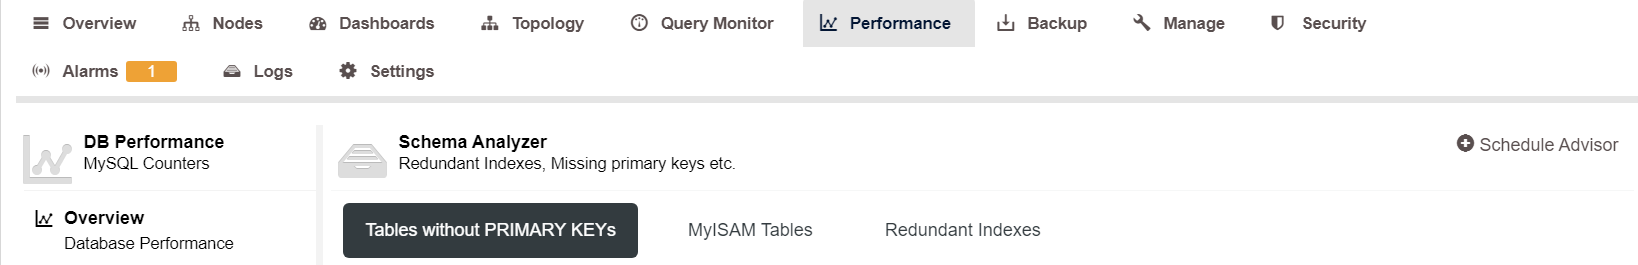
“Wait..”, – we hear you saying. “Is that all there is? Why would I even need a schema analyzer? Surely there must be something else, I used the tool as a free version and now I’m paying for it, so I must get something else out of it too?” – relax! There is!
ClusterControl for Query Monitoring
Look towards the left hand side of ClusterControl and you will be presented with a bunch of options that might be useful to improve your query (and consequently, database) performance:
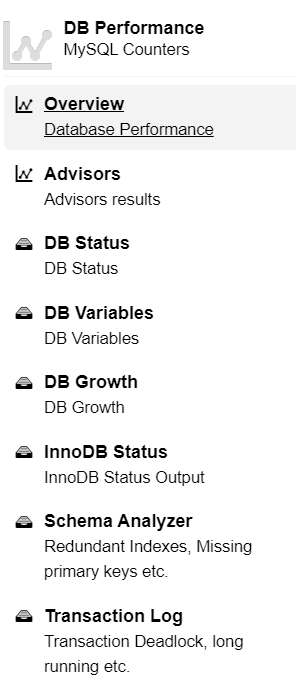
The descriptions are pretty self explanatory: you can have an overview of the performance of your entire database cluster, ClusterControl can provide you with some advice on how to improve query performance, provide you with the settings relevant to your databases (we are referring to the “DB Status” and “DB Variables” part of the image), some are designed to provide some schema-relevant information, etc.: all of those things, as strange as it may be, will help you improve your database performance at least by a little bit: for example, observe the status of your databases and you will most likely know what needs to be monitored. Observe database variables and the InnoDB status and you will most likely know what might have caused your query performance to (sometimes drastically) drop down, observe the status of your schemas and the transaction log and you will see where you are wasting precious disk space and not getting any performance in return, what tables might be missing some indexes, what transactions are stuck in the hell of deadlocks, etc.
If you use ClusterControl to monitor your query performance, you can rest assured that you are in good hands because the team behind ClusterControl – Severalnines – is comprised of the best database experts in the world who are committed to helping you improve your database monitoring and performance capabilities wherever you might go. Give it a shot today and see how much the usage of ClusterControl can positively change your database performance – we are confident you will make good use of it.


