blog
Preparing a MySQL or MariaDB Server for Production – Part One

It is extremely important to install and configure a production MySQL server with the necessary packages and tools to smooth-out the operations in the long run. We have seen many cases where troubleshooting or tuning a production server (especially one without public internet access) is commonly difficult because of the lack of necessary tools installed on the server to help identify and solve the problem.
In this two-part blog series, we are going to show you 9 tips and tricks on how to prepare a MySQL server for production usage from a system administrator perspective. All examples in this blog post are based on our two-node, master-slave MySQL Replication setup running on CentOS 7.
Install Essential Packages
After the installation of MySQL or MariaDB client and server packages, we need to prepare the MySQL/MariaDB server with all necessary tools to cope with all the administration, management and monitoring operations that are going to happen on the server. If you are planning to lock down the MySQL server in production, it will be a bit harder to install them all manually without the Internet connection.
Some of the important packages that should be installed on the MySQL/MariaDB server for Linux:
- Percona Xtrabackup/MariaDB Backup – Non-blocking physical backup of the database server.
- ntp/ntpdate – Sync server’s time.
- pv – Monitor data through a pipeline, can also be used for throttling.
- socat or netcat- Data streaming tool, good for streaming backup.
- net-tools – A collection of network debugging tools for Linux.
- bind-utils – A collection of DNS debugging tools for Linux.
- sysstat – A collection of performance monitoring tools for Linux.
- telnet – Telnet client to check service reachability.
- mailx/mailutils – MTA client.
- openssl – Toolkit for the Transport Layer Security (TLS) and Secure Sockets Layer (SSL) protocols.
- unzip – Uncompress tool.
- htop – Host monitoring tool.
- innotop – MySQL monitoring tool.
- vim – Text editor with syntax highlighting (or any preferred text editor).
- python-setuptools – Python package manager.
- lm_sensors/ipmitool – To check server component’s temperature. Bare-metal server only.
Note that some of the suggested packages are only available in non-default package repositories like EPEL for CentOS. Therefore, for YUM-based installation:
$ yum install epel-release
$ yum install -y wget ntp pv socat htop innotop vim mailx bind-utils net-tools telnet sysstat openssl python-setuptools lm_sensors ipmitool
While for APT-based installation:
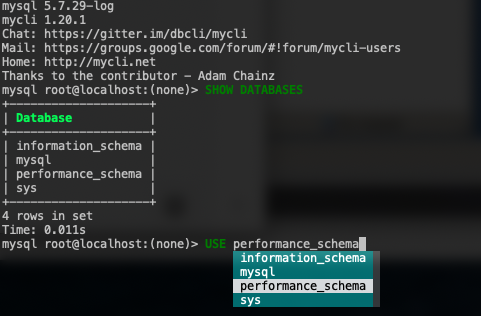
$ apt-get install ntp pv socat htop innotop vim easy_install mailutils bind-utils sysstat net-tools telnet openssl lm_sensors ipmitoolFor MySQL command line interface, we can use another tool other than the standard “mysql” command line client like mycli, with auto-completion and syntax highlighting. To install the package, we can use pip (Python package manager):
$ pip install mycliWith mycli, one can reduce the human-error vector with a better visualization when dealing with production server, as shown in the following screenshot:
Meaningful Shell Prompt
This part looks unnecessary in the first place, but it is probably going to save you from making silly mistakes in production. As a human, we are prone to make errors especially when running destructive commands during an intense moment, for example when the production server is down.
Take a look at the following screenshot. By default, the bash PS1 prompt (primary prompt) looks pretty dull:
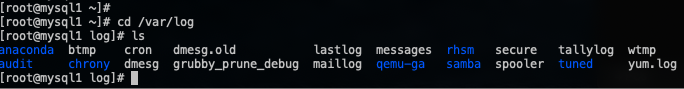
A good PS1 prompt should provide distinctful information to make SysAdmins more aware of the environment, server and current path that they are currently dealing with. As a result, one would be more careful and always know whether it’s in the right path/server/user to execute the command.
To achieve this, find the line that describing PS1 (primary prompt) configuration, commonly in /etc/bashrc line 41:
[ "$PS1" = "\s-\v\$ " ] && PS1="[u@h W]\$ "And replace it with this line:
[ "$PS1" = "\s-\v\$ " ] && PS1="[[e[36m]u[e[m]@[e[32m]h[e[m][e[31;47m]Production[e[m]: [e[33m]w[e[m]]$ "Log out from the terminal and re-login again. You should see something like this in the terminal now:
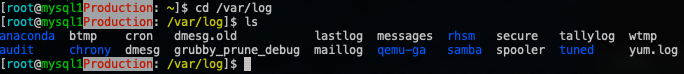
As shown in the screenshot above, the current user (blue), server’s hostname (green), Production tier (bold in red colour with white background), together with the full path of the current directory (yellow) provides a better summary of the current session where the important information are easily distinguishable with different colours.
You can use this free online tool to customize your bash prompt, to suit your taste.
MOTD
If you are managing a database cluster with multiple roles like MySQL or MariaDB replication, it’s common to always have this anxious feeling when directly administering one of the hosts because we need to perform extra checks to verify that the node that we are in is the one that we really want to administer. Replication topology tends to become more complex as your database cluster scales out and there could be many roles in a cluster like intermediate master, binlog server, backup master with semi-sync replication, read-only slaves and also backup verification server.
It will be way better if we can get a summary of the database state whenever we are in that particular server, just to give us a heads up on what we are going to deal with. We can utilize Linux’s Message of the Day (MOTD) to automate this behaviour whenever we log into the server. Using the default /etc/motd is only good for static content, which is not what we really want if we want to report the current state of a MySQL server.
To achieve similar result, we can use a simple Bash script to produce a meaningful MOTD output to summarize our MySQL/MariaDB server, for example:
$ vim ~/.motd.sh
#!/bin/bash
# Auto-generate MOTD for MySQL/MariaDB Replication
# .motd.sh, to be executed under ~/.bash_profile

#####
# Preferred role of the node, pick one
#PREFER_ROLE='Slave'
PREFER_ROLE='Master'
#####

HOSTNAME=$(hostname)
UPTIME=$(uptime -p)
MYSQL_COMMAND='mysql --connect-timeout=2 -A -Bse'
MYSQL_READONLY=$(${MYSQL_COMMAND} 'SHOW GLOBAL VARIABLES LIKE "read_only"' | awk {'print $2'})
TIER='Production'
MAIN_IP=$(hostname -I | awk {'print $1'})
CHECK_MYSQL_REPLICATION=$(${MYSQL_COMMAND} 'SHOW SLAVE STATUSG' | egrep 'Slave_.*_Running: Yes$')
MYSQL_MASTER=$(${MYSQL_COMMAND} 'SHOW SLAVE STATUSG' | grep Master_Host | awk {'print $2'})
# The following requires show_compatibility_56=1 for MySQL 5.7 and later
MYSQL_UPTIME=$(${MYSQL_COMMAND} 'SELECT TIME_FORMAT(SEC_TO_TIME(VARIABLE_VALUE ),"%Hh %im")  AS Uptime FROM information_schema.GLOBAL_STATUS WHERE VARIABLE_NAME="Uptime"')

# coloring
bold=$(tput bold)
red=$(tput setaf 1)
green=$(tput setaf 2)
normal=$(tput sgr0)

MYSQL_SHOW=1
if [ $MYSQL_READONLY == 'ON' ]; then
        CURRENT_MYSQL_ROLE='Slave'
        if ${MYSQL_COMMAND} 'SHOW SLAVE STATUSG' | egrep 'Slave_.*_Running: Yes$' &>/dev/null ; then
                lag=$(${MYSQL_COMMAND} 'SHOW SLAVE STATUSG' | egrep 'Seconds_Behind_Master:' | awk {'print $2'})
                if [ $lag -eq 0 ]; then
                        REPLICATION_STATUS="${green}Healthy  "
                else
                        if [ $lag == 'NULL' ]; then
                                REPLICATION_STATUS=${red}Unhealthy
                        else
                                REPLICATION_STATUS="${red}Lagging ${lag}s"
                        fi
                fi
        else
                REPLICATION_STATUS=${red}Unhealthy
        fi

elif [ $MYSQL_READONLY == 'OFF' ]; then
        CURRENT_MYSQL_ROLE='Master'
        SLAVE_HOSTS=$(${MYSQL_COMMAND} 'SHOW SLAVE HOSTS' | awk {'print $1'})
else
        MYSQL_SHOW=0
fi

if [ $TIER == 'Production' ]; then
        TIER=${green}Production
fi

if [ $PREFER_ROLE == $CURRENT_MYSQL_ROLE ]; then
        MYSQL_ROLE=${green}$CURRENT_MYSQL_ROLE
else
        MYSQL_ROLE=${red}$CURRENT_MYSQL_ROLE
fi

echo
echo "HOST INFO"
echo "========="
echo -e "  Hostname       : ${bold}$HOSTNAME${normal} t Server Uptime  : ${bold}$UPTIME${normal}"
echo -e "  IP Address       : ${bold}$MAIN_IP${normal} t Tier           : ${bold}$TIER${normal}"
echo
if [ $MYSQL_SHOW -eq 1 ]; then
        echo "MYSQL STATE"
        echo "==========="
        echo -e "  Current role      : ${bold}$MYSQL_ROLE${normal} tt Read-only      : ${bold}$MYSQL_READONLY${normal}"
        echo -e "  Preferred role    : ${bold}$PREFER_ROLE${normal} tt DB Uptime      : ${bold}$MYSQL_UPTIME${normal}"
        if [ $CURRENT_MYSQL_ROLE == 'Slave' ]; then
                echo -e "  Replication state : ${bold}$REPLICATION_STATUS${normal} t Current Master : ${bold}$MYSQL_MASTER${normal}"
        else
                echo -e "  Slave Hosts(s) ID : "
                for i in $SLAVE_HOSTS; do
                        echo -e "      - ${bold}$i${normal} t"; done
        fi
        echo
fi
Choose one of the MySQL roles, either a master or a slave on line 8 or 9 and save the script. This script requires MySQL option file to store the database user credentials, so we have to create it first:
$ vim ~/.my.cnfAnd add the following lines:
[client]
user=root
password='YourRootP4ssw0rd'
Replace the password part with the actual MySQL root password. Then, apply executable permission to the script:
$ chmod 755 ~/.motd.shTest the executable script whether it produces the correct output or not:
$ ~/.motd.shIf the output looks good (no errors or warnings), add the script into ~/.bash_profile so it will be automatically loaded when a user logs in:
$ whoami
root
$ echo '~/.motd.sh' >> ~/.bash_profile
Re-login the terminal and you should see something like this on the master:
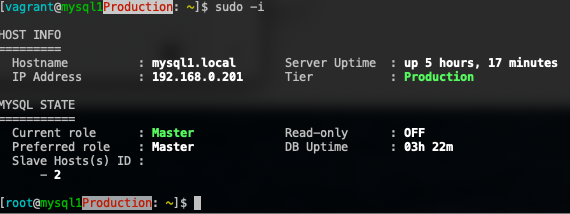
While on the slave, you should see something like this:
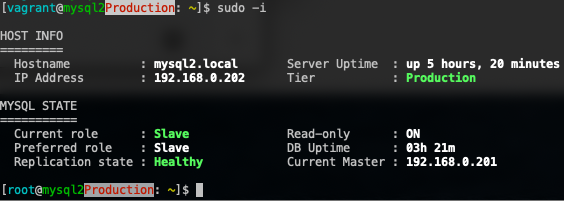
Note that this script is specifically written for a simple MySQL/MariaDB one-tier master-slave replication. You probably have to modify the script if you have a more complex setup, or you want to use other MySQL clustering technology like Galera Cluster, Group Replication or NDB Cluster. The idea is to retrieve the database node status and information right when we logged in so we are aware of the current state of the database server that we are working on.
Sensors and Temperature
This part is commonly being ignored by many SysAdmins. Monitoring the temperatures is crucial as we do not want to get a big surprise if the server behaves unexpectedly when overheating. A physical server commonly consists of hundreds of electronic parts glued together in a box and are sensitive to temperature changes. One failed cooling fan could spike a CPU temperature to hit its hard limit, which eventually causes the CPU clock to be throttled down and affects the data processing performance as a whole.
We can use the lm-sensors package for this purpose. To install it, simply do:
$ yum install lm-sensors # apt-get install lm-sensors for APTThen run the sensors-detect program to automatically determine which kernel modules you need to load to use lm_sensors most effectively:
$ sensors-detectAnswers all questions (commonly just accept all the suggested answers). Some hosts like virtual machines or containers do not support this module. Sensors really need to be at the hosts (bare-metal) level. Check out this list for more information.
Then, run the sensors command:
$ sensors
i350bb-pci-0203
Adapter: PCI adapter
loc1:         +53.0°C (high = +120.0°C, crit = +110.0°C)

power_meter-acpi-0
Adapter: ACPI interface
power1:        4.29 MW (interval =   1.00 s)

coretemp-isa-0000
Adapter: ISA adapter
Package id 0:  +55.0°C (high = +85.0°C, crit = +95.0°C)
Core 0:        +45.0°C (high = +85.0°C, crit = +95.0°C)
Core 1:        +51.0°C (high = +85.0°C, crit = +95.0°C)
Core 2:        +47.0°C (high = +85.0°C, crit = +95.0°C)
Core 3:        +51.0°C (high = +85.0°C, crit = +95.0°C)
Core 4:        +49.0°C (high = +85.0°C, crit = +95.0°C)
Core 5:        +48.0°C (high = +85.0°C, crit = +95.0°C)
Core 8:        +47.0°C (high = +85.0°C, crit = +95.0°C)
Core 9:        +49.0°C (high = +85.0°C, crit = +95.0°C)
Core 10:       +48.0°C (high = +85.0°C, crit = +95.0°C)
Core 11:       +48.0°C (high = +85.0°C, crit = +95.0°C)
Core 12:       +46.0°C (high = +85.0°C, crit = +95.0°C)
Core 13:       +49.0°C (high = +85.0°C, crit = +95.0°C)

coretemp-isa-0001
Adapter: ISA adapter
Package id 1:  +53.0°C (high = +85.0°C, crit = +95.0°C)
Core 0:        +46.0°C (high = +85.0°C, crit = +95.0°C)
Core 1:        +48.0°C (high = +85.0°C, crit = +95.0°C)
Core 2:        +47.0°C (high = +85.0°C, crit = +95.0°C)
Core 3:        +45.0°C (high = +85.0°C, crit = +95.0°C)
Core 4:        +46.0°C (high = +85.0°C, crit = +95.0°C)
Core 5:        +47.0°C (high = +85.0°C, crit = +95.0°C)
Core 8:        +47.0°C (high = +85.0°C, crit = +95.0°C)
Core 9:        +45.0°C (high = +85.0°C, crit = +95.0°C)
Core 10:       +45.0°C (high = +85.0°C, crit = +95.0°C)
Core 11:       +46.0°C (high = +85.0°C, crit = +95.0°C)
Core 12:       +46.0°C (high = +85.0°C, crit = +95.0°C)
Core 13:       +46.0°C (high = +85.0°C, crit = +95.0°C)
The above result shows the overall CPU temperature, together with its every CPU core. Another tool that we can use to see the overall state of the server components is ipmitool. To install, simply do:
$ yum -y install ipmitoolBy running the following command, we can tell the overall state of the physical components in the server:
$ ipmitool sdr list full
Inlet_Temp       | 20 degrees C   | ok
PCIe_Inlet_Temp  | 37 degrees C   | ok
Outlet_Temp      | 20 degrees C   | ok
CPU0_VR_Temp     | 39 degrees C   | ok
CPU1_VR_Temp     | 41 degrees C   | ok
CPU0_Temp        | 55 degrees C   | ok
CPU1_Temp        | 52 degrees C   | ok
PCH_Temp         | 58 degrees C   | ok
DIMMG0_Temp      | 35 degrees C   | ok
DIMMG1_Temp      | 32 degrees C   | ok
PSU0_Temp        | 0 degrees C    | ok
PSU1_Temp        | 0 degrees C    | ok
SYS_3.3V         | 3.30 Volts     | ok
SYS_5V           | 5 Volts        | ok
SYS_12V          | 12.10 Volts    | ok
CPU0_VCORE       | 1.79 Volts     | ok
CPU1_VCORE       | 1.79 Volts     | ok
CPU0_DDR_VDD     | 1.23 Volts     | ok
CPU1_DDR_VDD     | 1.23 Volts     | ok
SYS_FAN1_Speed   | 4018 RPM   | ok
SYS_FAN2_Speed   | 4116 RPM   | ok
SYS_FAN3_Speed   | 4116 RPM   | ok
SYS_FAN4_Speed   | 4116 RPM   | ok
SYS_FAN5_Speed   | 4018 RPM   | ok
SYS_FAN6_Speed   | 4116 RPM   | ok
SYS_FAN7_Speed   | 4018 RPM   | ok
SYS_FAN8_Speed   | 4116 RPM   | ok
SYS_FAN9_Speed   | 4018 RPM   | ok
SYS_FAN10_Speed  | 4116 RPM   | ok
SYS_FAN11_Speed  | 4116 RPM   | ok
SYS_FAN12_Speed  | 4116 RPM   | ok
SYS_FAN13_Speed  | 4116 RPM   | ok
SYS_FAN14_Speed  | 4214 RPM   | ok
Airflow_rate     | 16 CFM     | ok
PSU1_PIN         | 0 Watts    | ok
PSU2_PIN         | 0 Watts    | ok
PSU1_POUT        | 0 Watts    | ok
PSU2_POUT        | 0 Watts    | ok
PSU1_IIN         | 0 Amps     | ok
PSU2_IIN         | 0 Amps     | ok
PSU1_VIN         | 0 Volts    | ok
PSU2_VIN         | 0 Volts    | ok
CPU_Power        | 63 Watts   | ok
MEM_Power        | 8 Watts    | ok
Total_Power      | 0 Watts    | ok
BP_Power         | 8 Watts    | ok
FAN_Power        | 6 Watts    | ok
MB_Power         | 0 Watts    | ok
The list is long but is self-explanatory and you should be able to oversee the overall server components’ state. There could be cases where some of the fans are not running at full speed which then increase the CPU temperature. Hardware replacement might be required to fix the problem.
Note that the Intelligent Platform Management Interface (IPMI) kernel module requires Baseboard Management Controller (BMC) to be enabled on the motherboard. Use dmesg to verify if it is available:
$ dmesg | grep -i bmc
[    8.063470] ipmi_si IPI0001:00: Found new BMC (man_id: 0x000000, prod_id: 0x02f3, dev_id: 0x20)
Otherwise, check the server’s BIOS setting if this controller is disabled.
That’s it for now. Part two of this blog series will cover the remaining 5 topics like backup tool configuration, stress tests, and server lock down.