blog
Monitoring MariaDB Performance in a Hybrid Cloud

Performance in our MariaDB database is one of the areas we want to closely monitor and observe in a production environment and its timely running condition. It can be extremely demanding for time, work, and money if the architectural setup uses a Hybrid Cloud. Not only that, there are such certain areas to look at, especially the network intermediary that serves its connectivity as either an on-premise or a private cloud that communicates with the public cloud (GCP, AWS, Azure, etc.) and vice versa.
This blog is all about monitoring the performance of your MariaDB databases on a Hybrid Cloud infrastructure. We’ll provide you with basics and most important key indicators when monitoring your MariaDB database performance within a hybrid cloud setup.
Why Do You Need Performance Monitoring?
On a Hybrid Cloud, it can be complicated to monitor each service you avail. Unlike your own data center or your private cloud, you have full control over the hardware and software infrastructure. With public cloud, there are limitations on the services you tendered and it might incur an additional cost if you want different services that would provide you with metrics and logs. Security is also a concern with regards to your confidential data that are being collected.
Performance Monitoring helps determine how efficient and how fast your databases are running in the cloud, on-prem or private or public cloud. In practice, a set of tested and result-based processes and tools that will provide you real time or periodical metrics.
Within a hybrid cloud, not all software monitoring tools are built to manage key metrics that have to be observed and monitored. You should have the idea and knowledge to determine the required metrics and requirements the tool can provide. With a hybrid cloud, it is expected that the nature of how a hybrid cloud works can be complex. The services are highly distributed and mixed with other services that are not bound only to one provider.
In that regard, your monitoring software has these specialities and does it also has the capability to identify and decouple from which cloud it belongs. A monitoring software or tools must have the ability to address bottlenecks, security issues, latencies, provide scalability, notify of ongoing issues, and provide predictions. The prediction can avoid further consequences that can lead to a disaster or impact efficiency of your MariaDB databases. This helps the whole team including infrastructure engineers, database engineers, server administrators, and developers to ensure that the database servers are healthy and are running on its level of expectations.
Things To Consider for Database Monitoring
When monitoring your MariaDB database cluster (replication or Galera) or node, there are two main things to take into account: the operating system and the database itself. You will need to define which metrics you are going to monitor from both sides and how you are going to do it. You need to monitor the metric always in the context of your system, and you should look for alterations in the behaviour pattern.
In most cases, you will need to use several tools (as it is nearly impossible to find one to cover all the desired metrics.)
Keep in mind that when one of your metrics is affected, it can also affect others, making troubleshooting of the issue more complex. Having a good monitoring and alerting system is important to make this task as simple as possible.
Always Monitor Your Server Activity (Network, Disk, Load, Memory, & CPU)
Monitoring your server activity can also be a complex task if you have a very complicated stack that is intertwined in your database architecture. However, for a MariaDB database, it’s always best to have your nodes always set up as a dedicated server to get a full introspection per node basis. Although that doesn’t limit you from using all the spare resources, below are the common key areas you have to look into.
Network
On a Hybrid Cloud infrastructure, it’s one of the most important concerns to look into as you have to take into account the type of design and how it communicates from on-premise or private cloud to the public cloud and vice versa. Either way, you have one of the clusters or nodes specialize its role either as a primary for receiving writes or it serves as disaster recovery. With that regard, you do not want your recovery nodes to have latencies, worse it gets large replication lags. Whenever it gets lags and when the primary cluster from a particular cloud (let’s say your on-prem) goes down, your public cloud has to take over but shall be able to serve the most up-to-date data. Whenever this can happen, you might have to add a pre-failover mechanism that shall take care of incremental backups or PITR in case some transactions or writes were not yet applied in your recovery cluster (or in this case, your public cloud cluster).
If you’re using Galera, since MariaDB upgraded its Galera to version 4, streaming replication is added as one of the key features and changes from the previous version. Since streaming replication addresses the drawbacks it had in the previous releases but allows it to manage more than 2GB of write-sets since Galera Cluster 4. This allows big transactions to be fragmented and is highly recommended to enable this during session level alone. This means, monitoring your network activity is very important and crucial to the normal activity of your MariaDB Cluster. This will help you identify which node did have the most or highest network traffic based on the period of time.
A good example of rendering network monitoring is using ClusterControl. It identifies each of the nodes and provides an overview of its network activity per node regardless of which cloud the node is located. See screenshot below:
CPU, Memory, and Load Activity
Let me briefly put these three areas to look upon when monitoring. In this section, it’s always best you have better observability of the following areas at once. It’s quick and easy to understand and helps in ruling out a performance bottleneck or identifying bugs that cause your nodes to either stall or affect the other nodes or even having the possibility of a cluster going down.
So how does CPU, memory, and load activity upon monitoring help your MariaDB? Well, as I have mentioned above, those are one of the few things yet a big factor for daily routine checks. Now, this also helps you identify if these are periodical or random occurrences. If periodical, it might be related to backups running in one of your MariaDB database nodes, or it’s a massive query that requires optimization. For example, bad queries with no proper indexes, or in-balance usage of data retrieval such as doing a string comparison for such a large string. That can be undeniably inapplicable for OLTP type databases especially if it’s really the nature and requirements of your application. Better use other analytical tools such as MariaDB Columnstore, or other third-party analytic processing tools (Apache Spark, Kafka, or MongoDB, etc.) for large string data retrieval and/or string matching.
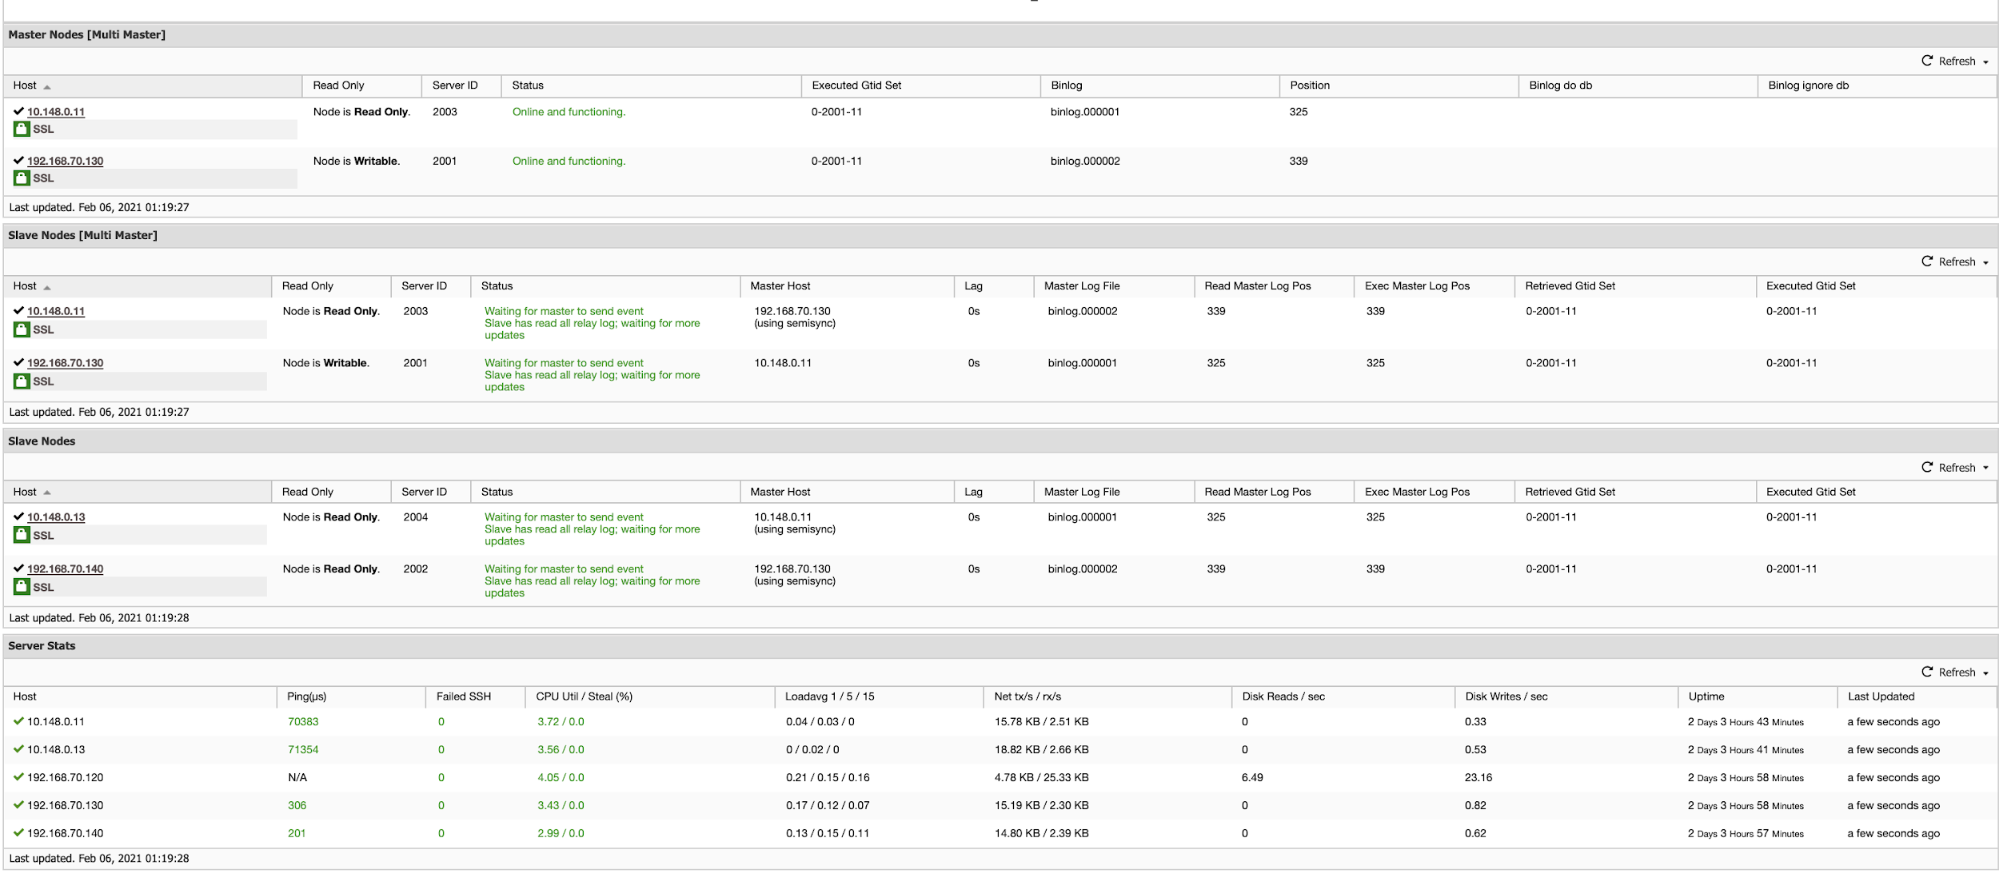
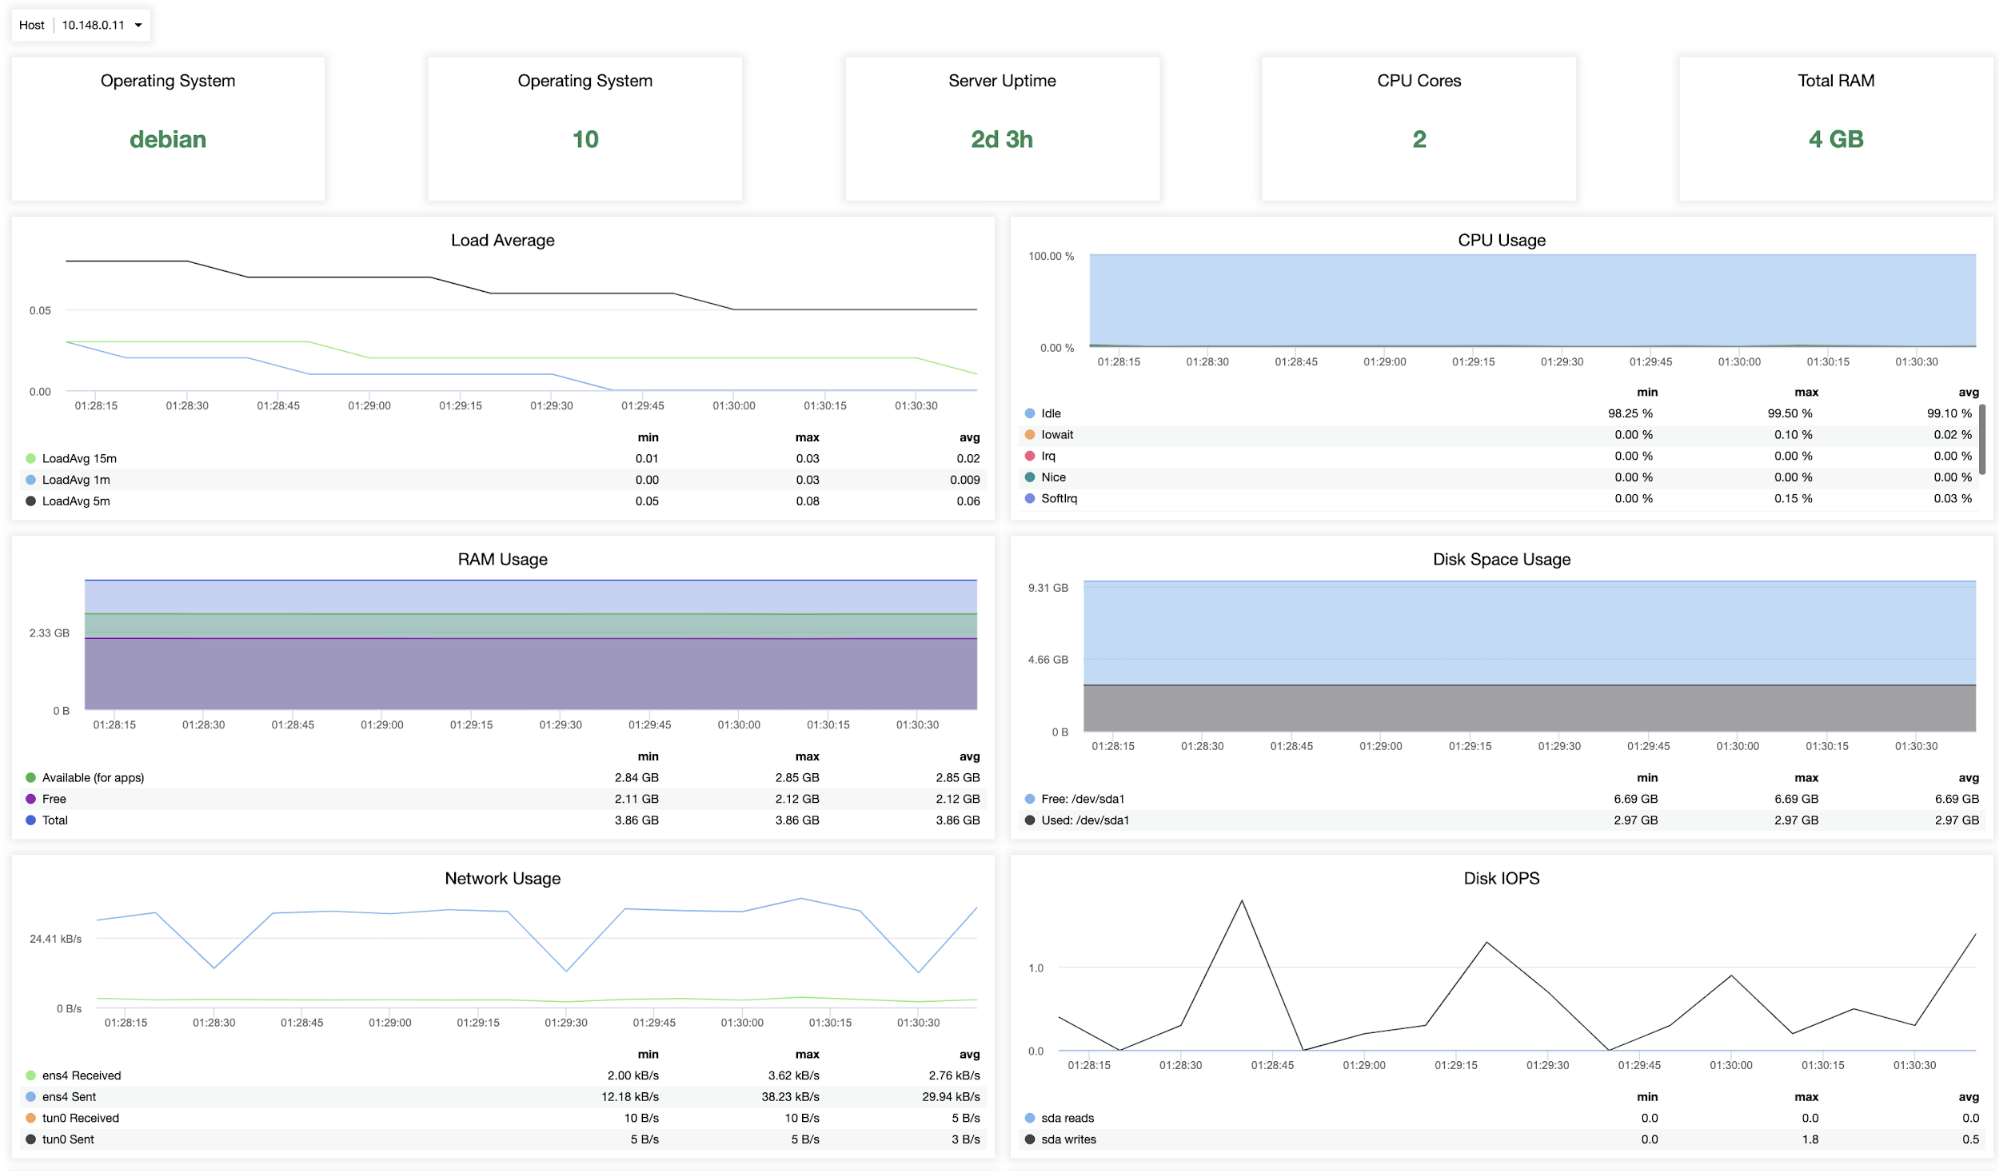
So with all these key areas being monitored, the question is, how it shall be monitored? It has to be monitored at least per-minute. With refined monitoring, i.e. per-second of collective metrics can be resource intensive and much greedy in terms of your resources. Although half-a-minute of collectivity is acceptable especially if your data and RPO (recovery point objective) is very low, so you need more granular and real-time data metrics. It is very important that you are able to oversee the whole picture of your database cluster. Aside from this, it’s also best and important that whenever what metrics you are monitoring, you have the right tool to tap your attention when things are in danger or even just warnings. Using the proper tool such as ClusterControl helps you manage these key areas to be monitored. I’m using a free version or community edition of ClusterControl which helps me monitor my nodes without any hassle from installation up to the monitoring of nodes by just a few clicks. For example, see the screenshots below:
It also provides a per node basis with a simple graph overview,
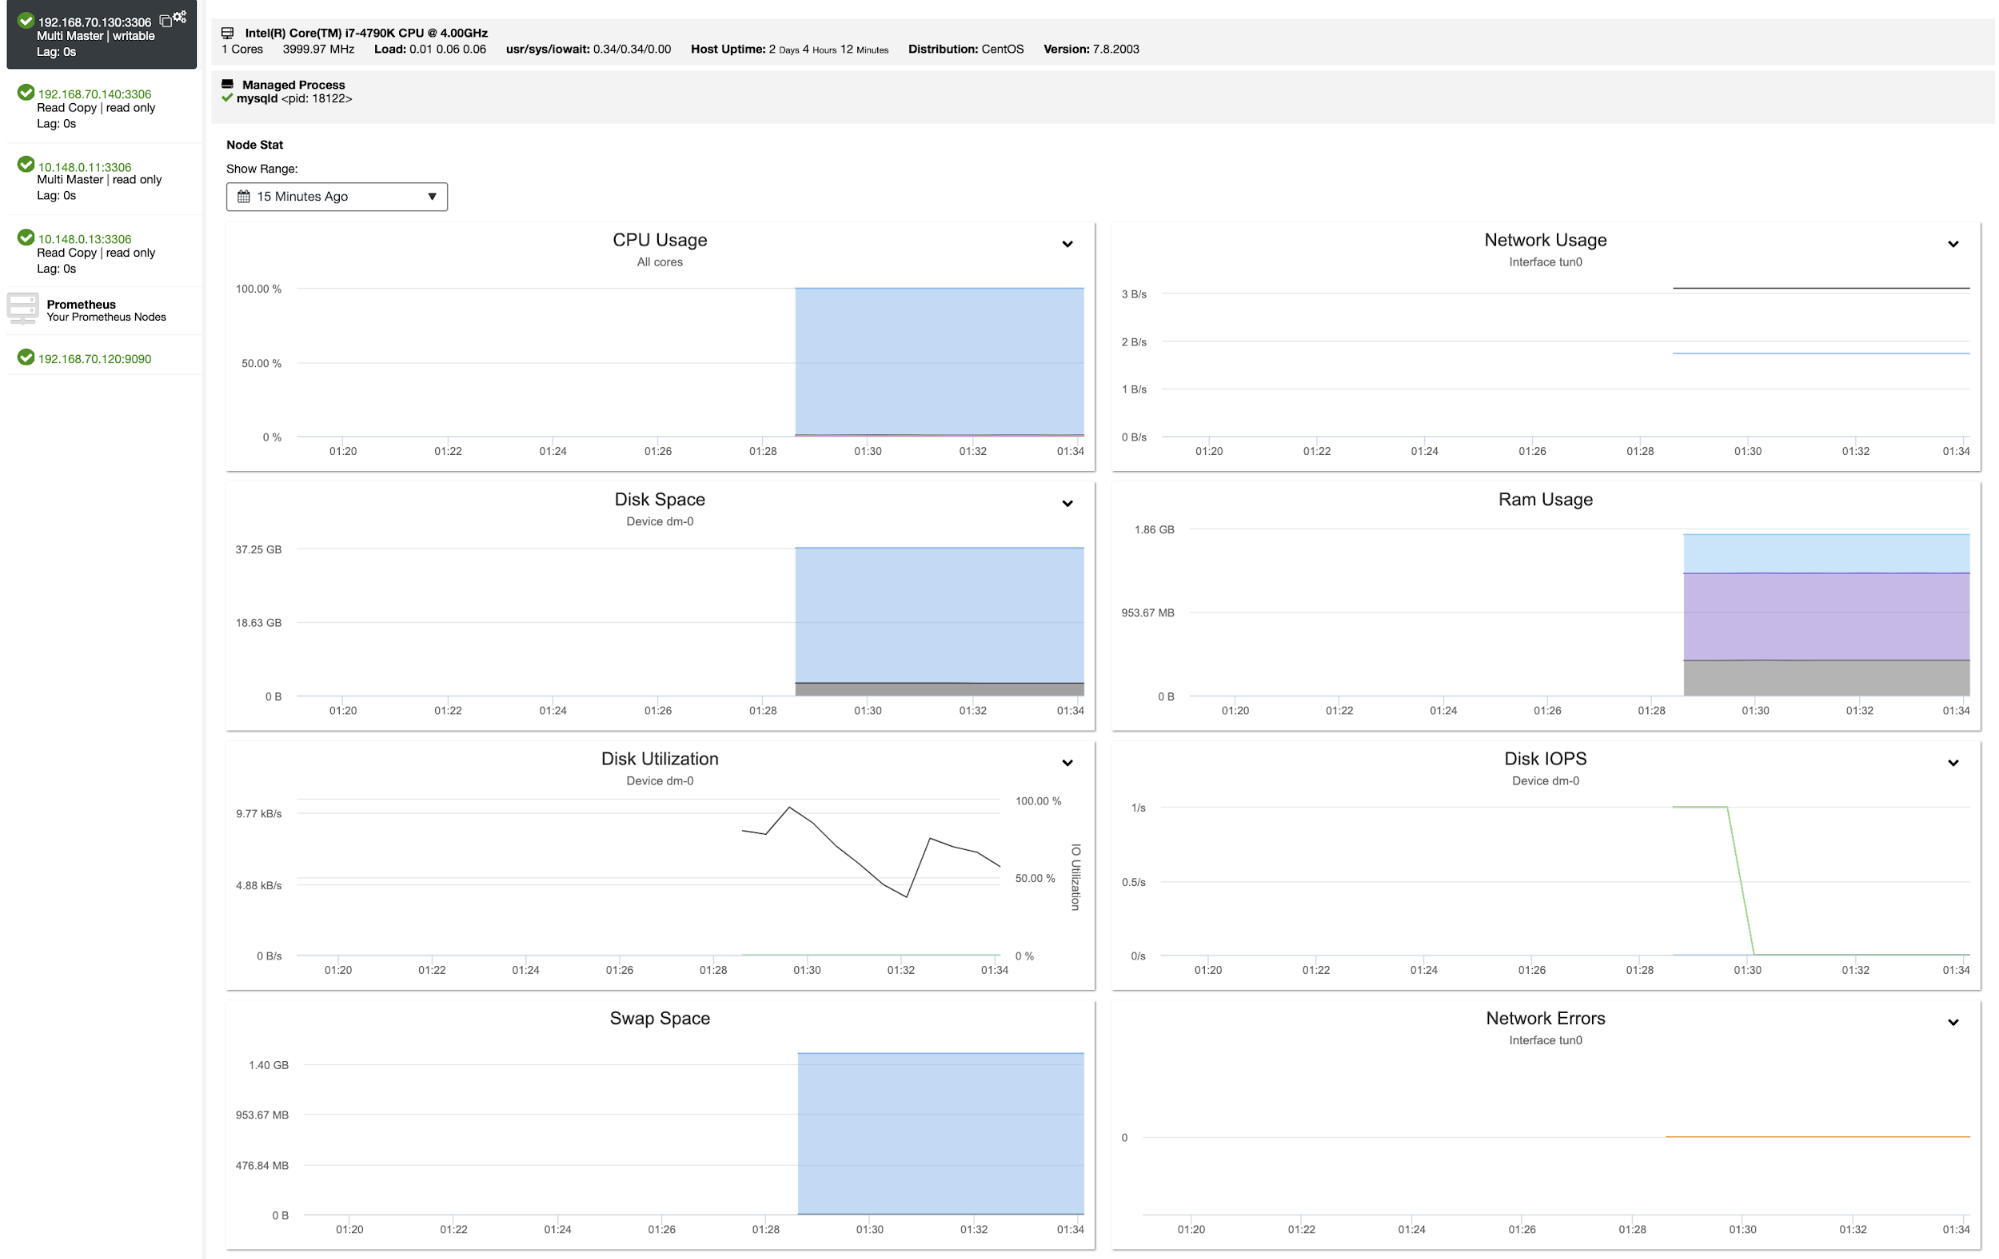
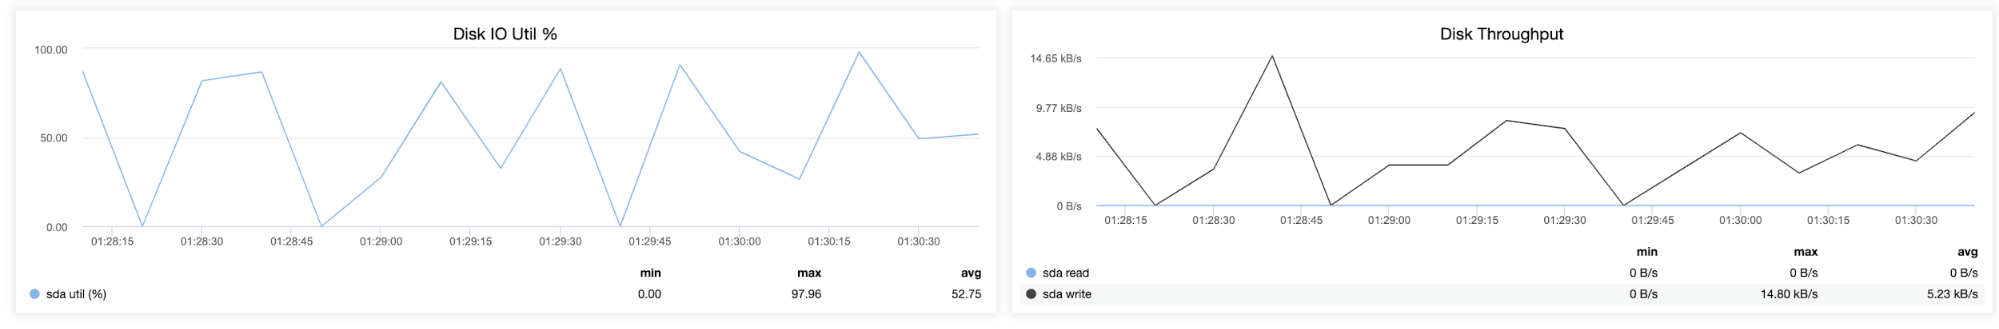
or with a more powerful and rich data model which also supports query language using Prometheus, can provide you analysis of how your MariaDB database performs based on historical data comparing its performance in a timely manner. For example,
That just provides you more visible metrics. So you see how important it really is to have the right tool when monitoring your MariaDB database in a Hybrid Cloud.
Collective Monitoring of Your MariaDB Statistic Variables
From time to time, it cannot be inevitable that MariaDB database versions will produce new stats to monitor or enhance the nature of monitoring the database by providing more status variables and refine values to look upon.
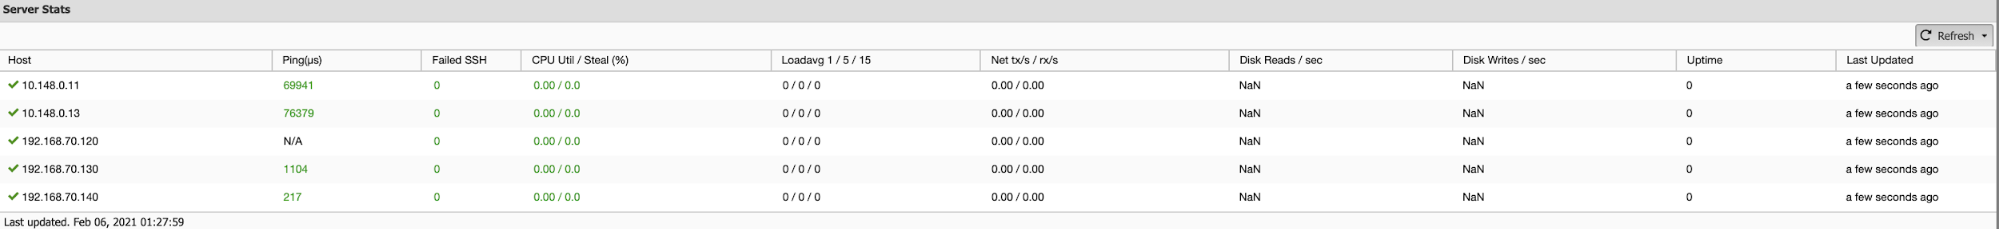
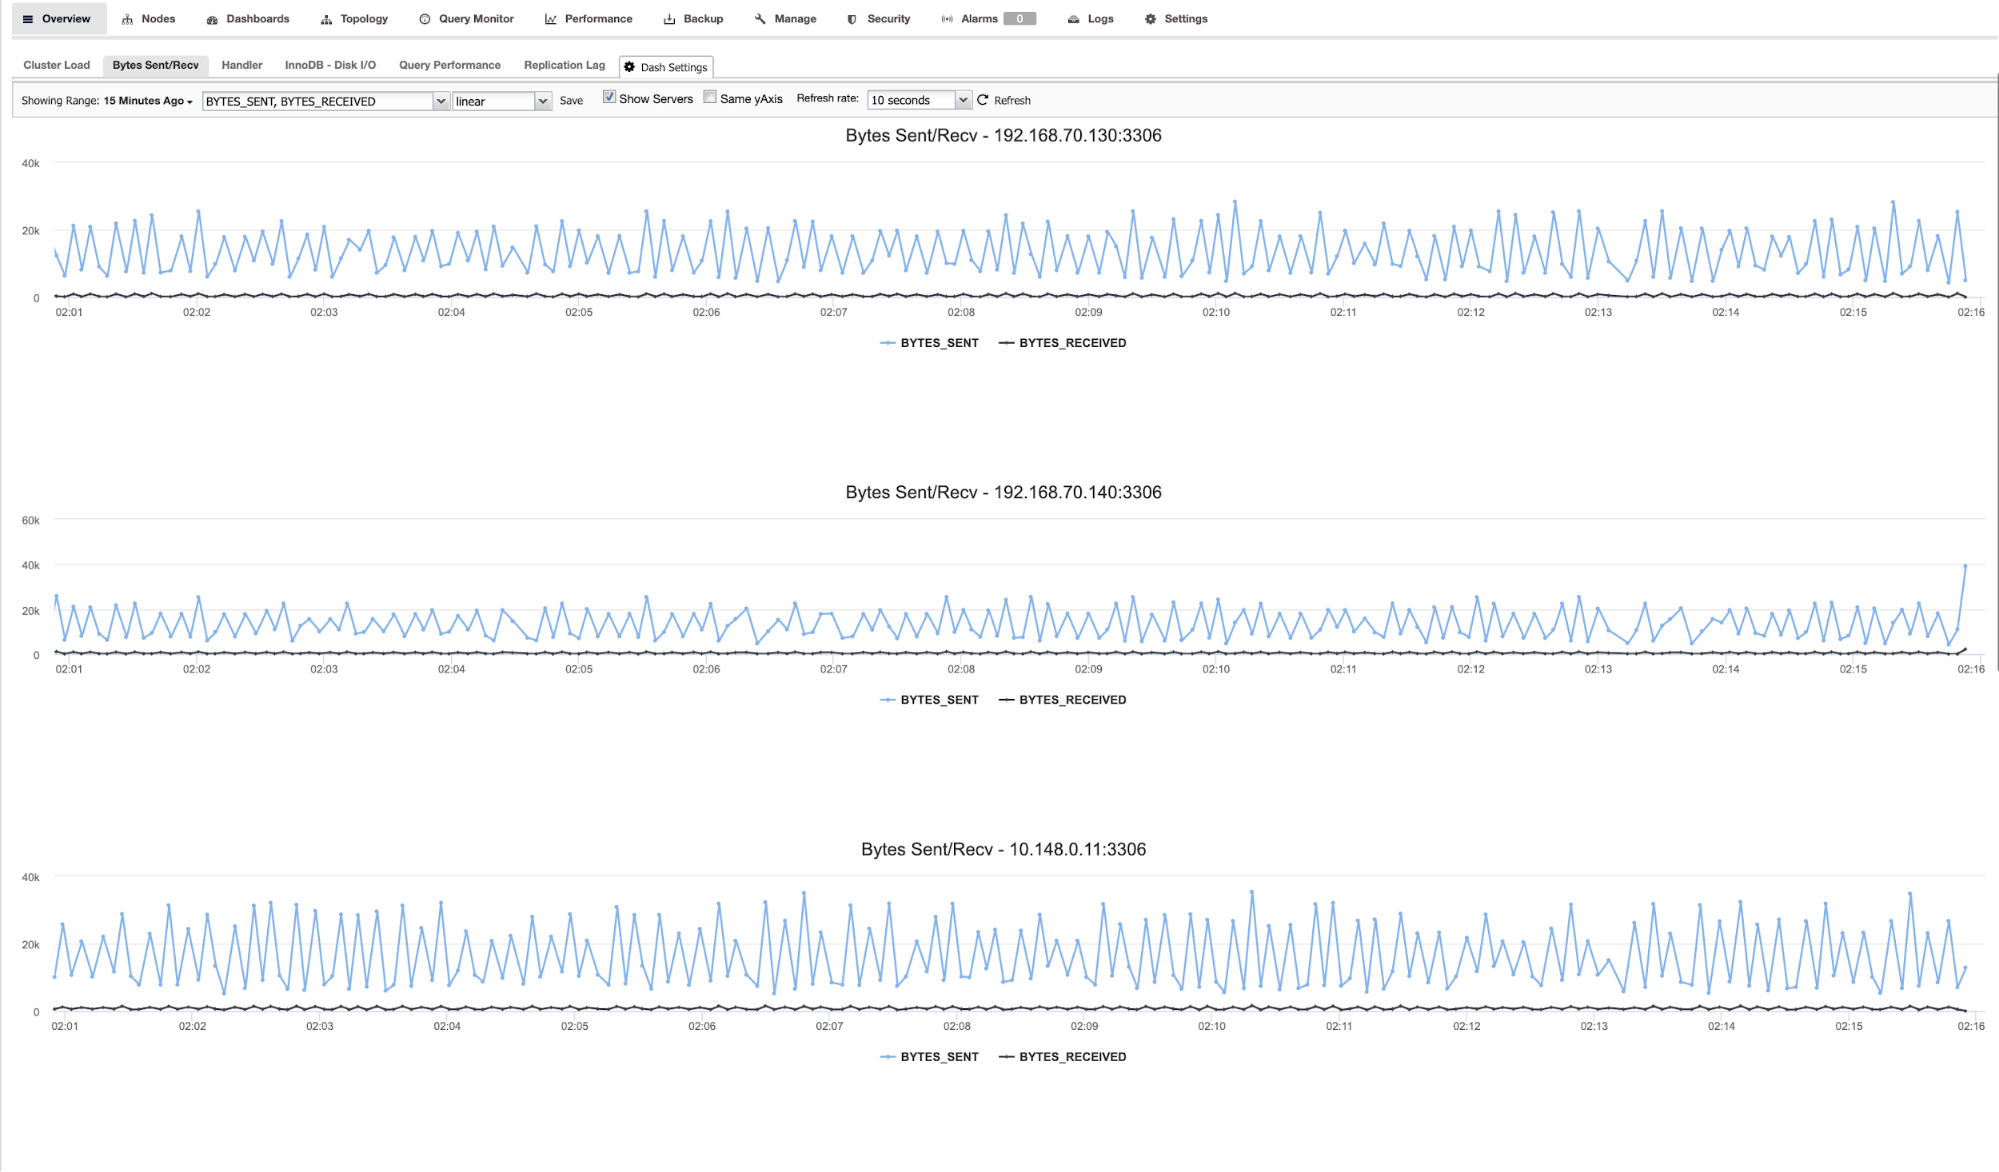
Bytes Sent/Received
The bytes sent or received correlates with the networking activity and is one of the key areas to look side-by-side especially in a hybrid cloud topology. This allows you to determine which node is the most impacted or attributing to the performance issues that are suffering within your MariaDB database. It is very important as you can check if there can be any degradation in terms of hardware such as your network device or the underlying storage device for which syncing of dirty pages can take too much time to be done.
See the example screenshot,
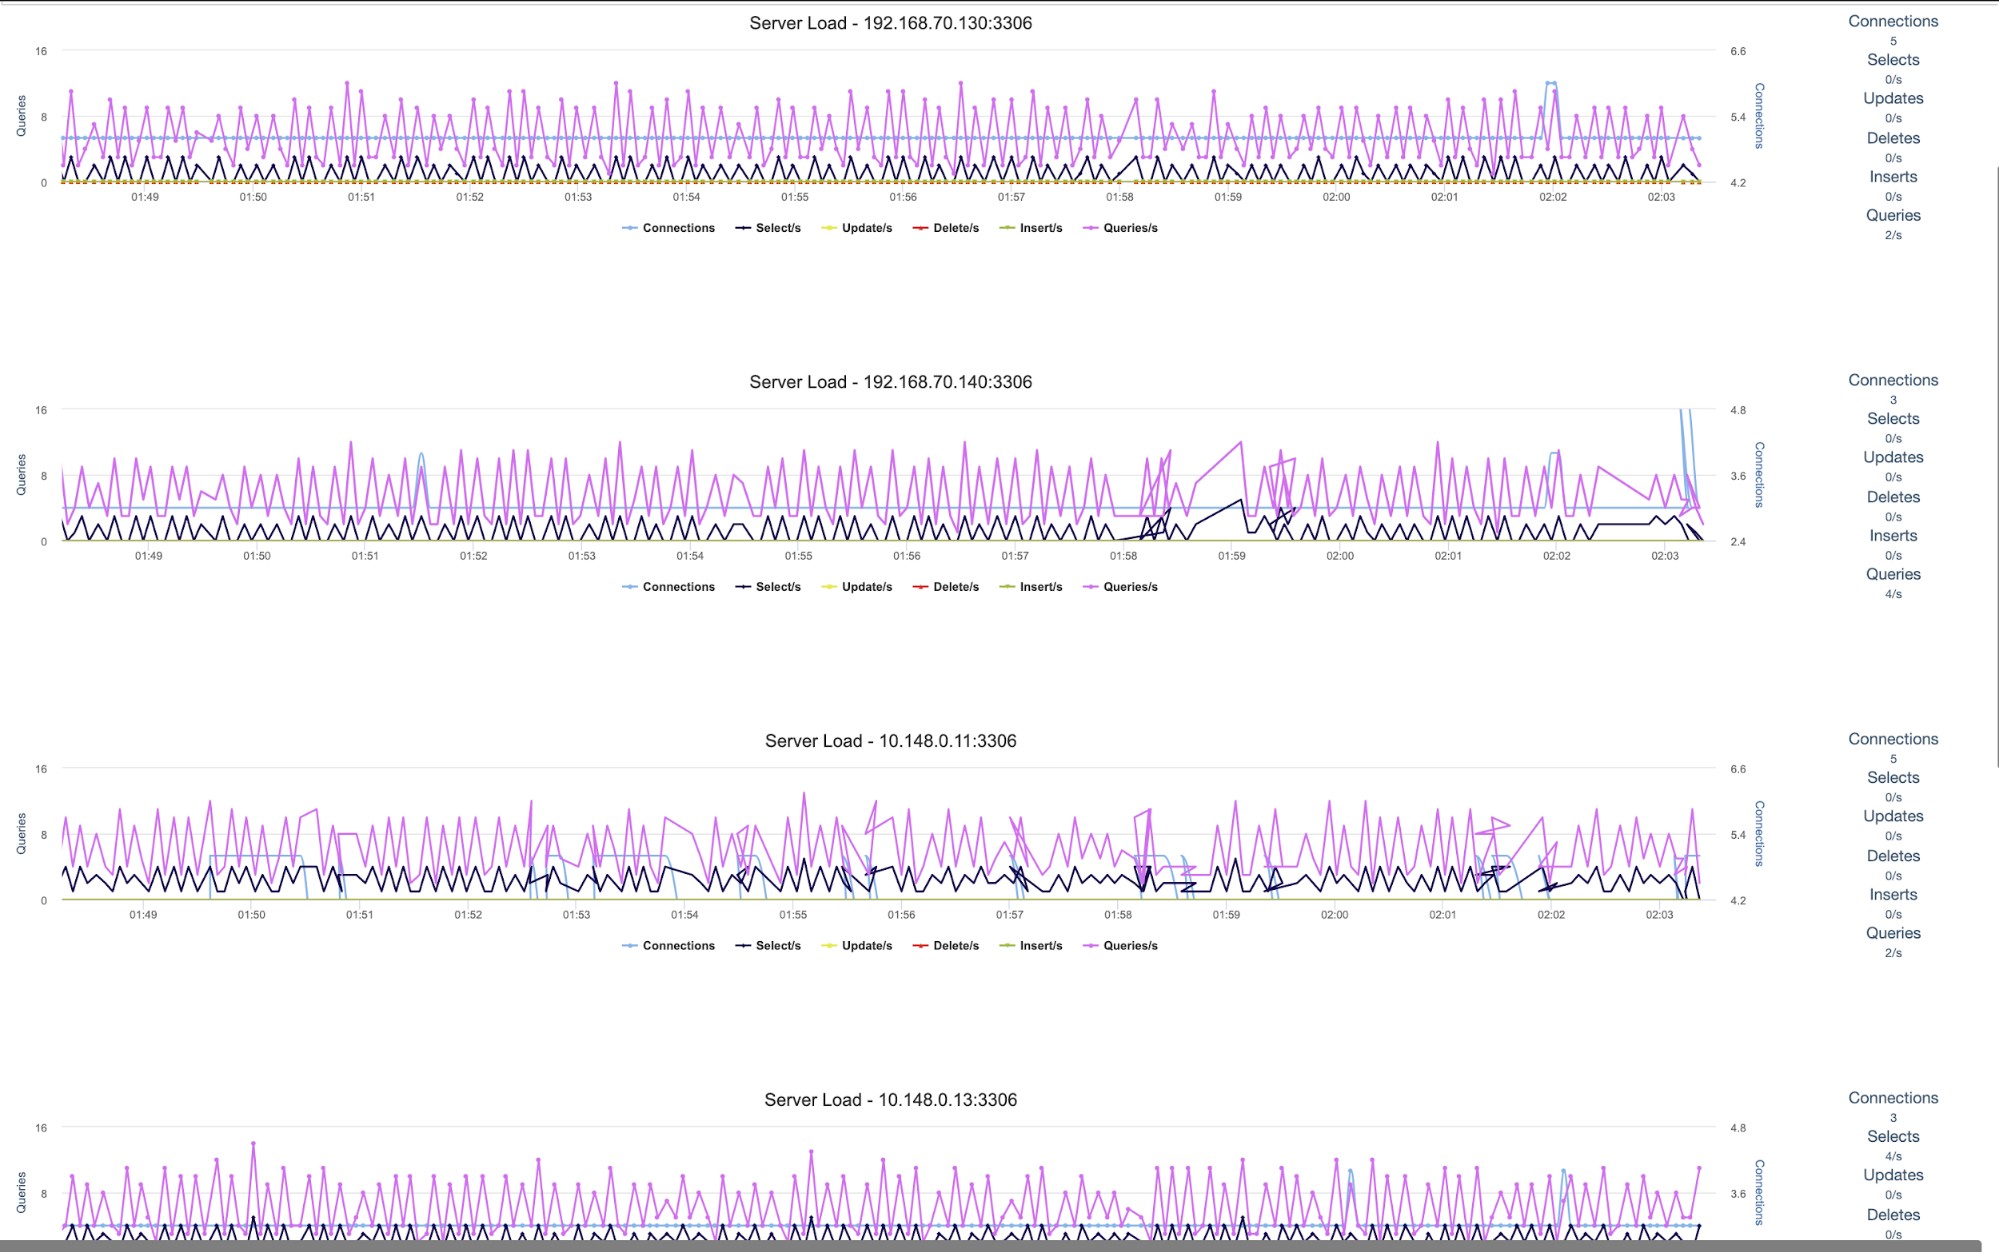
Cluster Load
This is more of the database activity of how much changes or data retrieval have been queried or done so far since the server’s uptime. It helps you rule out what kind of queries are mostly affecting your database cluster performance. This allows you to provide room for improvement especially on balancing the load of your database requests.
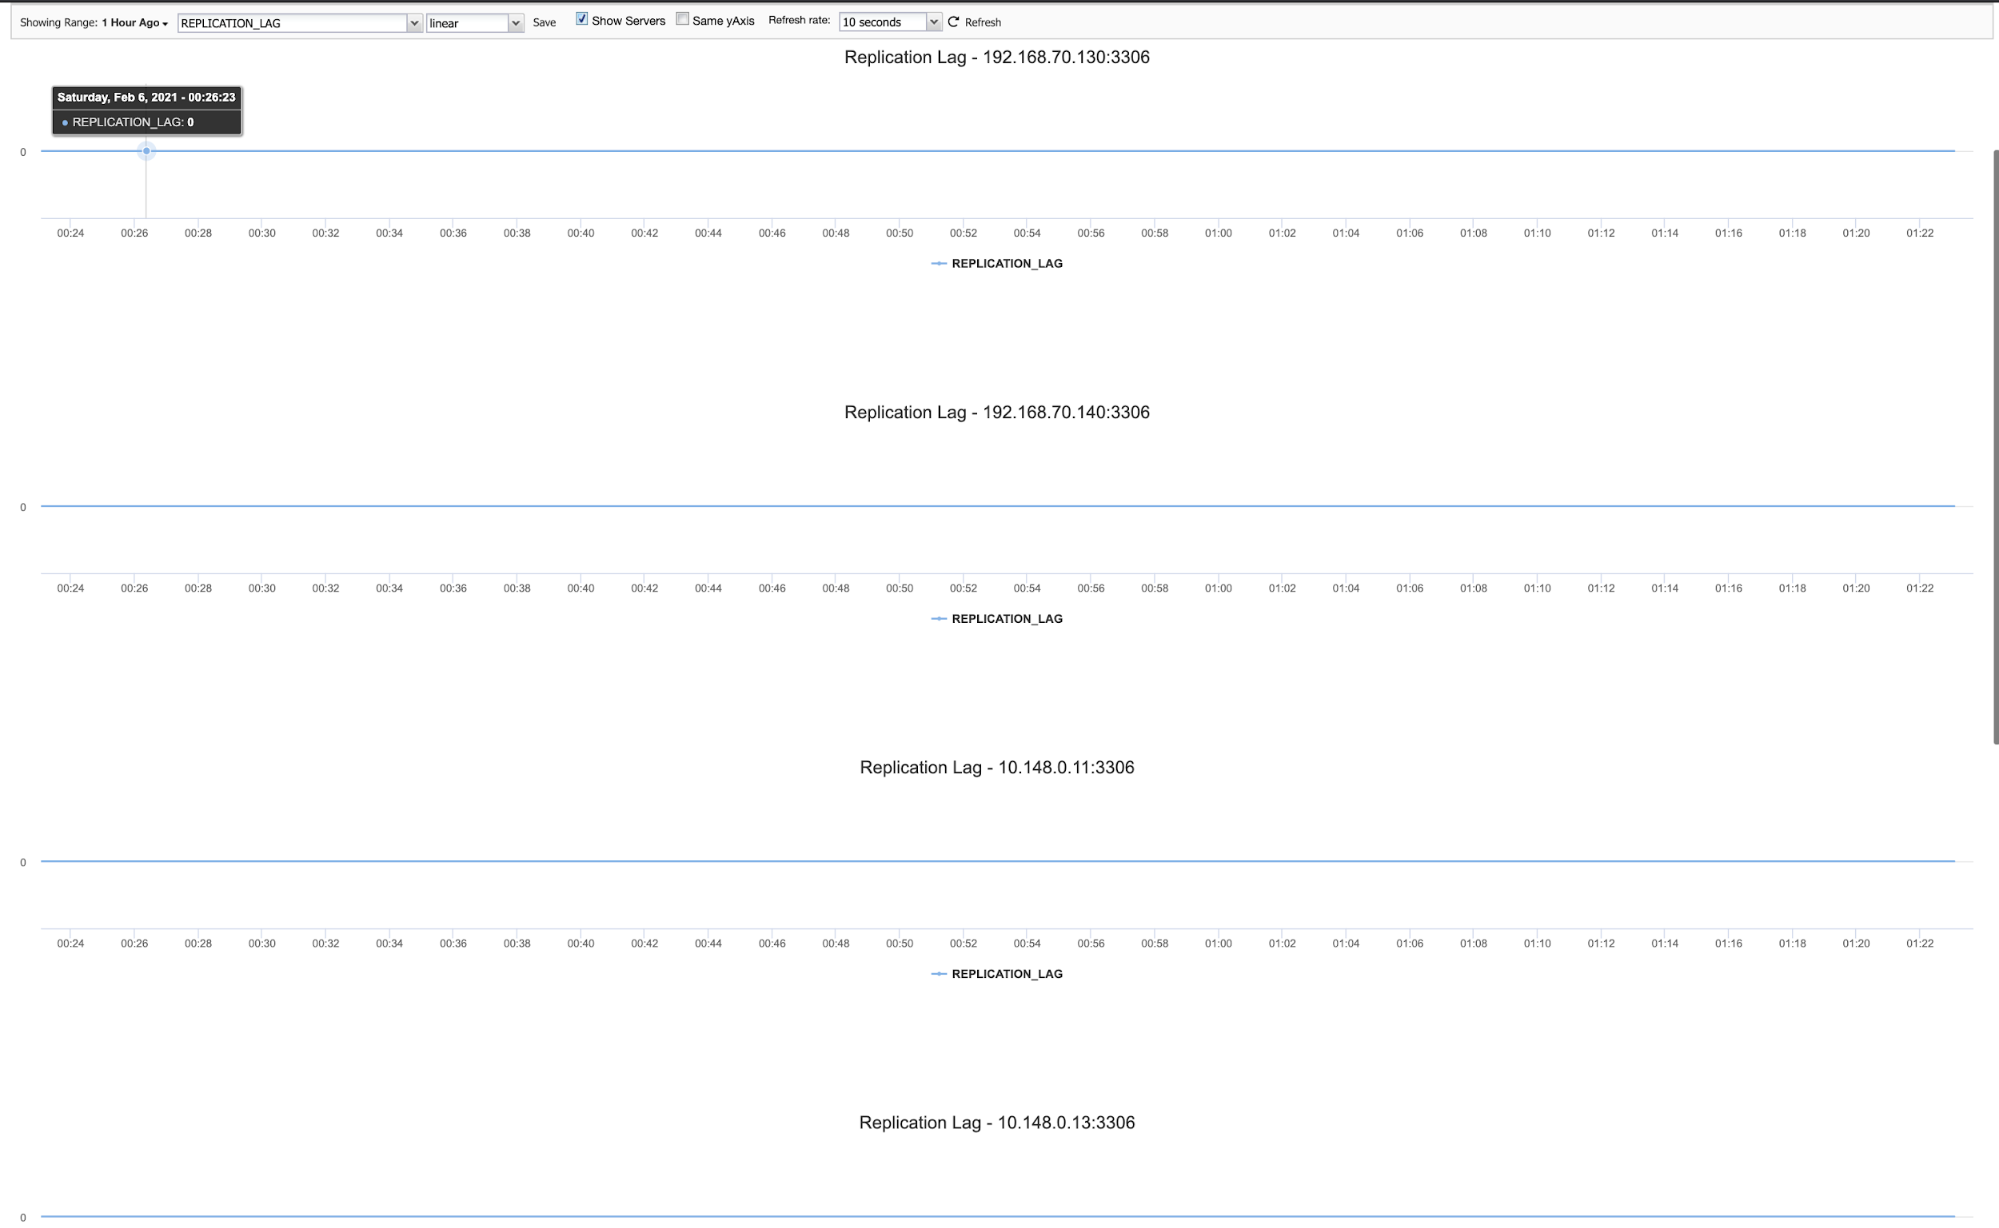
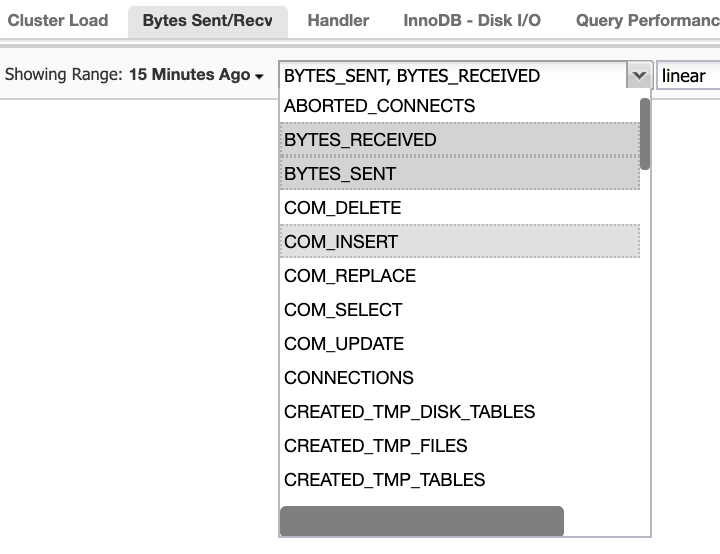
As such, there are tons of variables to look upon in a MariaDB database server. The most important thing here you have to take into account is the tool you are using for monitoring your database cluster. With ClusterControl (Community Edition), it provides me with more ways with the flexibility to look upon in a MariaDB database. See the example below,
Then you can also select from the drop down menu for the other variables to look upon,
This is very useful and helps you out determine for example in a replication topology in a hybrid cloud. You can get a quick overview of what’s the state and performance related to network but also with other variable pointers to consider and check what are the bottlenecks that would affect your MariaDB performance in a hybrid cloud topology. You can determine if your application is greedy with writes, then the replication and network transfer is impacted, you can get the cluster inter-activity within two or more cloud infra. It’s best to determine how well your nodes can handle the stress. Especially during stress testing before pushing specific changes in your application, it’s always best to try and test to determine the capacity management of your application product and determine if your current database nodes and design can handle the load of your application requirements.
For more granular and rich data metrics, you can get more data using agent-based monitoring. See below,
This is how you shall approach the monitoring of your MariaDB Cluster. A perfect visualization is always easier and quicker to manage. When things go south, you cannot afford to lose your productivity and also the downtime can impact your business. Although having a free version does not provide you with the luxury and comfort when managing high traffic databases; having alarms, notifications, and database management in one area is a-walk-in-the-park add-ons that ClusterControl can do.
Conclusion
Monitoring your MariaDB database servers in a hybrid cloud environment is not easy and it’s also complicated especially when there are numbers of services and complex relationships that formulates the whole stack of your technology. Using the right tools for monitoring helps you to manage your application effectively and improve productivity at the same time. Also, with the right monitoring tools in hand, you will have more time to focus on improving your applications along with other business processes.


