blog
How to Monitor PostgreSQL Running Inside a Docker Container: Part Two

This is the second part of the multi-series How to Monitor PostgreSQL Running Inside a Docker Container. In Part 1, I presented an overview of docker containers, policies and networking. In this part we will continue with docker configuration and finally enable monitoring via ClusterControl.
PostgreSQL is an old school, open-source database whose popularity is still increasing, being widely used and accepted on most cloud environments of today.
When it’s used inside of a container it can be easily configured and managed by Docker, using different tags for the creation and shipped to any computer in the world with Docker installed, but this is all about Docker.
Now we will discuss about PostgreSQL, and to start, let’s list their six main processes running simultaneously inside of a container by the OS user called “postgres”, which is a different one from the “postgres” user inside of the database, that one is a super user.
Remember that the blue arrow in the images is displaying commands entered inside of a container.
$ ps auxww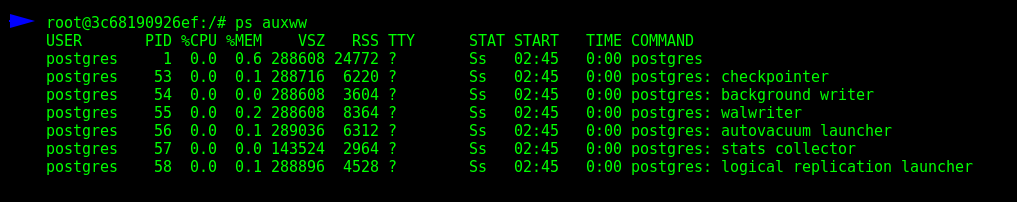
The first process on the list is the PostgreSQL server, and the others are started by him. Their duties are basically to analyze what is going on in the server, being sub-processes performing statistics inputs, writing logs, and these kinds of things.
We will use ClusterControl to monitor the activity inside of this container having the PostgreSQL server, and to do so we will need to have SSH installed in order to connect them safely.
Secure Shell Server (SSH)
To collect the information about the PostgreSQL container, nothing is better than SSH. It gives remote access for one IP address to another, and this all the ClusterControl needs to perform the job.
SSH needs to be downloaded from the repository, and to do so we must be inside of the container.
$ docker container exec -it postgres-2 bash
$ apt-get update && apt-get install -y openssh-server openssh-client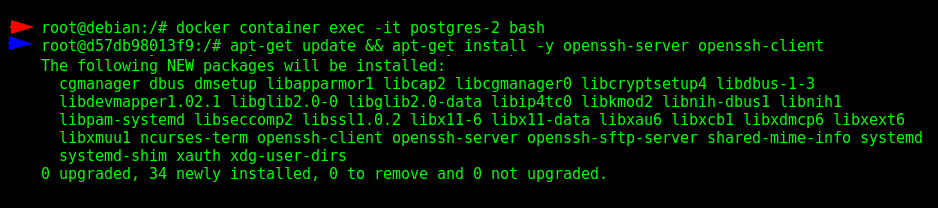
After install we’ll edit the configuration, start the service, setup a password for the root user, and finally leave the container:
$ sed -i 's|^PermitRootLogin.*|PermitRootLogin yes|g' /etc/ssh/sshd_config
$ sed -i 's|^#PermitRootLogin.*|PermitRootLogin yes|g' /etc/ssh/sshd_config
$ service ssh start
$ passwd
$ exit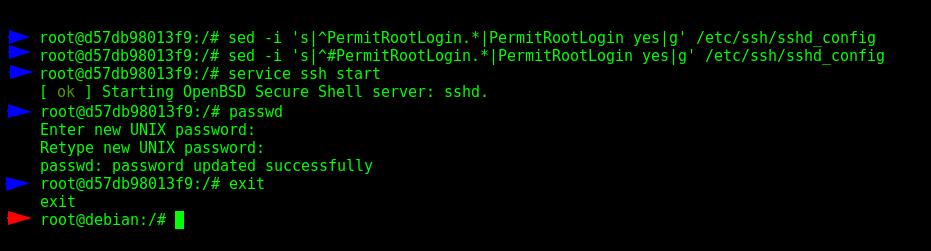
Monitoring with ClusterControl
ClusterControl has an in-depth integration system able to monitor all the processes of PostgreSQL in real-time, also coming with a library of Advisors to keep the data secure, track the database performance, and of course providing alerts when anomalies happens.
With SSH configured, ClusterControl can monitor the OS hardware activity and give insights about both the database and the outside layer.
We will run be running a new container, and publishing it to the port 5000 of our computer, then we will be able to access the system through our browser.
$ docker container run --name s9s-ccontrol --network bridge-docker -p 5000:80 -d severalnines/clustercontrol
Once deployed, only remains the SSH configuration, and we have good news, because we are in a User-Defined Bridge Network, we can use DNS!
$ docker container exec -it s9s-ccontrol bash
$ ssh-copy-id postgres-2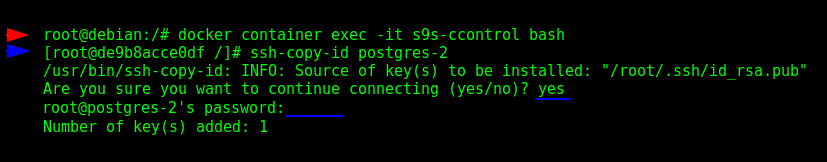
After enter “yes” and specify the password provided earlier, it’s possible to access the “postgres-2” container as root using SSH:
$ ssh postgres-2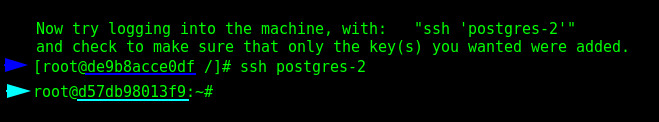
This new color, light blue, will be used in the following to represent the activity inside of the database. In the example above we have accessed the “postgres-2” container from “s9s-ccontrol”, but it’s still the root user. Keep your attention and criticism with me.
So the next step is going to the browser and access http://localhost:5000/clustercontrol/users/welcome/ and register an account, or if you already have one, visit http://localhost:5000/clustercontrol/users/login.
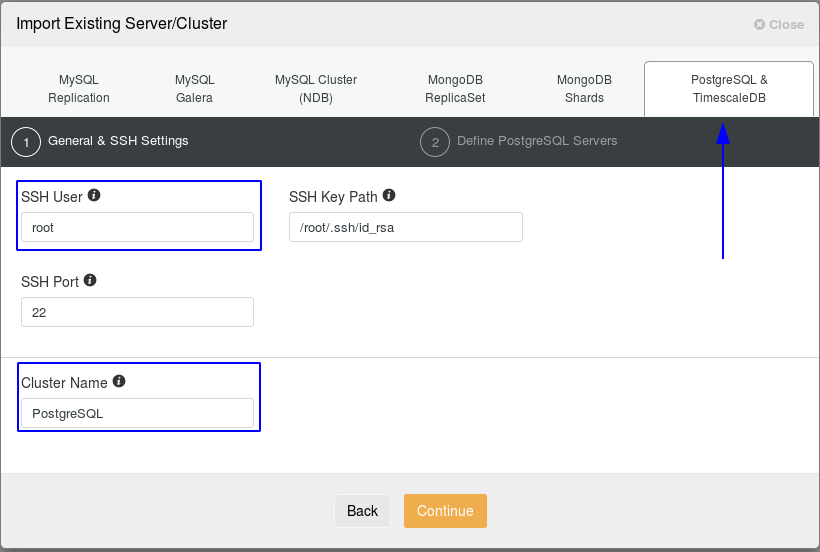
Then “Import Existing Server/Cluster” and enter the earlier configuration. The tab “PostgreSQL & TimescaleDB” must be selected. In the field “SSH User” for this demonstration just type “root”. Then finally enter the “Cluster Name”, and it can be any name that you want, is simply who will hold as many necessaries PostgreSQL containers that you want to import and monitor.
Now it’s time to enter the information about the PostgreSQL container, the User “postgres”, Password “5af45Q4ae3Xa3Ff4” and the desired containers. It’s extremely important to remember that the SSH service must be active inside of the PostgreSQL container.
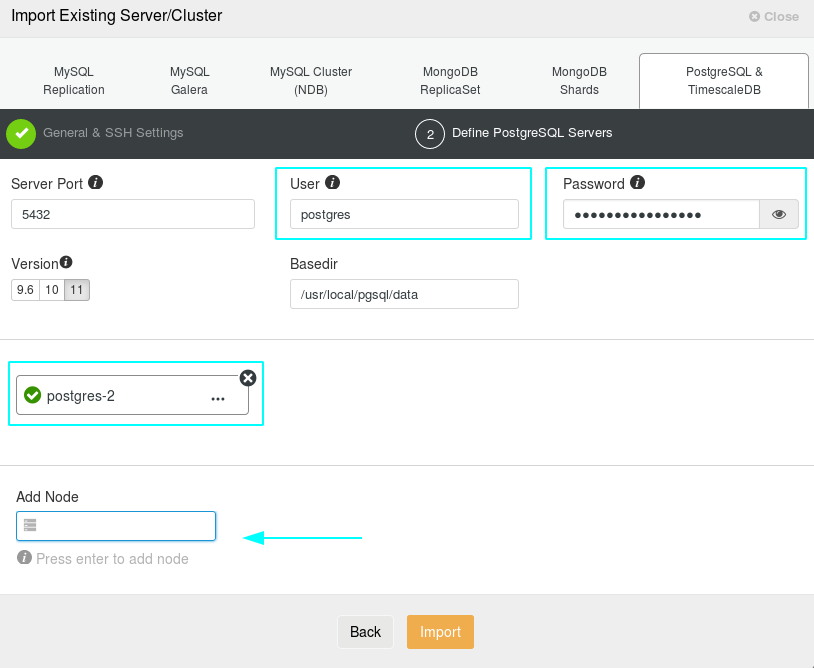
After press the “Import” button, ClusterControl will start to manage the PostgreSQL container “postgres-2” inside of the Cluster called “PostgreSQL”, and it will inform when the process of importing is done.
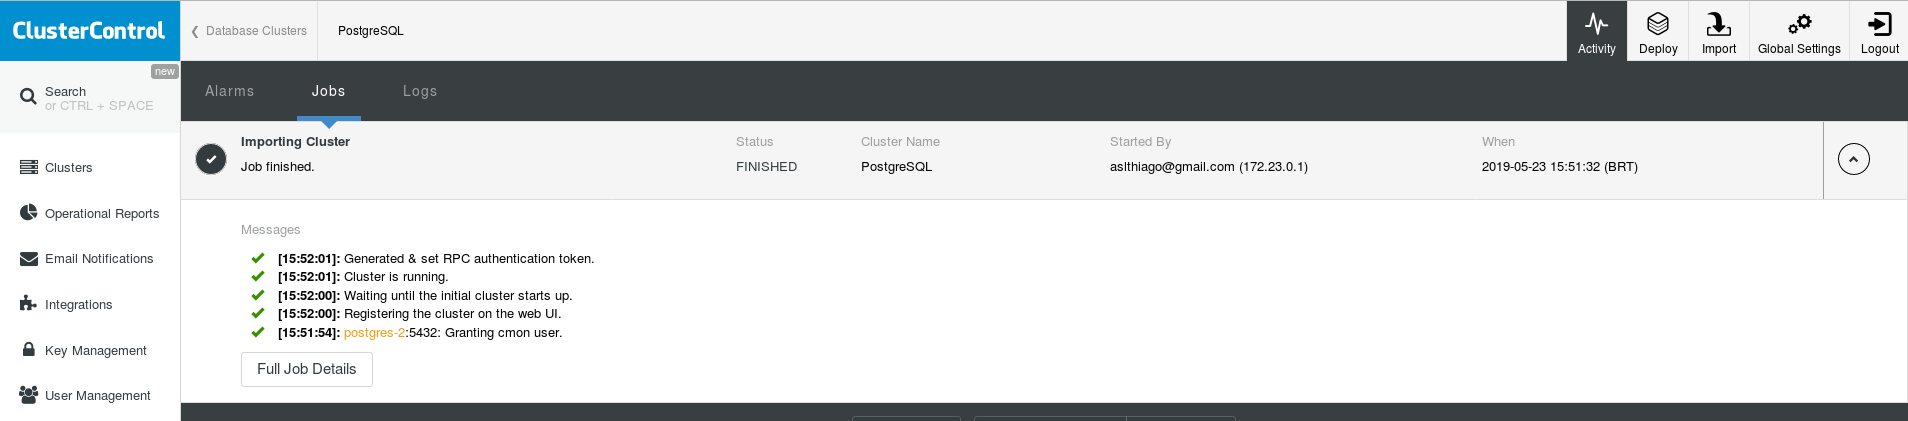
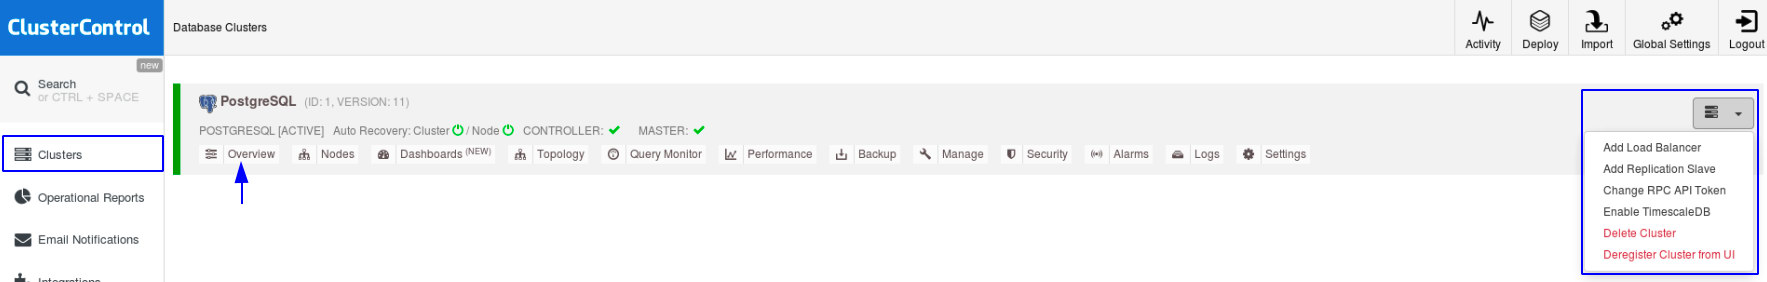
Once finished, the system will be shown under the Clusters tab, our most recently created Cluster and different options separated in sections
Our first visualization step will be in the Overview option.
As you can imagine, our database is empty and we don’t have any chaos here for our fun, but the graphic still works being engaged in a small scale containing statistics about the SQL and Database processes.
Real World Scenario Simulation
To give some action, I’ve created a CSV file using Python, exploring the GitHub repository of Socratica, who provides amazing courses on YouTube, and they make those files available for free.
In summary, the created CSV file have 9 millions, 999 thousands and 999 records about persons, each one containing ID, first name, last name, and birthday. The size of the file is 324 MB:
$ du -s -h persons.csvWe will copy this CSV file into the PostgreSQL container, then copy it again but this time into the database, and finally check the statistics in ClusterControl.
$ docker container cp persons.csv postgres-2:/persons.csv
$ docker container exec -it postgres-2 bash
$ du -s -h persons.csv
$ su - postgres
$ psql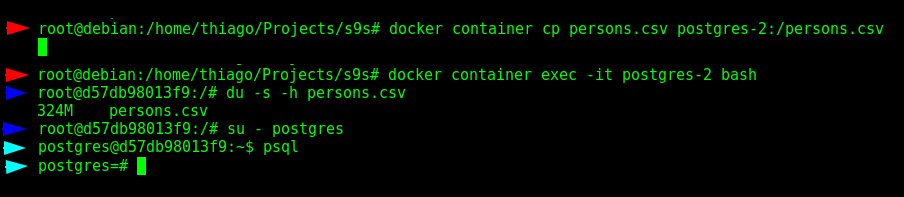
Ok, so we are in the database now, as the super user “postgres”, please note the different colors in the arrows.
Now, we must create the database, table, and populate it with the data contained in the CSV file, and finally check if everything is working fine.
$ CREATE DATABASE severalnines;
$ c severalnines;
$ CREATE TABLE persons (id SERIAL NOT NULL, first_name VARCHAR(50), last_name VARCHAR(50), birthday DATE, CONSTRAINT persons_pkey PRIMARY KEY (id));
$ COPY persons (id, first_name, last_name, birthday) FROM '/persons.csv' DELIMITER ',' CSV HEADER;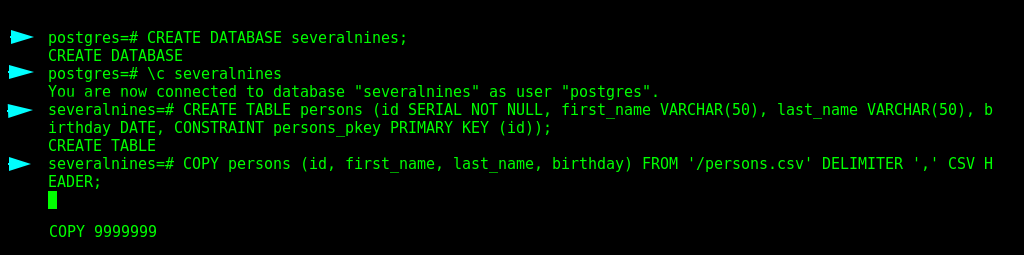
This process takes some minutes to complete.
Ok, so now let’s enter some queries:
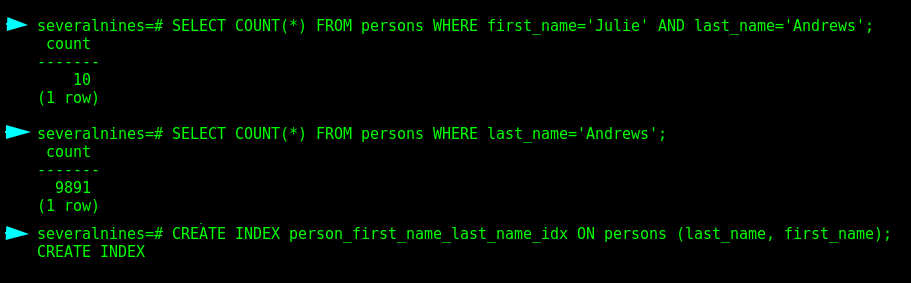
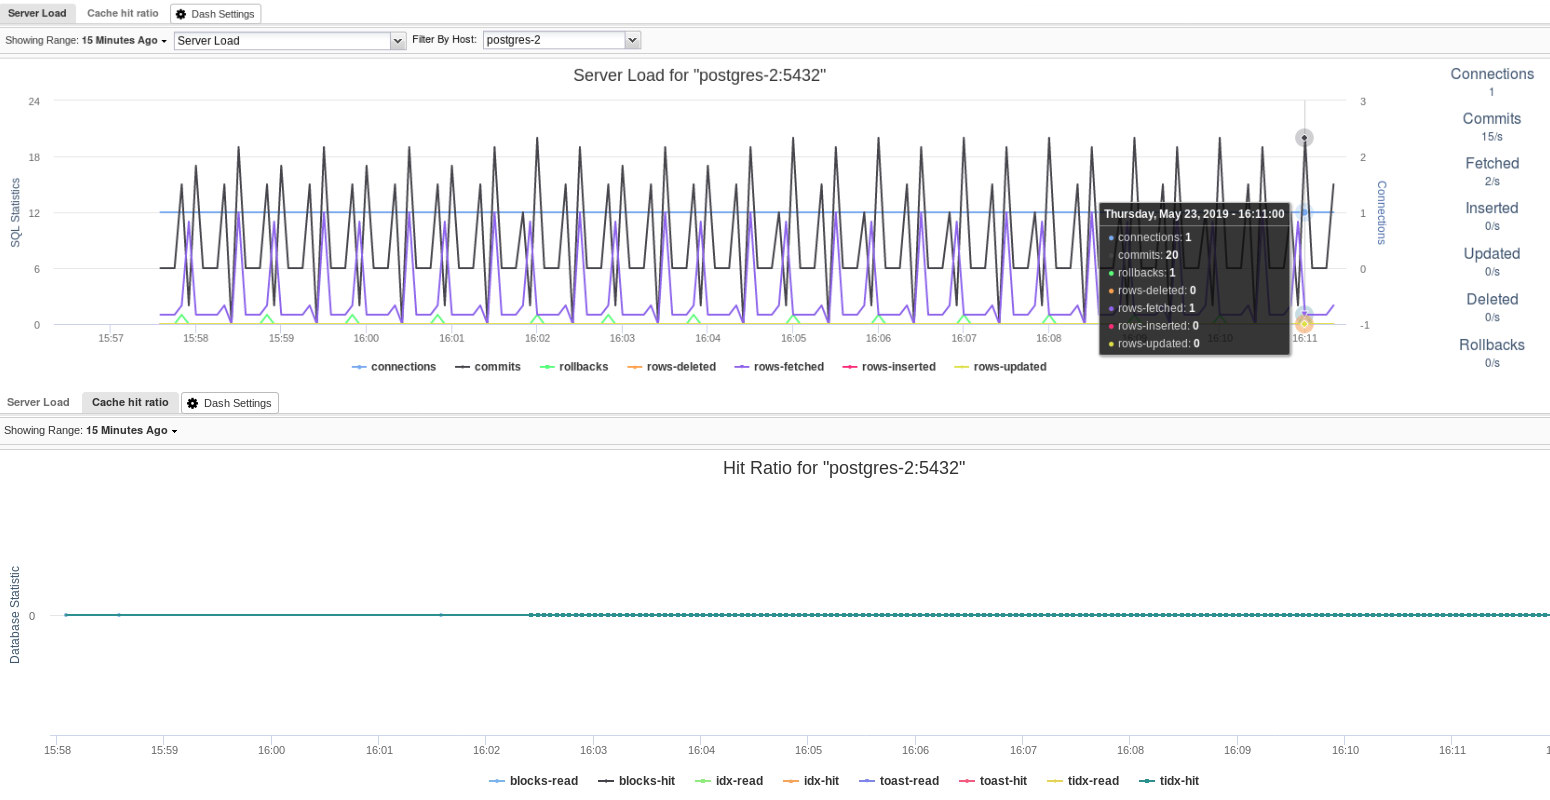
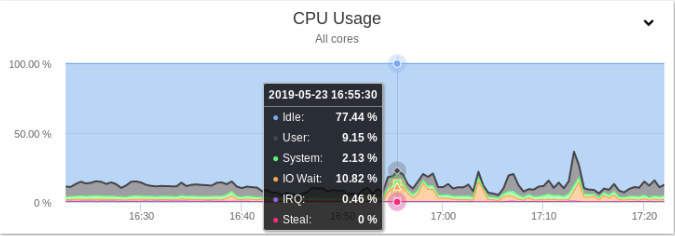
If you look at ClusterControl now, some movement in the statistics about the hardware happened:
An entire section to monitor the queries is provided with ease of use UI:
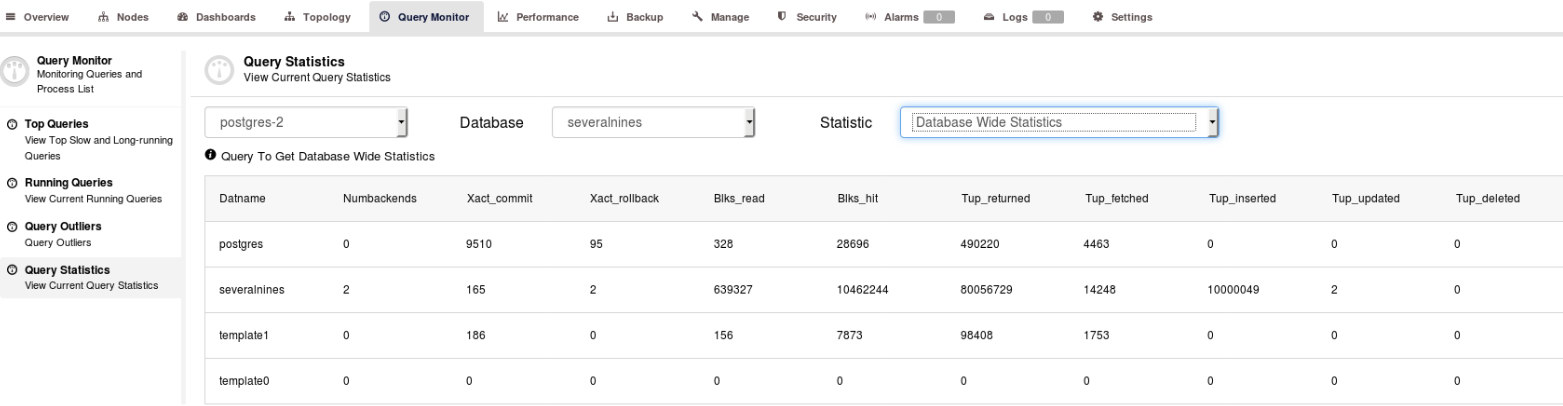
Statistics about the PostgreSQL database serve the best DBAs to perform their entire potential on their main duties, and ClusterControl is a complete system to analyze every activity happening at real time, giving information based on all the data collected from the database processes.
With ClusterControl the DBA also can easily extend their skills using a full set of tools to create Backups locally or in the Cloud, Replications, Load Balancers, integrations with services, LDAP, ChatOps, Prometheus, and so much more.
Conclusion
Through this article, we’ve been configuring PostgreSQL inside of Docker, and integrating with ClusterControl using User-Defined Bridge Network and SSH, simulating a scenario populating the database with a CSV file, and then doing an overall quick check in the ClusterControl user interface.


