blog
The DevOps Open-Source Database Audit Manual – Everything You Should Know

Auditing is the monitoring and recording of selected user database actions. It is typically used to investigate suspicious activity or monitor and gather data about specific database activities. For example, the database administrator can gather statistics about which tables are being updated, how many operations are performed, or how many concurrent users connect at particular times.
In this blog post, we are going to cover the fundamental aspects of auditing our open-source database systems, especially MySQL, MariaDB, PostgreSQL and MongoDB. This article is targeted towards DevOps engineers who commonly have less experience or exposure in audit compliance best-practice and good data governance when managing the infrastructure primarily for the database systems.
Statement Auditing
MySQL Statement Auditing
MySQL has the general query log (or general_log), which basically records what mysqld is doing. The server writes information to this log when clients connect or disconnect, and it logs each SQL statement received from clients. The general query log can be very useful when troubleshooting but not really built for continuous auditing. It has a big performance impact and should be only enabled during short time slots. There are other options to use performance_schema.events_statements* tables or Audit Plugin instead.
PostgreSQL Statement Auditing
For PostgreSQL, you can enable the log_statment to “all”. Supported values for this parameter are none (off), ddl, mod, and all (all statements). For “ddl”, it logs all data definition statements, such as CREATE, ALTER, and DROP statements. For “mod”, it logs all DDL statements, plus data-modifying statements such as INSERT, UPDATE, DELETE, TRUNCATE, and COPY FROM.
You probably need to configure the related paratemeters like log_directory, log_filename, logging_collector and log_rotation_age, as shown in the following example:
log_directory     = 'pg_log'
log_filename      = 'postgresql-%Y-%m-%d_%H%M%S.log'
log_statement     = 'all'
logging_collector = on
log_rotation_age  = 10080 # 1 week in minutes
The above changes require a PostgreSQL restart, so please plan carefully before applying to your production environment. You can then find the current logs under the pg_log directory. For PostgreSQL 12, the location is at /var/lib/pgsql/12/data/pg_log/ . Note that the log files tend to grow a lot over time, and might eat the disk space significantly. You could also use log_rotation_size instead if you have limited storage space.
MongoDB Statement Auditing
For MongoDB, there are 3 logging levels that can help us audit the statements (operations or ops in MongoDB term):
-
Level 0 – This is the default profiler level where the profiler does not collect any data. The mongod always writes operations longer than the slowOpThresholdMs threshold to its log.
-
Level 1 – Collects profiling data for slow operations only. By default slow operations are those slower than 100 milliseconds. You can modify the threshold for “slow” operations with the slowOpThresholdMs runtime option or the setParameter command.
-
Level 2 – Collects profiling data for all database operations.
To log all operations, set db.setProfilingLevel(2, 1000), where it should profile all operations with operations that take longer than the milliseconds defined, in this case, is 1 second (1000 ms). The query to look in the system profile collection for all queries that took longer than one second, ordered by timestamp descending will be. To read the operations, we can use the following query:
mongodb> db.system.profile.find( { millis : { $gt:1000 } } ).sort( { ts : -1 } )Also, there is Mongotail project, which simplifies the operation profiling process with an external tool instead of querying directly to the profile collection.
Bear in mind that it is not recommended to run full statement auditing in the production database servers because it commonly introduces a significant impact to the database service with an enormous volume of logging. The recommended way is to use a database audit plugin instead (as shown further down), which provides a standard way of producing audit logs often required to comply with government, financial, or ISO certifications.
Privilege Auditing for MySQL, MariaDB and PostgreSQL
Privilege auditing audits the privileges and access control to the database objects. Access control ensures that the users accessing the database are positively identified and can access, update, or delete the data that they are entitled to. This area is commonly being overlooked by the DevOps engineer which makes over-privileging a common mistake when creating and granting a database user.
Examples of over-privileged are:
-
User’s access hosts are allowed from a very broad range, for example granting user host app1@’%’, instead of an individual IP address.
-
Administrative privileges being assigned to non-administrative database users, for example, a database user for application is being assigned with SUPER or RELOAD privilege.
-
Lack of resource control against any kind of excessive usage like Max User Connections, Max Queries Per Hour, or Max Connections Per Hour.
-
Allow specific database users to access other schemas as well.
For MySQL, MariaDB and PostgreSQL, you can perform privilege auditing via the Information Schema by querying the grant, role and privileges-related tables. For MongoDB, use the following query (requires viewUser action for other databases):
mongodb> db.getUsers( { usersInfo: { forAllDBs: true } } )ClusterControl provides a nice summary of the privileges assigned to a database user. Go to Manage -> Schemas and Users -> Users and you will get a report of users’ privileges, together with the advanced options like Requires SSL, Max Connections Per Hour and so on.
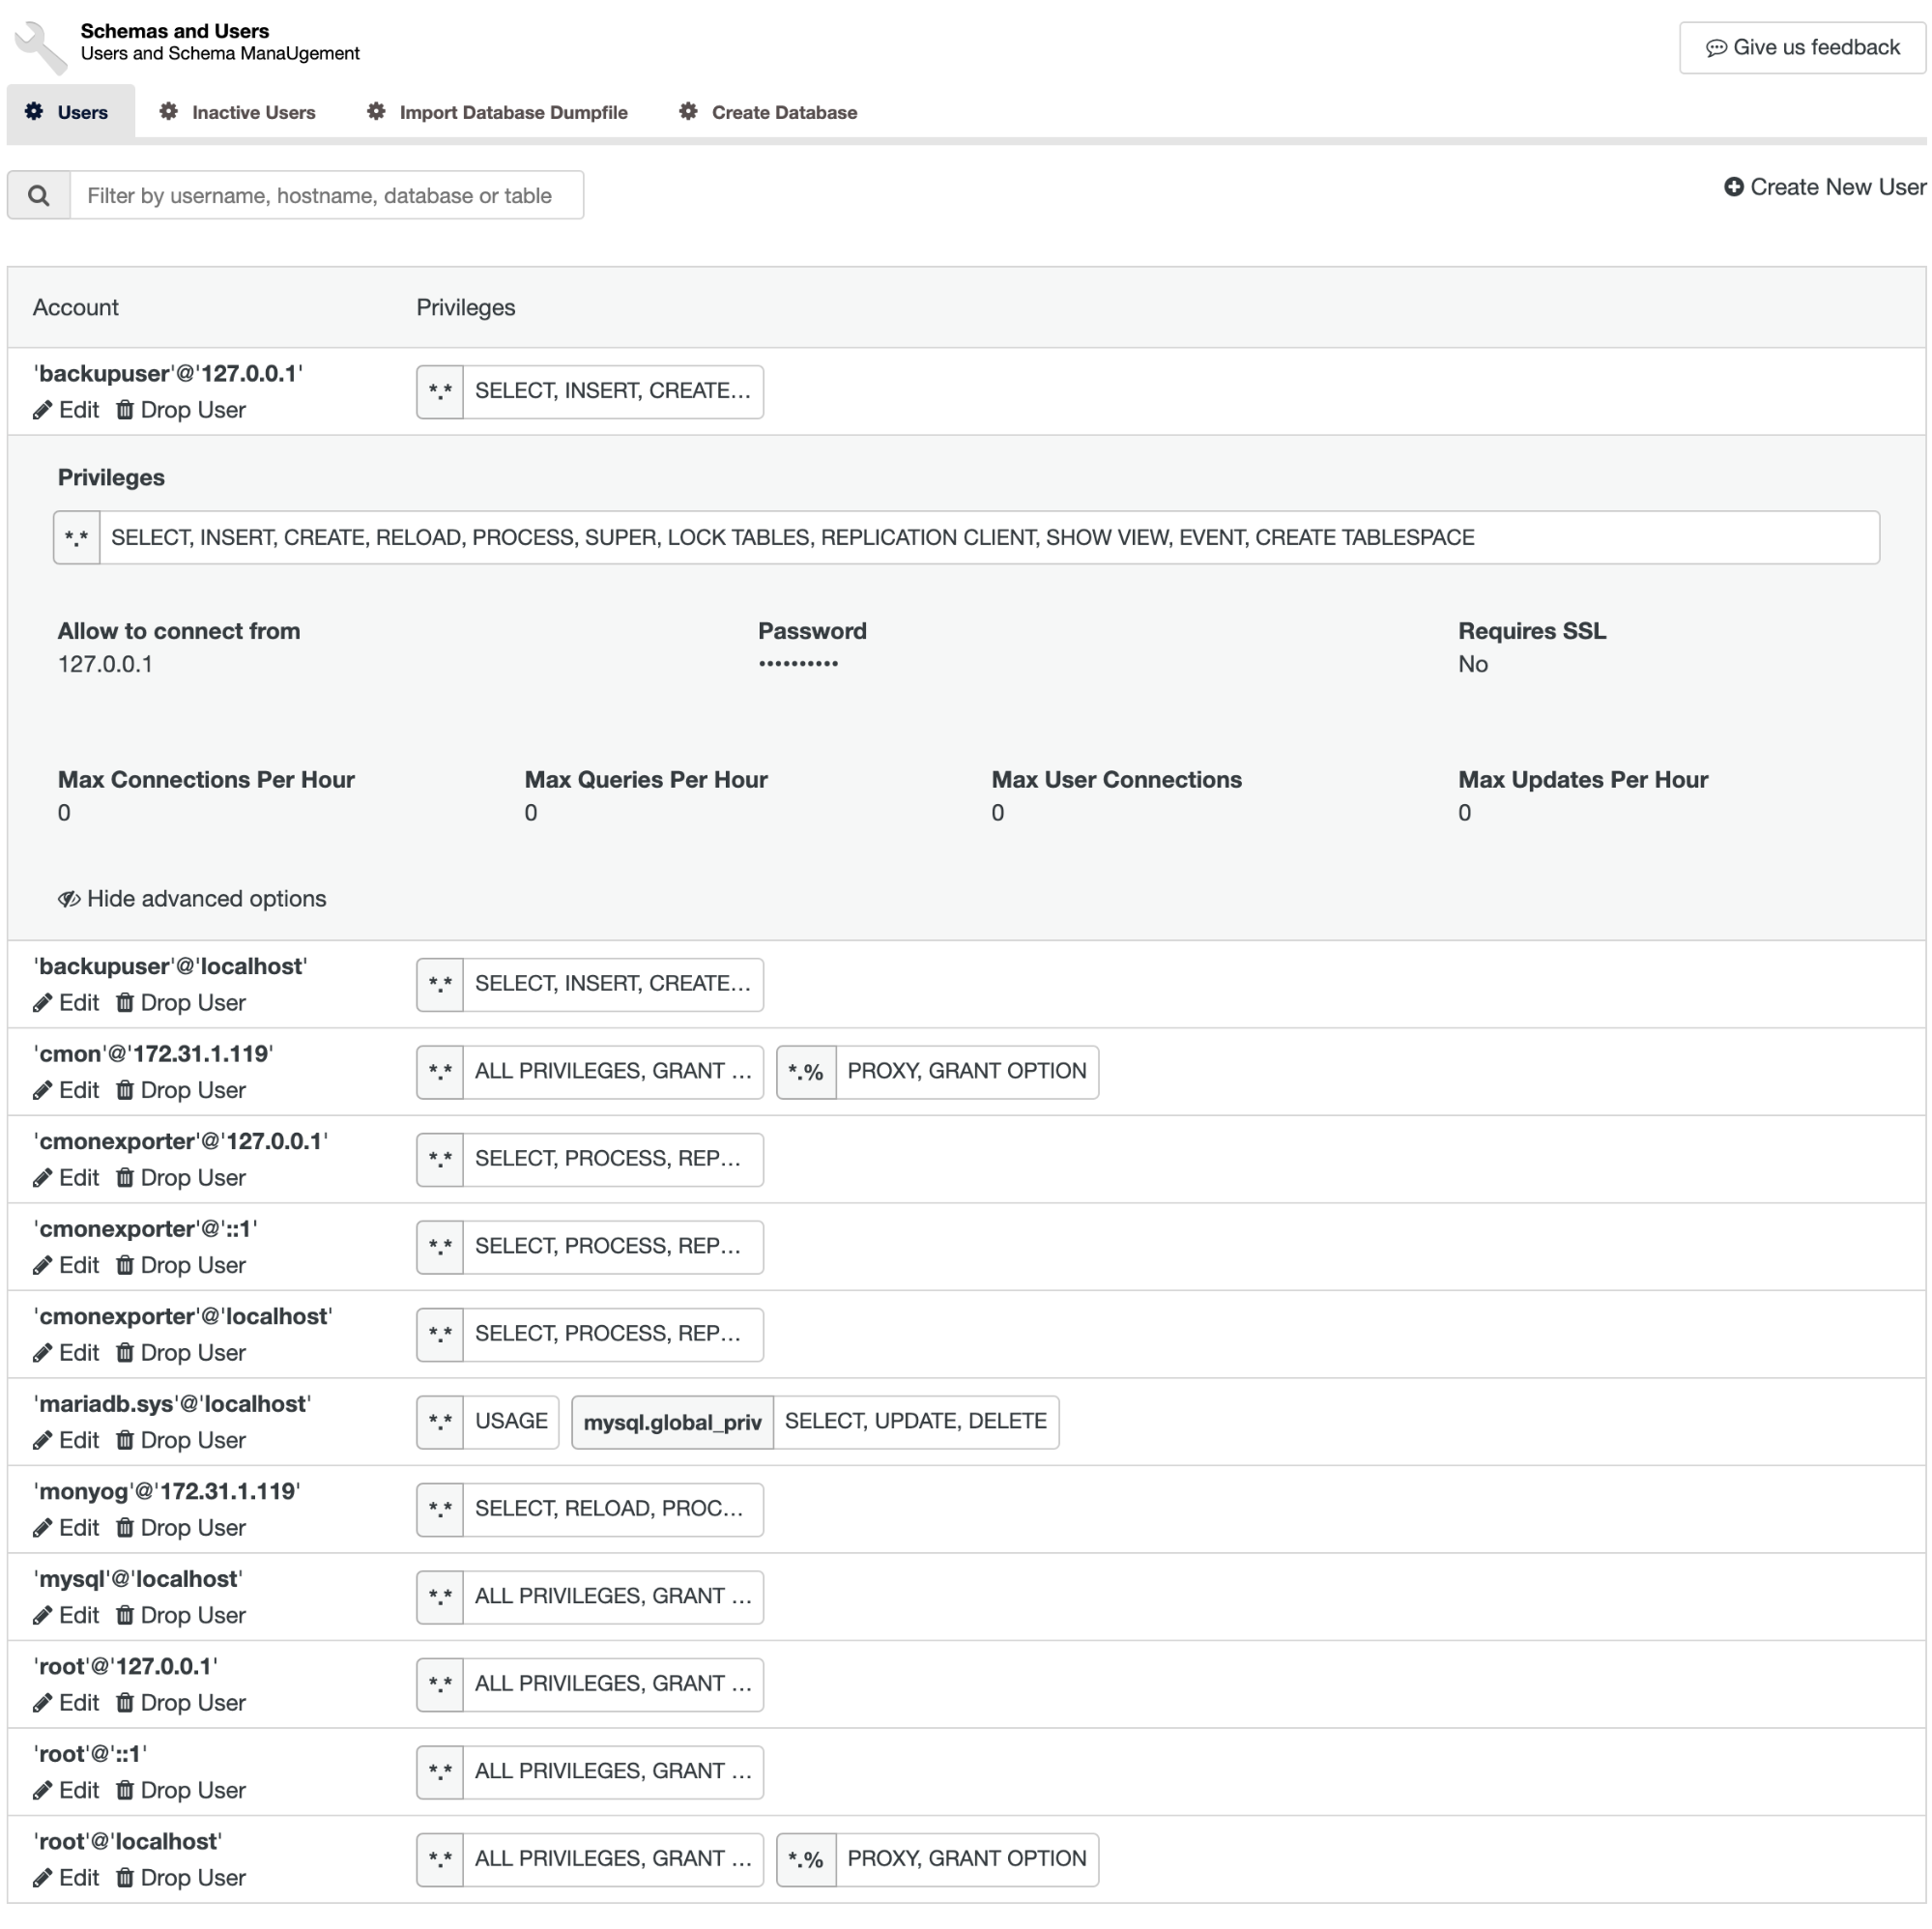
ClusterControl supports the privilege auditing for MySQL, MariaDB and PostgreSQL under the same user interface.
Schema Object Auditing
Schema objects are logical structures created by users. Examples of schema objects are tables, indexes, views, routines, events, procedures, functions, triggers, and others. It basically objects that hold data or can consist of a definition only. Commonly, one would audit the permissions associated with the schema objects to detect poor security settings and understand the relation and dependencies between objects.
For MySQL and MariaDB, there are information_schema and performance_schema that we can use to basically audit the schema objects. Performance_schema is a bit depth in the instrumentation as its name suggests. However, MySQL also includes a sys schema since version 5.7.7, which is a user-friendly version of performance_schema. All of these databases are directly accessible and queryable by the clients.
Database Audit Plugins/Extensions
The most recommended way to perform statement auditing is by using an audit plugin or extension, specifically built for the database technology in use. MariaDB and Percona have their own Audit plugin implementation, which a bit different from MySQL’s Audit plugin available in MySQL Enterprise. Audit records include information about the operation that was audited, the user performing the operation, and the date and time of the operation. The records can be stored in either a data dictionary table, called the database audit trail, or in operating system files, called an operating system audit trail.
For PostgreSQL, there is pgAudit, a PostgreSQL extension that provides detailed session and/or object audit logging via the standard PostgreSQL logging facility. It is basically an enhanced version of PostgreSQL’s log_statement feature with the ability to easily search and lookup the captured data for auditing by following the standard audit log.
MongoDB Enterprise (paid) and Percona Server for MongoDB (free) include an auditing capability for mongod and mongos instances. With auditing enabled, the server will generate audit messages which can be logged into syslog, console or file (JSON or BSON format). In most cases, it’s preferable to log to the file in BSON format, where the performance impact is smaller than JSON. This file contains information about different user events including authentication, authorization failures, and so on. Check out the Auditing documentation for details.
Operating System Audit Trails
It is also important to configure the operating system’s audit trails. For Linux, people would commonly use auditd. Auditd is the user-space component of the Linux Auditing System and responsible for writing audit records to the disk. Viewing the logs is done with the ausearch or aureport utilities. Configuring the audit rules is done with the auditctl utility, or by modifying the rule files directly.
The following installation steps are our common practice when setting up any kind of servers for production usage:
$ yum -y install audit # apt install auditd python
$ mv /etc/audit/rules.d/audit.rules /etc/audit/rules.d/audit.rules.ori
$ cd /etc/audit/rules.d/
$ wget https://gist.githubusercontent.com/ashraf-s9s/fb1b674e15a5a5b41504faf76a08b4ae/raw/2764bf0e9bf25418bb86e33c13fb80356999d220/audit.rules
$ chmod 640 audit.rules
$ systemctl daemon-reload
$ systemctl start auditd
$ systemctl enable auditd
$ service auditd restart
Note that the last line service auditd restart is compulsory because audit doesn’t work really well when loading rules with systemd. However, systemd is still required to monitor the auditd service. During startup, the rules in /etc/audit/audit.rules are read by auditctl. The audit daemon itself has some configuration options that the admin may wish to customize. They are found in the auditd.conf file.
The following line is an output taken from a configured audit log:
$ ausearch -m EXECVE | grep -i 'password' | head -1
type=EXECVE msg=audit(1615377099.934:11838148): argc=7 a0="mysql" a1="-NAB" a2="--user=appdb1" a3="--password=S3cr3tPassw0rdKP" a4="-h127.0.0.1" a5="-P3306" a6=2D6553484F5720474C4F42414C205641524941424C4553205748455245205641524941424C455F4E414D4520494E20282776657273696F6E272C202776657273696F6E5F636F6D6D656E74272C2027646174616469722729
As you can see from the above, it is easy to spot a cleartext password for MySQL (“–password=S3cr3tPassw0rdKP”) using ausearch utility as captured by the auditd. This kind of discovery and auditing is vital to secure our database infrastructure, where a cleartext password is unacceptable in a secure environment.
Final Thoughts
Audit log or trail is a vital aspect that commonly is overlooked by DevOps engineers when managing infrastructures and systems, let alone the database system which is a very critical system to store sensitive and confidential data. Any exposure or breaches of your private data can be extremely damaging for the business and no one would want that to happen in the current information technology era.