blog
Benchmarking Managed PostgreSQL Cloud Solutions – Part One: Amazon Aurora

This blog starts a multi-series documenting my journey on benchmarking PostgreSQL in the cloud.
The first part includes an overview of benchmarking tools, and kickstarts the fun with Amazon Aurora PostgreSQL.
Selecting the PostgreSQL Cloud Services Providers
A while ago I came across the AWS benchmark procedure for Aurora, and thought it would be really cool if I could take that test and run it on other cloud hosting providers. To Amazon’s credit, out of the three most known utility computing providers — AWS, Google, and Microsoft — AWS is the only major contributor to PostgreSQL development, and the first to offer managed PostgreSQL service (dating back in November 2013).
While managed PostgreSQL services are also available from a plethora of PostgreSQL Hosting Providers, I wanted to focus on the said three cloud computing providers since their environments are where many organizations looking for the advantages of cloud computing choose to run their applications, provided that they have the required know-how on managing PostgreSQL. I am a firm believer that in today’s IT landscape, organizations working with critical workloads in the cloud would greatly benefit from the services of a specialized PostgreSQL service provider, that can help them navigate the complex world of GUCS and myriads of SlideShare presentations.
Selecting the Right Benchmark Tool
Benchmarking PostgreSQL comes up quite often on performance mailing list, and as stressed countless of times the tests are not intended to validate a configuration for a real life application. However, selecting the right benchmark tool and parameters are important in order to gather meaningful results. I would expect every cloud provider to provide procedures for benchmarking their services, especially when the first cloud experience may not start on the right foot. The good news is that two of the three players in this test, have included benchmarks in their documentation. The AWS Benchmark Procedure for Aurora guide is easy to find, available right on the Amazon Aurora Resources page. Google doesn’t provide a guide specific to PostgreSQL, however, the Compute Engine documentation contains a load testing guide for SQL Server based on HammerDB.
Following is a summary of benchmark tools based on their references are worth being looked at:
- The AWS Benchmark mentioned above is based on pgbench and sysbench.
- HammerDB, also mentioned earlier, is discussed in a recent post on pgsql-hackers list.
- TPC-C tests based on oltpbench as alluded in this other pgsql-hackers discussion.
- benchmarksql is yet another TPC-C test that was used to validate the changes to B-Tree page splits.
- pg_ycsb is the new kid in town, improving on pgbench and already being used by some of the PostgreSQL hackers.
- pgbench-tools as the name suggests, is based on pgbench and while not having received any updates since 2016, it is the product of Greg Smith, the author of PostgreSQL High Performance books.
- join order benchmark is a benchmark that will test the query optimizer.
- pgreplay which I came across while reading the Command Prompt blog is as close as it can get to benchmarking a real life scenario.
Another point to note is that PostgreSQL isn’t yet well suited for the TPC-H benchmark standard, and as noted above all the tools (except pgreplay) must be run in TPC-C mode (pgbench defaults to it).
For the purpose of this blog, I thought that the AWS Benchmark Procedure for Aurora is a good starting simply because it sets a standard for cloud providers and is based on widely used tools.
Also, I used the latest available PostgreSQL version at the time. When selecting a cloud provider, it is important to consider the frequency of upgrades, especially when important features introduced by new versions can affect performance (which is the case for versions 10 and 11 versus 9). As of this writing we have:
- Amazon Aurora PostgreSQL 10.6
- Amazon RDS for PostgreSQL 10.6
- Google Cloud SQL for PostgreSQL 9.6
- Microsoft Azure PostgreSQL 10.5
…and the winner here is AWS by offering the most recent version (although it is not the latest, which as of this writing is 11.2).
Setting up the Benchmarking Environment
I decided to limit my tests to average workloads for a couple of reasons: First, the available cloud resources are not identical across providers. In the guide, the AWS specs for the database instance are 64 vCPU / 488 GiB RAM / 25 Gigabit Network, while Google’s maximum RAM for any instance size (the choice must be set to “custom” in the Google Calculator) is 208 GiB, and Microsoft’s Business Critical Gen5 at 32 vCPU comes with only 163 GiB). Second, the pgbench initialization brings the database size to 160GiB which in the case of an instance with 488 GiB of RAM is likely to be stored in memory.
Also, I left the PostgreSQL configuration untouched. The reason for sticking to cloud provider’s defaults being that, out of the box, when stressed by a standard benchmark, a managed service is expected to perform reasonably well. Remember that the PostgreSQL community runs pgbench tests as part of the release management process. Additionally, the AWS guide does not mention any changes to the default PostgreSQL configuration.
As explained in the guide, AWS applied two patches to pgbench. Since the patch for the number of clients didn’t apply cleanly on the 10.6 version of PostgreSQL and I didn’t want to invest time into fixing it, the number of clients was limited to the maximum of 1,000.
The guide specifies a requirement for the client instance to have enhanced networking enabled — for this instance type that is the default:
[ec2-user@ip-172-31-19-190 ~]$ ip a
1: lo:  mtu 65536 qdisc noqueue state UNKNOWN group default qlen 1000
    link/loopback 00:00:00:00:00:00 brd 00:00:00:00:00:00
    inet 127.0.0.1/8 scope host lo
       valid_lft forever preferred_lft forever
    inet6 ::1/128 scope host
       valid_lft forever preferred_lft forever
2: eth0:  mtu 9001 qdisc mq state UP group default qlen 1000
    link/ether 0a:cd:ee:40:2b:e6 brd ff:ff:ff:ff:ff:ff
    inet 172.31.19.190/20 brd 172.31.31.255 scope global eth0
       valid_lft forever preferred_lft forever
    inet6 fe80::8cd:eeff:fe40:2be6/64 scope link
       valid_lft forever preferred_lft forever
[ec2-user@ip-172-31-19-190 ~]$ ethtool -i eth0
driver: ena
version: 2.0.2g
firmware-version:
bus-info: 0000:00:03.0
supports-statistics: yes
supports-test: no
supports-eeprom-access: no
supports-register-dump: no
supports-priv-flags: no
>>> aws (master *%) ~ $ aws ec2 describe-instances --instance-ids i-0ee51642334c1ec57 --query "Reservations[].Instances[].EnaSupport"
[
    true
]
Running the Benchmark on Amazon Aurora PostgreSQL
During the actual run I decided to make one more deviation from the guide: instead of running the test for 1 hour set the time limit to 10 minutes, which is generally accepted as a good value.
Run #1
Specifics
- This test uses the AWS specifications for both client and database instance sizes.
- Client machine: On Demand Memory Optimized EC2 instance:
- vCPU: 32 (16 Cores x 2 Threads/Core)
- RAM: 244 GiB
- Storage: EBS Optimized
- Network: 10 Gigabit
- DB Cluster: db.r4.16xlarge
- vCPU: 64
- ECU (CPU capacity): 195 x [1.0-1.2 GHz] 2007 Opteron / Xeon
- RAM: 488 GiB
- Storage: EBS Optimized (Dedicated capacity for I/O)
- Network: 14,000 Mbps Max Bandwidth on a 25 Gps network
- Client machine: On Demand Memory Optimized EC2 instance:
- The database setup included one replica.
- Database storage was not encrypted.
Performing the Tests and Results
- Follow the instructions in the guide to install pgbench and sysbench.
- Edit ~/.bashrc to set the environment variables for the database connection and required paths to PostgreSQL libraries:
export PGHOST=aurora.cluster-ctfirtyhadgr.us-east-1.rds.amazonaws.com export PGUSER=postgres export PGPASSWORD=postgres export PGDATABASE=postgres export PATH=$PATH:/usr/local/pgsql/bin export LD_LIBRARY_PATH=$LD_LIBRARY_PATH:/usr/local/pgsql/lib - Initialize the database:
[root@ip-172-31-19-190 ~]# pgbench -i --fillfactor=90 --scale=10000 NOTICE: table "pgbench_history" does not exist, skipping NOTICE: table "pgbench_tellers" does not exist, skipping NOTICE: table "pgbench_accounts" does not exist, skipping NOTICE: table "pgbench_branches" does not exist, skipping creating tables... 100000 of 1000000000 tuples (0%) done (elapsed 0.05 s, remaining 457.23 s) 200000 of 1000000000 tuples (0%) done (elapsed 0.13 s, remaining 631.70 s) 300000 of 1000000000 tuples (0%) done (elapsed 0.21 s, remaining 688.29 s) ... 999500000 of 1000000000 tuples (99%) done (elapsed 811.41 s, remaining 0.41 s) 999600000 of 1000000000 tuples (99%) done (elapsed 811.50 s, remaining 0.32 s) 999700000 of 1000000000 tuples (99%) done (elapsed 811.58 s, remaining 0.24 s) 999800000 of 1000000000 tuples (99%) done (elapsed 811.65 s, remaining 0.16 s) 999900000 of 1000000000 tuples (99%) done (elapsed 811.73 s, remaining 0.08 s) 1000000000 of 1000000000 tuples (100%) done (elapsed 811.80 s, remaining 0.00 s) vacuum... set primary keys... done. - Verify the database size:
postgres=> l+ postgres List of databases Name | Owner | Encoding | Collate | Ctype | Access privileges | Size | Tablespace | Description ----------+----------+----------+-------------+-------------+-------------------+--------+------------+-------------------------------------------- postgres | postgres | UTF8 | en_US.UTF-8 | en_US.UTF-8 | | 160 GB | pg_default | default administrative connection database (1 row) - Use the following query to verify that the time interval between checkpoints is set so checkpoints will be forced during the 10 min run:
SELECT
   total_checkpoints,
   seconds_since_start / total_checkpoints / 60 AS minutes_between_checkpoints FROM (
      SELECT EXTRACT(
      EPOCH FROM (
         now() - pg_postmaster_start_time()
      )
      ) AS seconds_since_start,
   (checkpoints_timed+checkpoints_req) AS total_checkpoints
FROM pg_stat_bgwriter) AS sub;
Result:
postgres=> e total_checkpoints | minutes_between_checkpoints -------------------+----------------------------- 50 | 0.977392292333333 (1 row) - Run the Read/Write workload:
[root@ip-172-31-19-190 ~]# pgbench --protocol=prepared -P 60 --time=600 --client=1000 --jobs=2048Output
starting vacuum...end. progress: 60.0 s, 35670.3 tps, lat 27.243 ms stddev 10.915 progress: 120.0 s, 36569.5 tps, lat 27.352 ms stddev 11.859 progress: 180.0 s, 35845.2 tps, lat 27.896 ms stddev 12.785 progress: 240.0 s, 36613.7 tps, lat 27.310 ms stddev 11.804 progress: 300.0 s, 37323.4 tps, lat 26.793 ms stddev 11.376 progress: 360.0 s, 36828.8 tps, lat 27.155 ms stddev 11.318 progress: 420.0 s, 36670.7 tps, lat 27.268 ms stddev 12.083 progress: 480.0 s, 37176.1 tps, lat 26.899 ms stddev 10.981 progress: 540.0 s, 37210.8 tps, lat 26.875 ms stddev 11.341 progress: 600.0 s, 37415.4 tps, lat 26.727 ms stddev 11.521 transaction type: - Prepare the sysbench test:
sysbench --test=/usr/local/share/sysbench/oltp.lua
    --pgsql-host=aurora.cluster-ctfirtyhadgr.us-east-1.rds.amazonaws.com
    --pgsql-db=postgres
    --pgsql-user=postgres
    --pgsql-password=postgres
    --pgsql-port=5432
    --oltp-tables-count=250
    --oltp-table-size=450000
    prepare
Output:
sysbench 0.5: multi-threaded system evaluation benchmark Creating table 'sbtest1'... Inserting 450000 records into 'sbtest1' Creating secondary indexes on 'sbtest1'... Creating table 'sbtest2'... ... Creating table 'sbtest250'... Inserting 450000 records into 'sbtest250' Creating secondary indexes on 'sbtest250'... - Run the sysbench test:
sysbench --test=/usr/local/share/sysbench/oltp.lua
    --pgsql-host=aurora.cluster-ctfirtyhadgr.us-east-1.rds.amazonaws.com
    --pgsql-db=postgres
    --pgsql-user=postgres
    --pgsql-password=postgres
    --pgsql-port=5432
    --oltp-tables-count=250
    --oltp-table-size=450000
    --max-requests=0
    --forced-shutdown
    --report-interval=60
    --oltp_simple_ranges=0
    --oltp-distinct-ranges=0
    --oltp-sum-ranges=0
    --oltp-order-ranges=0
    --oltp-point-selects=0
    --rand-type=uniform
    --max-time=600
    --num-threads=1000
    run
Output:
sysbench 0.5:  multi-threaded system evaluation benchmark

Running the test with following options:
Number of threads: 1000
Report intermediate results every 60 second(s)
Random number generator seed is 0 and will be ignored

Forcing shutdown in 630 seconds

Initializing worker threads...

Threads started!

[  60s] threads: 1000, tps: 20443.09, reads: 0.00, writes: 81834.16, response time: 68.24ms (95%), errors: 0.62, reconnects:  0.00
[ 120s] threads: 1000, tps: 20580.68, reads: 0.00, writes: 82324.33, response time: 70.75ms (95%), errors: 0.73, reconnects:  0.00
[ 180s] threads: 1000, tps: 20531.85, reads: 0.00, writes: 82127.21, response time: 70.63ms (95%), errors: 0.73, reconnects:  0.00
[ 240s] threads: 1000, tps: 20212.67, reads: 0.00, writes: 80861.67, response time: 71.99ms (95%), errors: 0.43, reconnects:  0.00
[ 300s] threads: 1000, tps: 19383.90, reads: 0.00, writes: 77537.87, response time: 75.64ms (95%), errors: 0.75, reconnects:  0.00
[ 360s] threads: 1000, tps: 19797.20, reads: 0.00, writes: 79190.78, response time: 75.27ms (95%), errors: 0.68, reconnects:  0.00
[ 420s] threads: 1000, tps: 20304.43, reads: 0.00, writes: 81212.87, response time: 73.82ms (95%), errors: 0.70, reconnects:  0.00
[ 480s] threads: 1000, tps: 20933.80, reads: 0.00, writes: 83737.16, response time: 74.71ms (95%), errors: 0.68, reconnects:  0.00
[ 540s] threads: 1000, tps: 20663.05, reads: 0.00, writes: 82626.42, response time: 73.56ms (95%), errors: 0.75, reconnects:  0.00
[ 600s] threads: 1000, tps: 20746.02, reads: 0.00, writes: 83015.81, response time: 73.58ms (95%), errors: 0.78, reconnects:  0.00
OLTP test statistics:
   queries performed:
      read:                            0
      write:                           48868458
      other:                           24434022
      total:                           73302480
   transactions:                        12216804 (20359.59 per sec.)
   read/write requests:                 48868458 (81440.43 per sec.)
   other operations:                    24434022 (40719.87 per sec.)
   ignored errors:                      414    (0.69 per sec.)
   reconnects:                          0      (0.00 per sec.)

General statistics:
   total time:                          600.0516s
   total number of events:              12216804
   total time taken by event execution: 599964.4735s
   response time:
         min:                                  6.27ms
         avg:                                 49.11ms
         max:                                350.24ms
         approx.  95 percentile:              72.90ms

Threads fairness:
   events (avg/stddev):           12216.8040/31.27
   execution time (avg/stddev):   599.9645/0.01
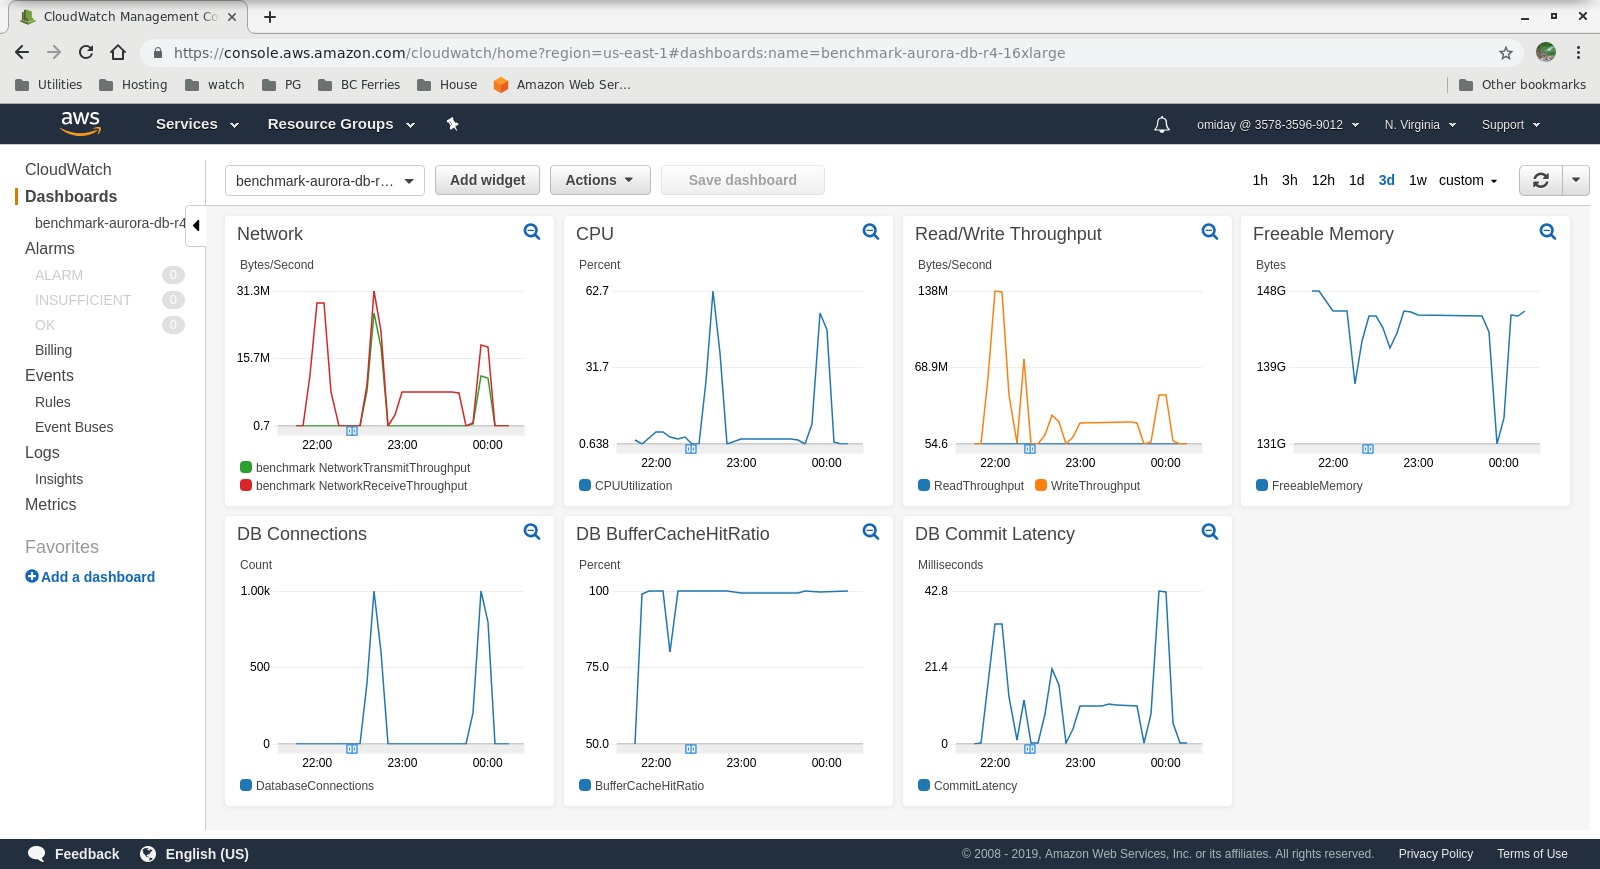
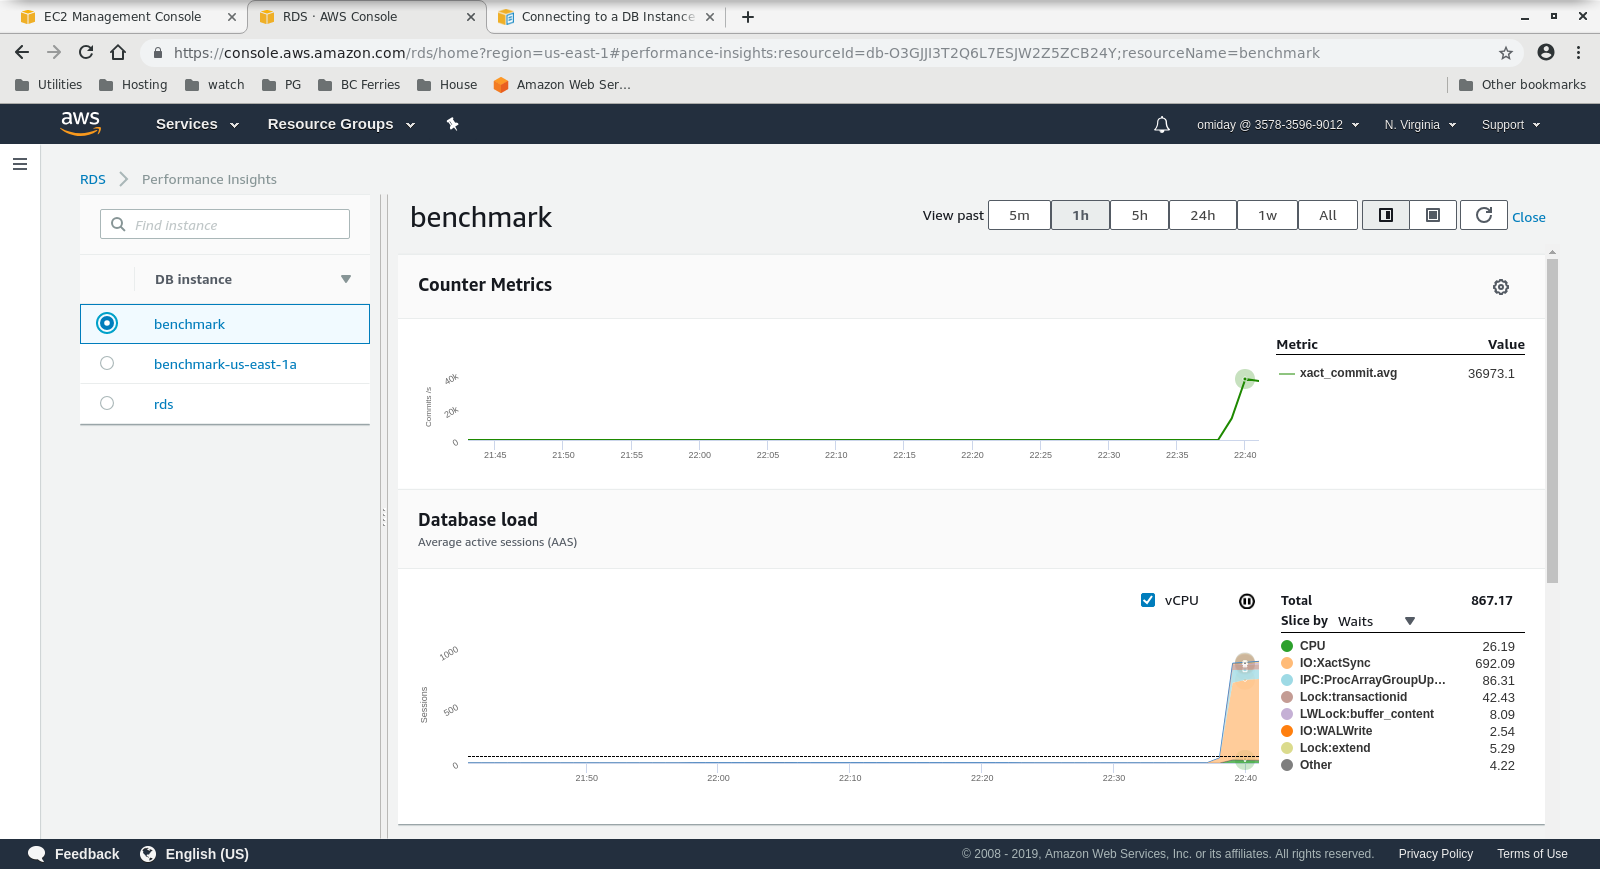
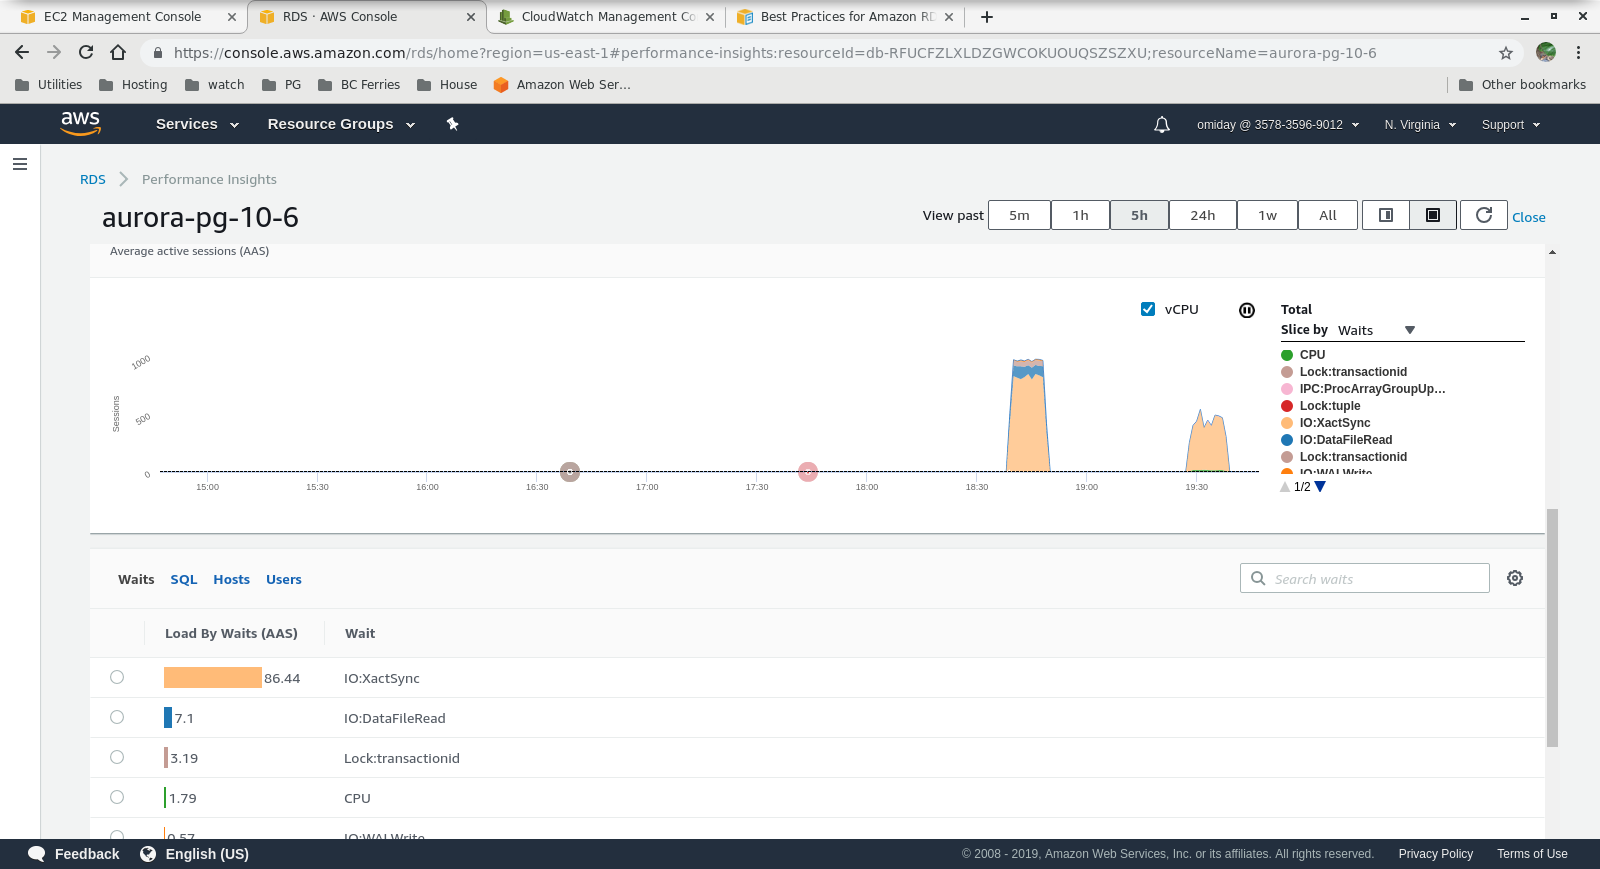
Metrics Collected
Run #2
Specifics
- This test uses the AWS specifications for the client and a smaller instance size for the database:
- Client machine: On Demand Memory Optimized EC2 instance:
- vCPU: 32 (16 Cores x 2 Threads/Core)
- RAM: 244 GiB
- Storage: EBS Optimized
- Network: 10 Gigabit
- DB Cluster: db.r4.2xlarge:
- vCPU: 8
- RAM: 61GiB
- Storage: EBS Optimized
- Network: 1,750 Mbps Max Bandwidth on an up to 10 Gbps connection
- Client machine: On Demand Memory Optimized EC2 instance:
- The database did not include a replica.
- Database storage was not encrypted.
Performing the Tests and Results
The steps are identical to Run #1 so I’m showing only the output:
-
pgbench Read/Write workload:
...

745700000 of 1000000000 tuples (74%) done (elapsed 794.93 s, remaining 271.09 s)
745800000 of 1000000000 tuples (74%) done (elapsed 795.00 s, remaining 270.97 s)
745900000 of 1000000000 tuples (74%) done (elapsed 795.09 s, remaining 270.86 s)
746000000 of 1000000000 tuples (74%) done (elapsed 795.17 s, remaining 270.74 s)
746100000 of 1000000000 tuples (74%) done (elapsed 795.24 s, remaining 270.62 s)
746200000 of 1000000000 tuples (74%) done (elapsed 795.33 s, remaining 270.51 s)

...

999800000 of 1000000000 tuples (99%) done (elapsed 1067.11 s, remaining 0.21 s)
999900000 of 1000000000 tuples (99%) done (elapsed 1067.19 s, remaining 0.11 s)
1000000000 of 1000000000 tuples (100%) done (elapsed 1067.28 s, remaining 0.00 s)
vacuum...
set primary keys...
total time: 4386.44 s (insert 1067.33 s, commit 0.46 s, vacuum 2088.25 s, index 1230.41 s)
done.
starting vacuum...end. progress: 60.0 s, 3361.3 tps, lat 286.143 ms stddev 80.417 progress: 120.0 s, 3466.8 tps, lat 288.386 ms stddev 76.373 progress: 180.0 s, 3683.1 tps, lat 271.840 ms stddev 75.712 progress: 240.0 s, 3444.3 tps, lat 289.909 ms stddev 69.564 progress: 300.0 s, 3475.8 tps, lat 287.736 ms stddev 73.712 progress: 360.0 s, 3449.5 tps, lat 289.832 ms stddev 71.878 progress: 420.0 s, 3518.1 tps, lat 284.432 ms stddev 74.276 progress: 480.0 s, 3430.7 tps, lat 291.359 ms stddev 73.264 progress: 540.0 s, 3515.7 tps, lat 284.522 ms stddev 73.206 progress: 600.0 s, 3482.9 tps, lat 287.037 ms stddev 71.649 transaction type: -
sysbench test:
sysbench 0.5:  multi-threaded system evaluation benchmark

Running the test with following options:
Number of threads: 1000
Report intermediate results every 60 second(s)
Random number generator seed is 0 and will be ignored

Forcing shutdown in 630 seconds

Initializing worker threads...

Threads started!

[  60s] threads: 1000, tps: 4809.05, reads: 0.00, writes: 19301.02, response time: 288.03ms (95%), errors: 0.05, reconnects:  0.00
[ 120s] threads: 1000, tps: 5264.15, reads: 0.00, writes: 21005.40, response time: 255.23ms (95%), errors: 0.08, reconnects:  0.00
[ 180s] threads: 1000, tps: 5178.27, reads: 0.00, writes: 20713.07, response time: 260.40ms (95%), errors: 0.03, reconnects:  0.00
[ 240s] threads: 1000, tps: 5145.95, reads: 0.00, writes: 20610.08, response time: 255.76ms (95%), errors: 0.05, reconnects:  0.00
[ 300s] threads: 1000, tps: 5127.92, reads: 0.00, writes: 20507.98, response time: 264.24ms (95%), errors: 0.05, reconnects:  0.00
[ 360s] threads: 1000, tps: 5063.83, reads: 0.00, writes: 20278.10, response time: 268.55ms (95%), errors: 0.05, reconnects:  0.00
[ 420s] threads: 1000, tps: 5057.51, reads: 0.00, writes: 20237.28, response time: 269.19ms (95%), errors: 0.10, reconnects:  0.00
[ 480s] threads: 1000, tps: 5036.32, reads: 0.00, writes: 20139.29, response time: 279.62ms (95%), errors: 0.10, reconnects:  0.00
[ 540s] threads: 1000, tps: 5115.25, reads: 0.00, writes: 20459.05, response time: 264.64ms (95%), errors: 0.08, reconnects:  0.00
[ 600s] threads: 1000, tps: 5124.89, reads: 0.00, writes: 20510.07, response time: 265.43ms (95%), errors: 0.10, reconnects:  0.00
OLTP test statistics:
    queries performed:
        read:                            0
        write:                           12225686
        other:                           6112822
        total:                           18338508
    transactions:                        3056390 (5093.75 per sec.)
    read/write requests:                 12225686 (20375.20 per sec.)
    other operations:                    6112822 (10187.57 per sec.)
    ignored errors:                      42     (0.07 per sec.)
    reconnects:                          0      (0.00 per sec.)

General statistics:
    total time:                          600.0277s
    total number of events:              3056390
    total time taken by event execution: 600005.2104s
    response time:
         min:                                  9.57ms
         avg:                                196.31ms
         max:                                608.70ms
         approx.  95 percentile:             268.71ms

Threads fairness:
    events (avg/stddev):           3056.3900/67.44
    execution time (avg/stddev):   600.0052/0.01
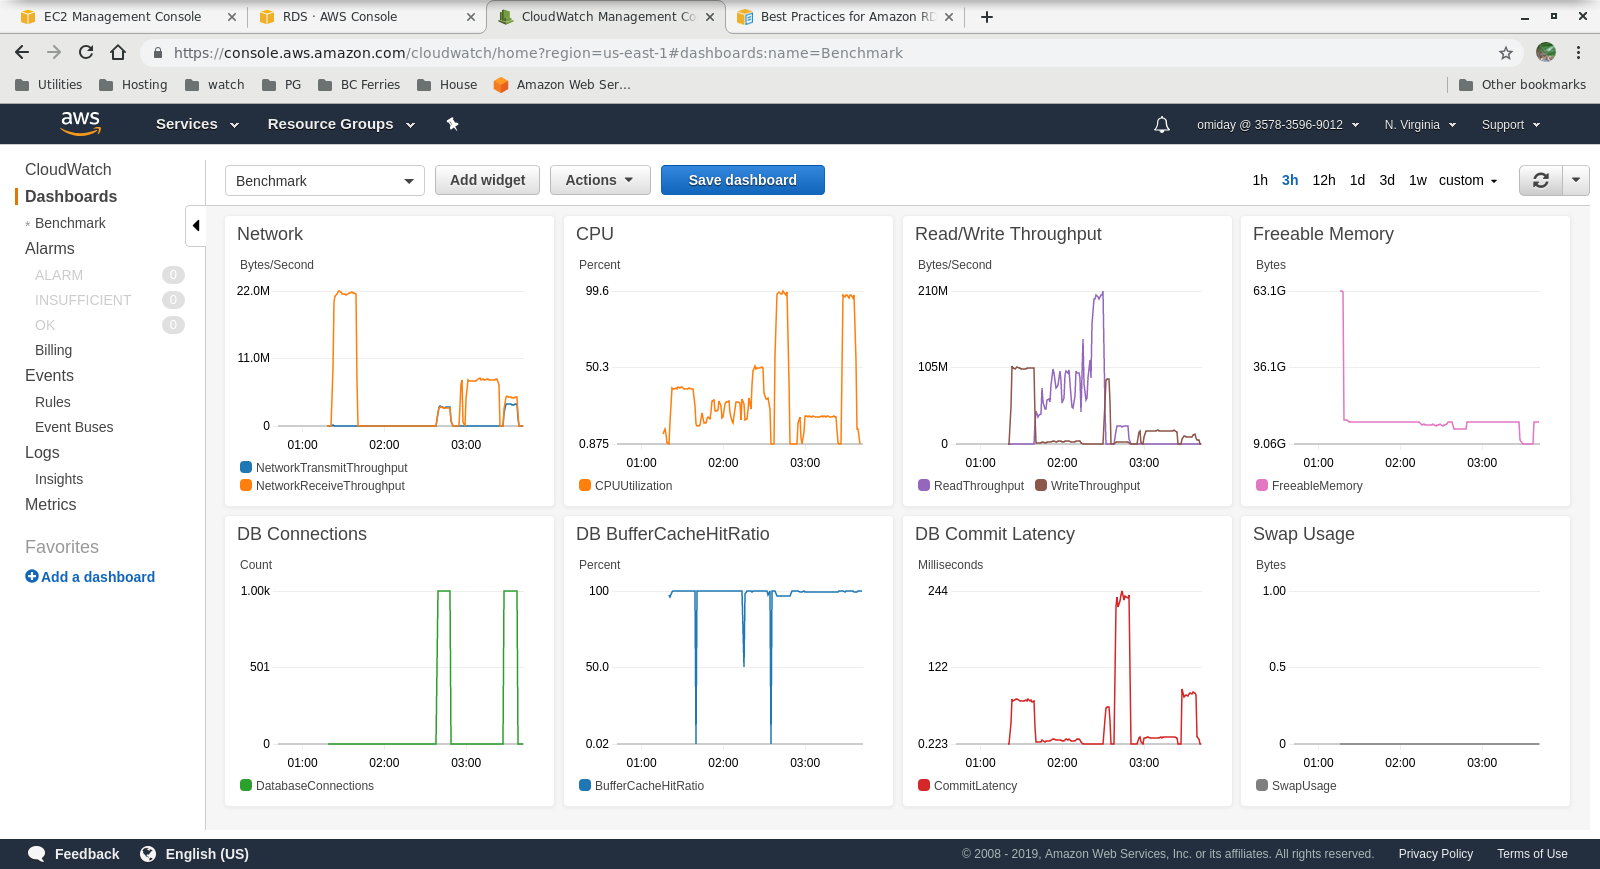
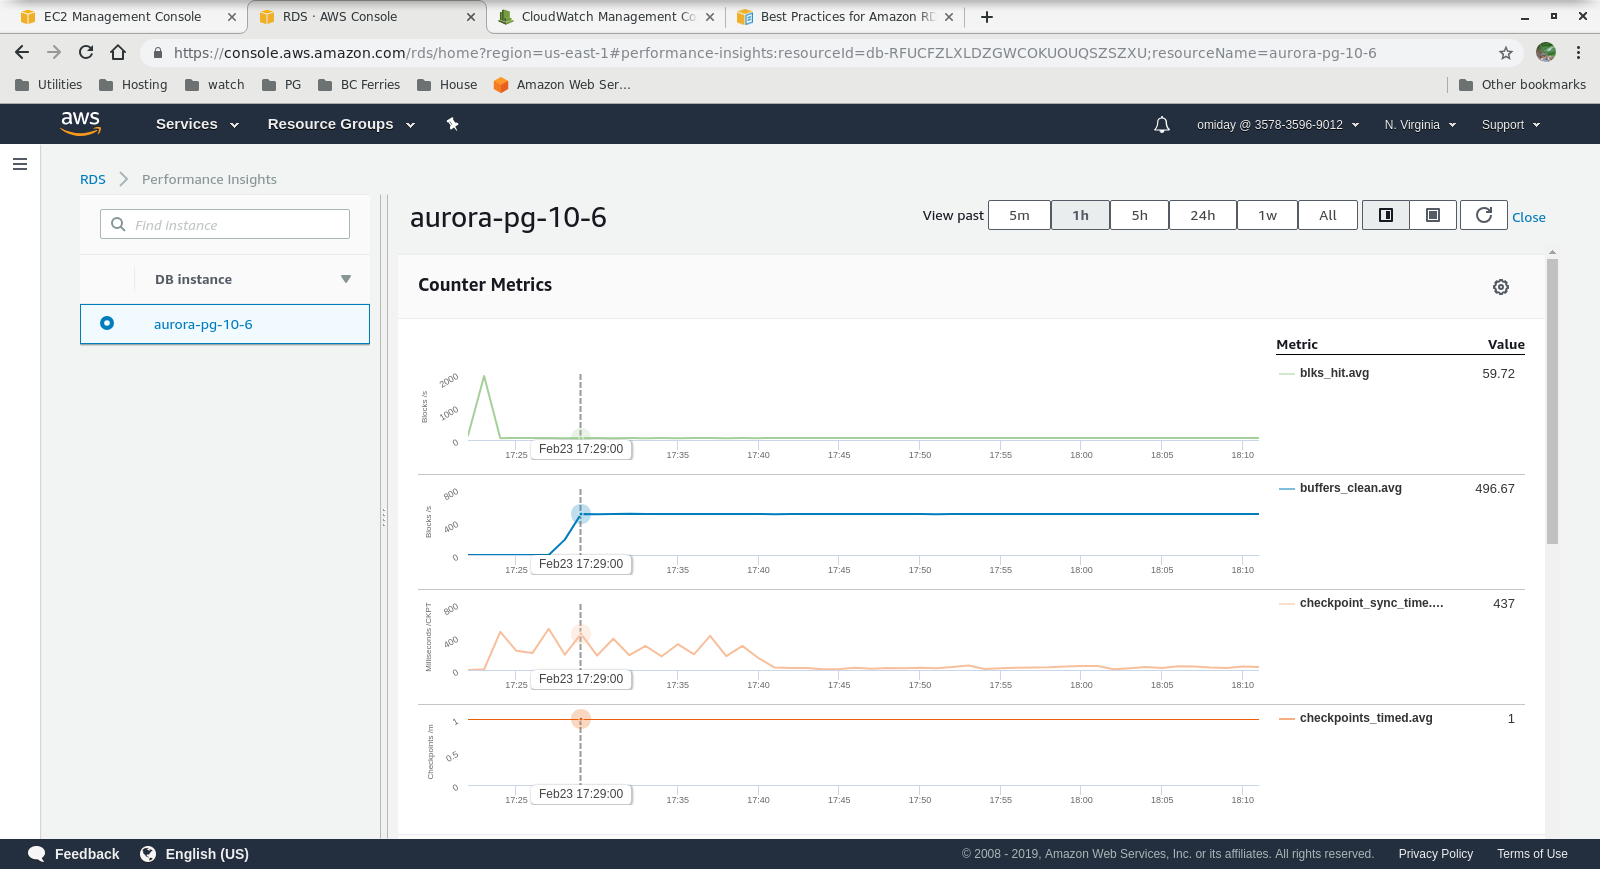
Metrics Collected
Final Thoughts
- Users are limited to using predefined instance sizes. As a downside, if the benchmark shows that the instance can benefit from additional memory it is not possible to “just add more RAM”. Adding more memory translates to increasing the instance size which comes with a higher cost (cost doubles for every instance size).
- Amazon Aurora storage engine is much different from RDS, and is built on top of SAN hardware. The I/O throughput metrics per instance show that the test did not get even closer to the maximum for the provisioned IOPS SSD EBS volumes of 1,750 MiB/s.
- Further tuning can be performed by reviewing the AWS PostgreSQL Events included in the Performance Insights graphs.
Next in Series
Stay tuned for the next part: Amazon RDS for PostgreSQL 10.6.