blog
Performance Monitoring for TimescaleDB
ClusterControl is an easy-to-use tool for monitoring performance of TimescaleDB in real-time. It provides dozens of predefined charts for displaying a wide variety of performance statistics regarding users, throughput, tablespaces, redo logs, buffers, caches and I/O, for example. It also provides real time information on database workload. My colleague Sebastian previously wrote about how to easily deploy TimescaleDB. In this blog, we will show you how to monitor different aspects of TimescaleDB performance with ClusterControl. First of all, allow me to provide a bit of introduction about TimescaleDB.
TimescaleDB is implemented as an extension on PostgreSQL, which means that a Timescale database runs within a PostgreSQL instance. The extension model allows the database to take advantage of many of the attributes of PostgreSQL such as reliability, security, and connectivity to a wide range of third-party tools. At the same time, TimescaleDB leverages the high degree of customization available to extensions by adding hooks deep into PostgreSQL’s query planner, data model, and execution engine. It’s ecosystem speaks the native language that PostgreSQL does, and adds specialized functions (and query optimizations) for working with time-series data. One of the advantages that TimescaleDB offers over other specialized datastores for storing IoT or time-series data is that, you can use SQL syntax which means you can take advantage of JOINs. So querying a diverse metadata is easier for developers – it simplifies their stack and eliminates data silos.
TimescaleDB has been tested and benchmarked with hundreds of billions of rows, and it scales very well – especially with upserts or inserts in comparison to vanilla PostgreSQL. If you’re interested with their benchmarking tools, you might consider taking a look at their Time Series Benchmark Suite (TSBS).
Using TimescaleDB is pretty easy if you’re familiar with an RDBMS such as MySQL or PostgreSQL. You must specify your database and create an extension for the TimescaleDB. Once created, you then create a Hypertable, which virtually handles all user interactions with TimescaleDB. See an example below:
nyc_data=# CREATE EXTENSION IF NOT EXISTS timescaledb CASCADE;
WARNING:
WELCOME TO
 _____ _                               _     ____________
|_   _(_)                             | |    |  _   ___
  | |  _ _ __ ___   ___  ___  ___ __ _| | ___| | | | |_/ /
  | | | |  _ ` _  / _ / __|/ __/ _` | |/ _  | | | ___
  | | | | | | | | |  __/__  (_| (_| | |  __/ |/ /| |_/ /
  |_| |_|_| |_| |_|___||___/_____,_|_|___|___/ ____/
               Running version 1.2.2
For more information on TimescaleDB, please visit the following links:

 1. Getting started: https://docs.timescale.com/getting-started
 2. API reference documentation: https://docs.timescale.com/api
 3. How TimescaleDB is designed: https://docs.timescale.com/introduction/architecture

Note: TimescaleDB collects anonymous reports to better understand and assist our users.
For more information and how to disable, please see our docs https://docs.timescaledb.com/using-timescaledb/telemetry.

CREATE EXTENSION
nyc_data=# SELECT create_hypertable('rides_count', 'one_hour');
    create_hypertable
--------------------------
 (1,public,rides_count,t)
(1 row)
Simple as that. However, once data goes big, a follow-up question you might have would be “How you can monitor the performance of TimescaleDB”? Well, this is what our blog is all about. Let’s see how you can do this with ClusterControl.
Monitoring TimescaleDB Clusters
Monitoring a TimescaleDB cluster in ClusterControl is almost the same as monitoring a PostgreSQL database cluster. We have the Cluster- and Node-level graphs, Dashboards, Topologies, Query Monitoring, and Performance. Let’s go over each of these.
The “Overview” Tab
The Overview Graphs can be located by going to Cluster → Overview tab.
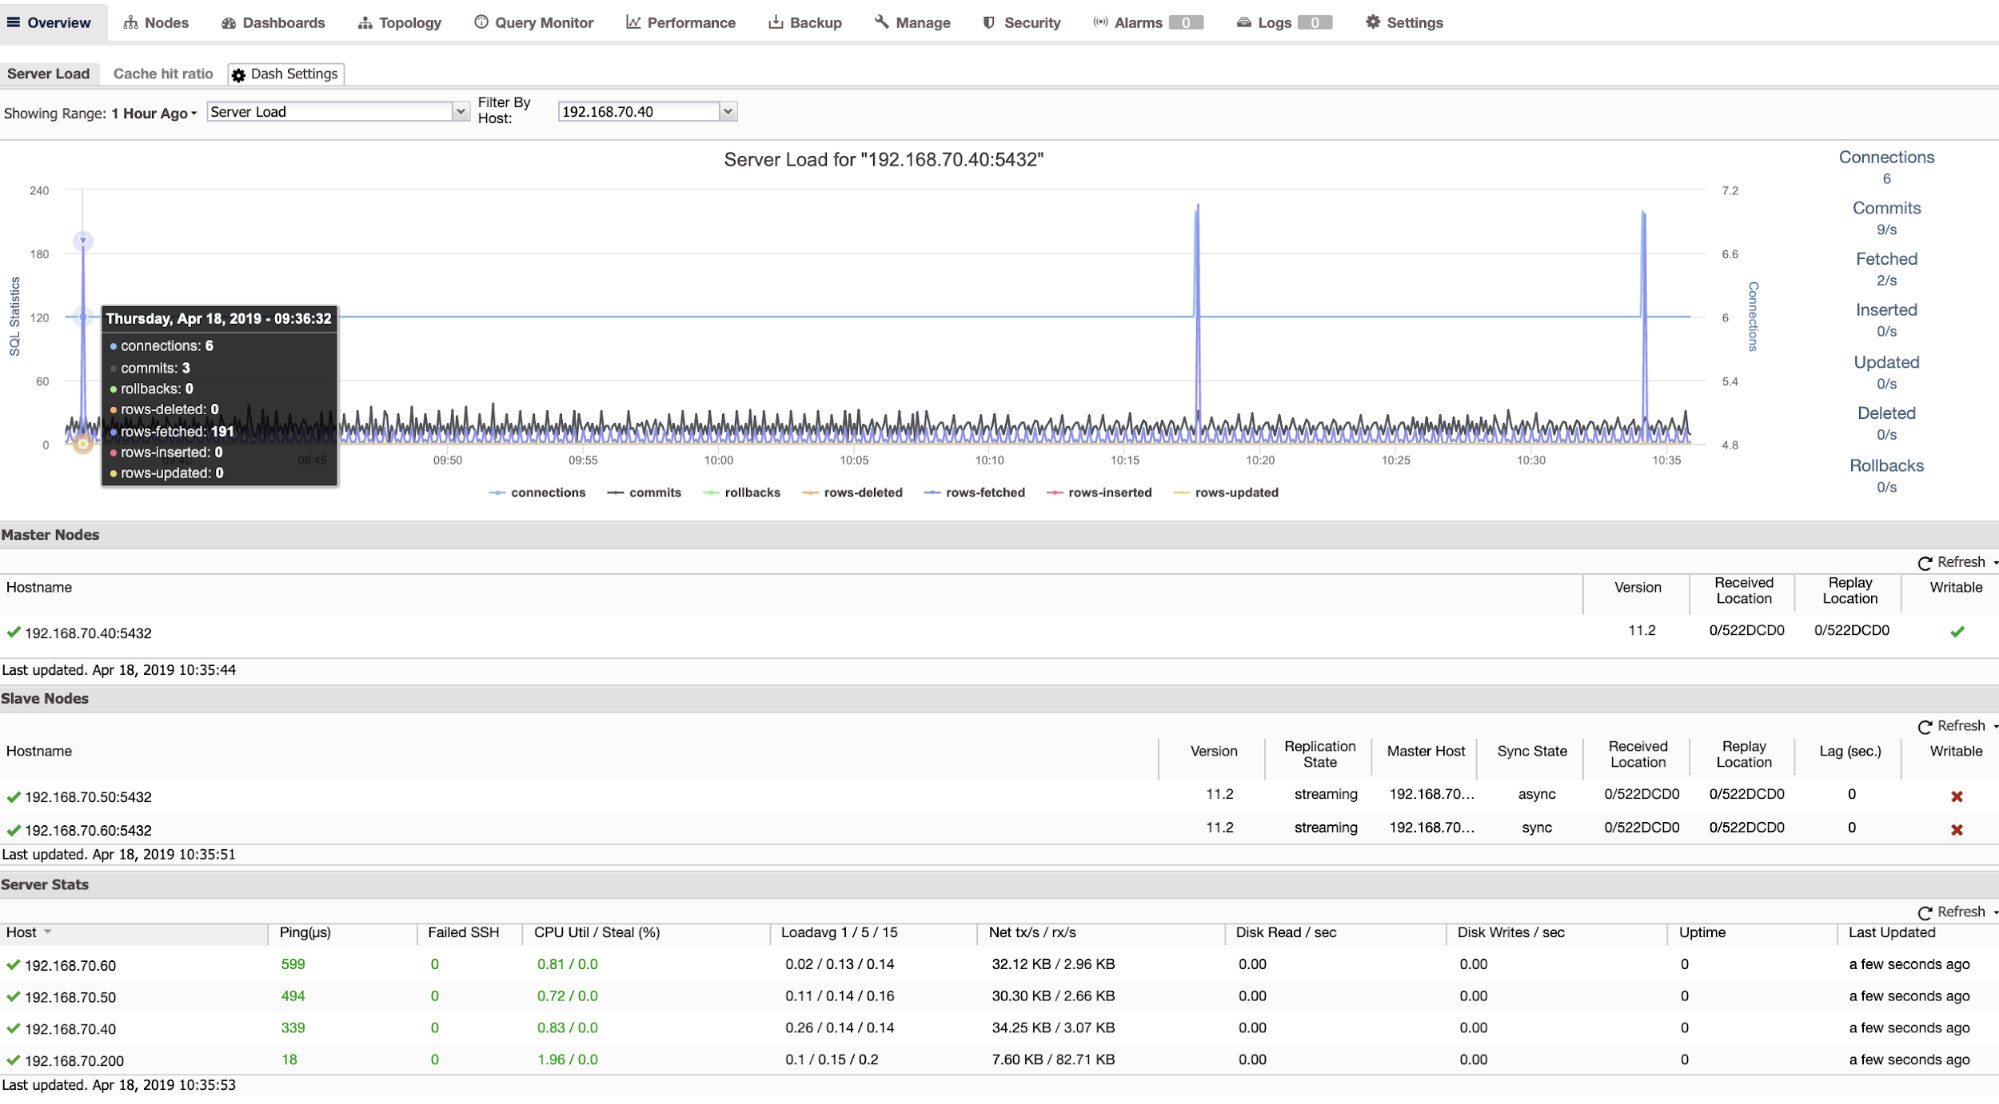
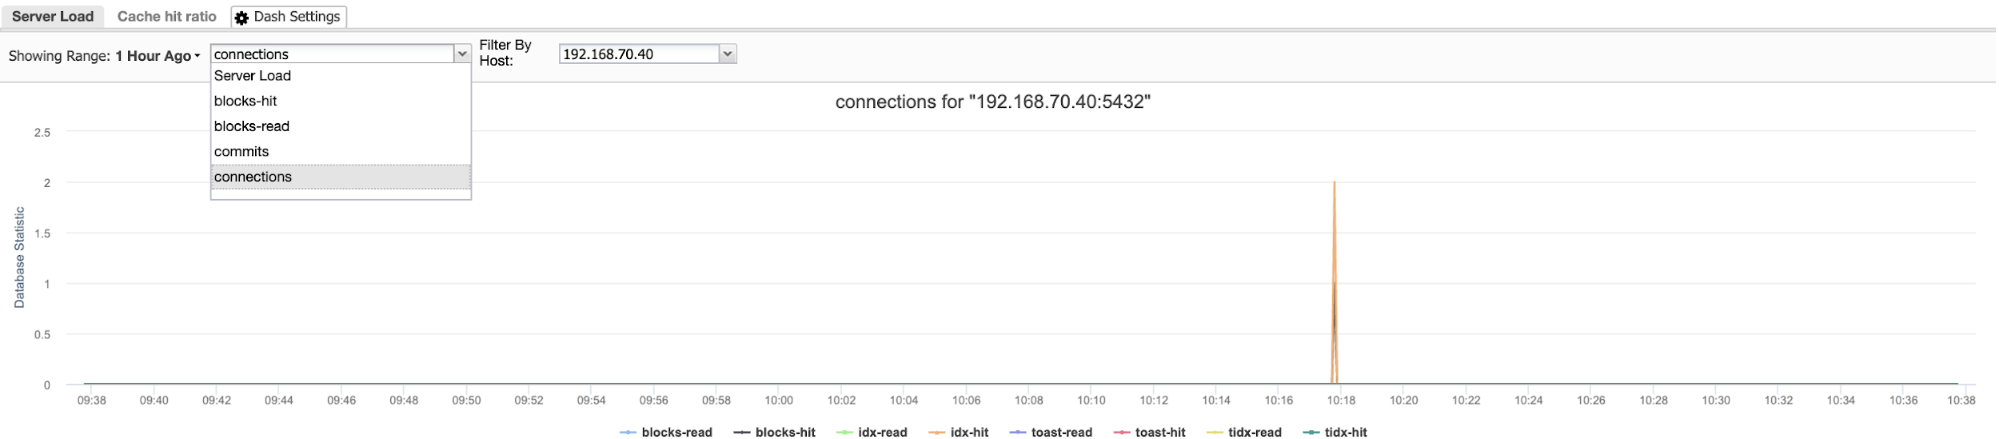
On this view, you can view server load, cache hit ratio or filter on other metrics – blocks-hit, blocks-read, commits, or number of connections.
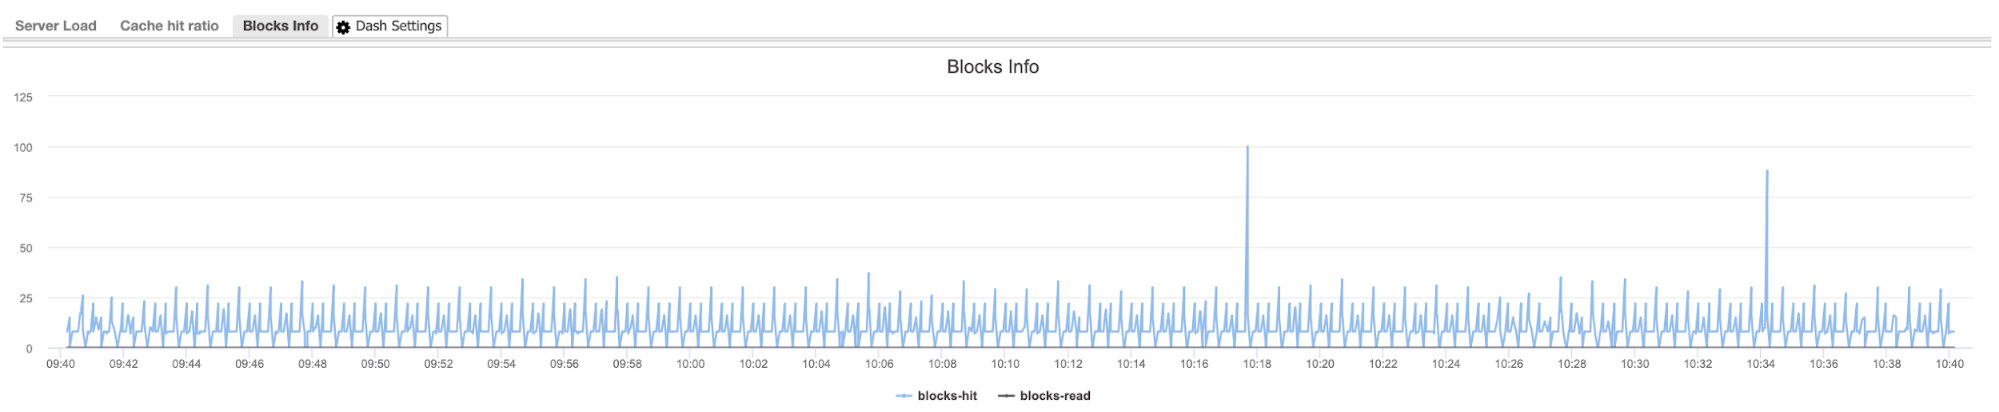
You can also create your custom dashboard settings here just like my example below which fetches blocks-hit and blocks-read.
This is a good place to start as well as you monitor network activity, checking the transfer and receive packets.
The “Nodes” Tab
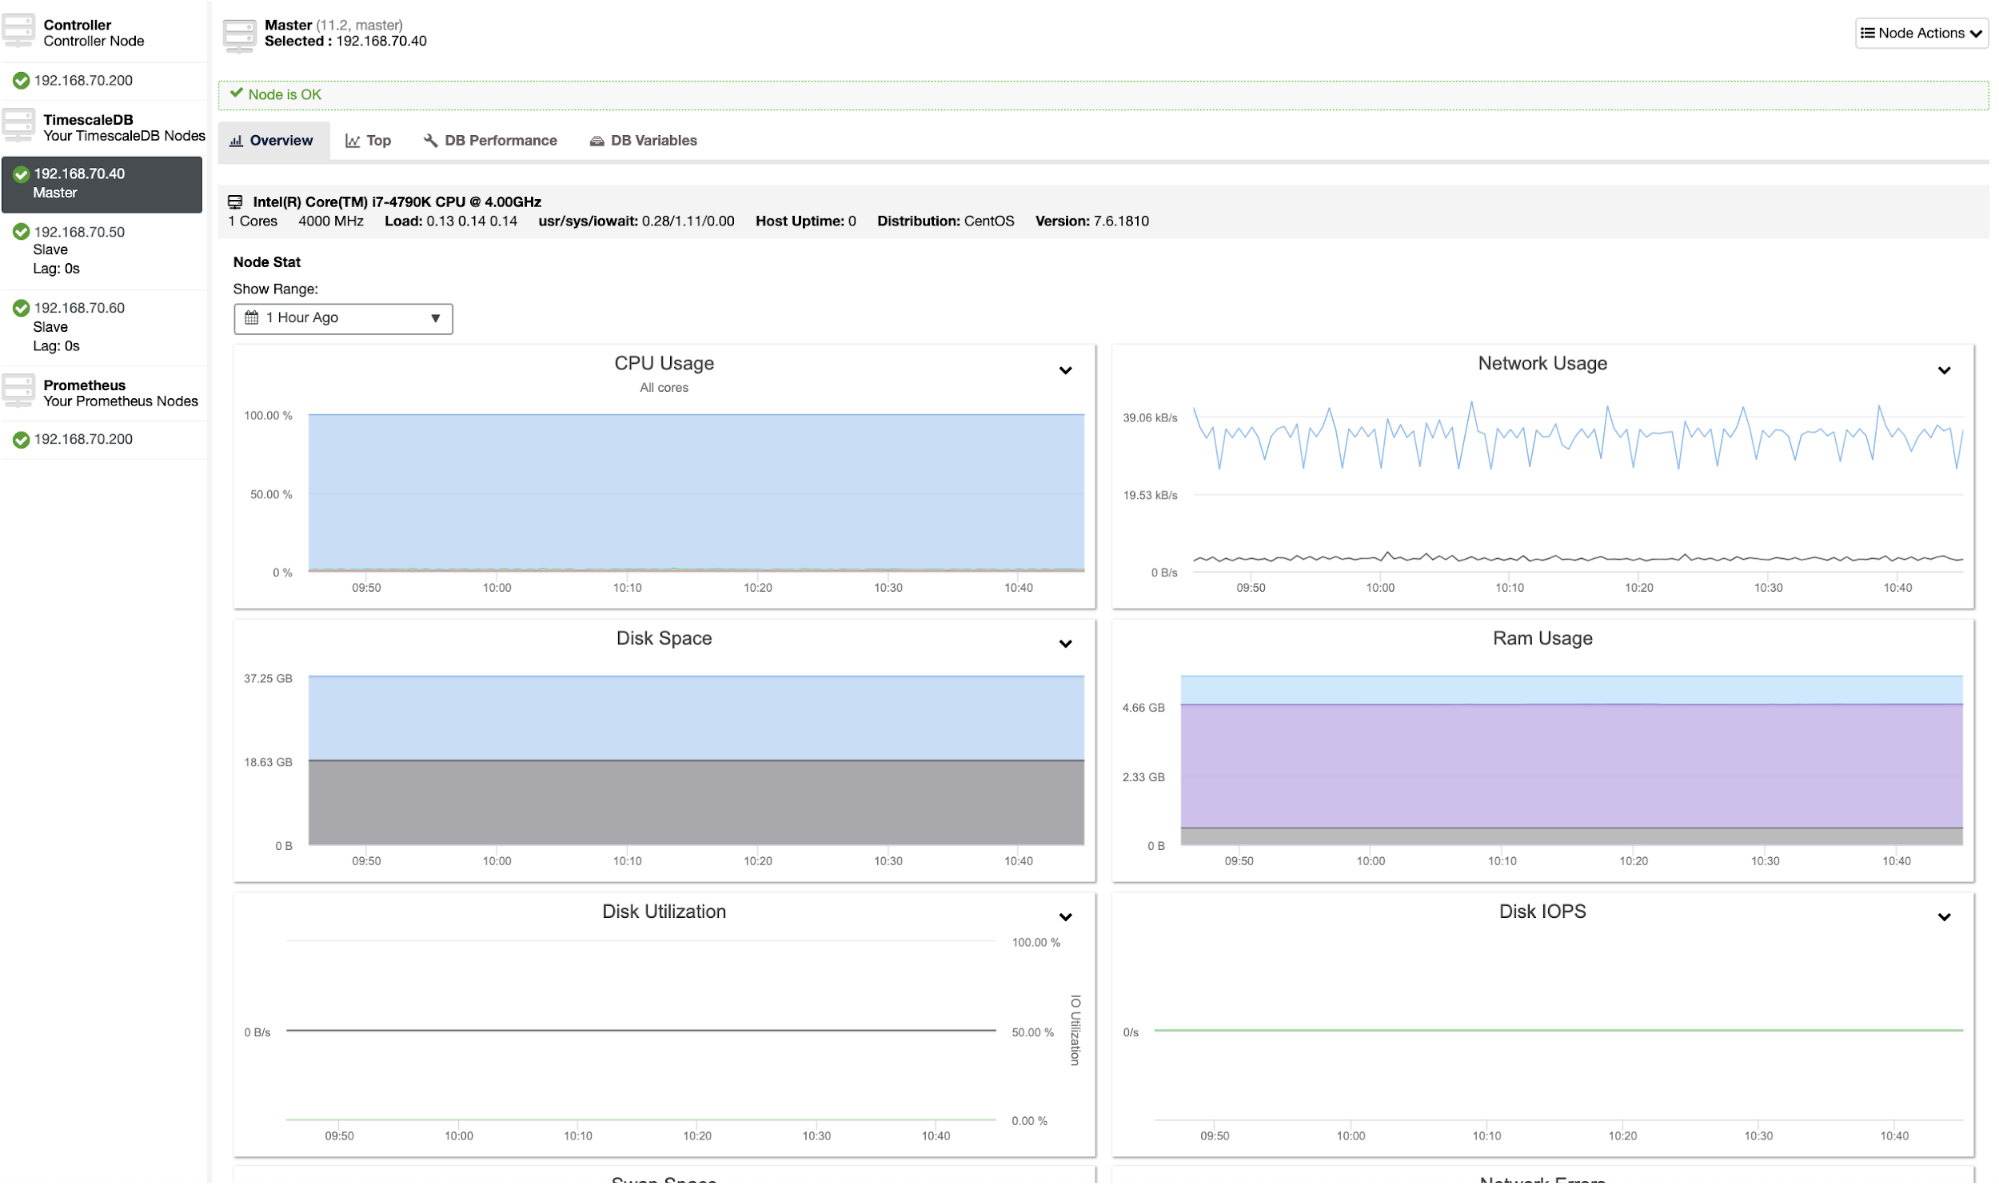
The nodes graphs can be located by going to Cluster → Nodes tab. This contains an in-depth view of your nodes, with host and database-level metrics. See the graph below:
You can also check the top processes running in the host system if you click “Top” tab. See an example screenshot below:
There’s also some features upon right-clicking the node wherein you can enable WAL archiving or restart the PostgreSQL daemon or reboot the host. See image as shown below:
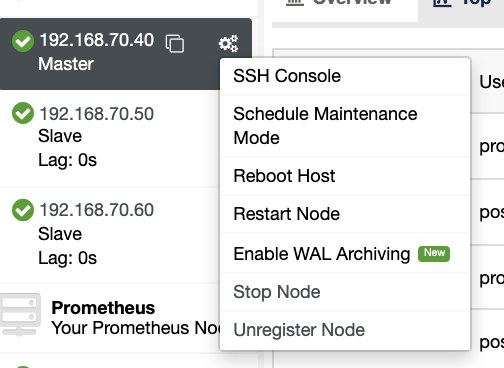
This can be helpful if you want to schedule maintenance on an under-performing node.
The “Dashboards” Tab
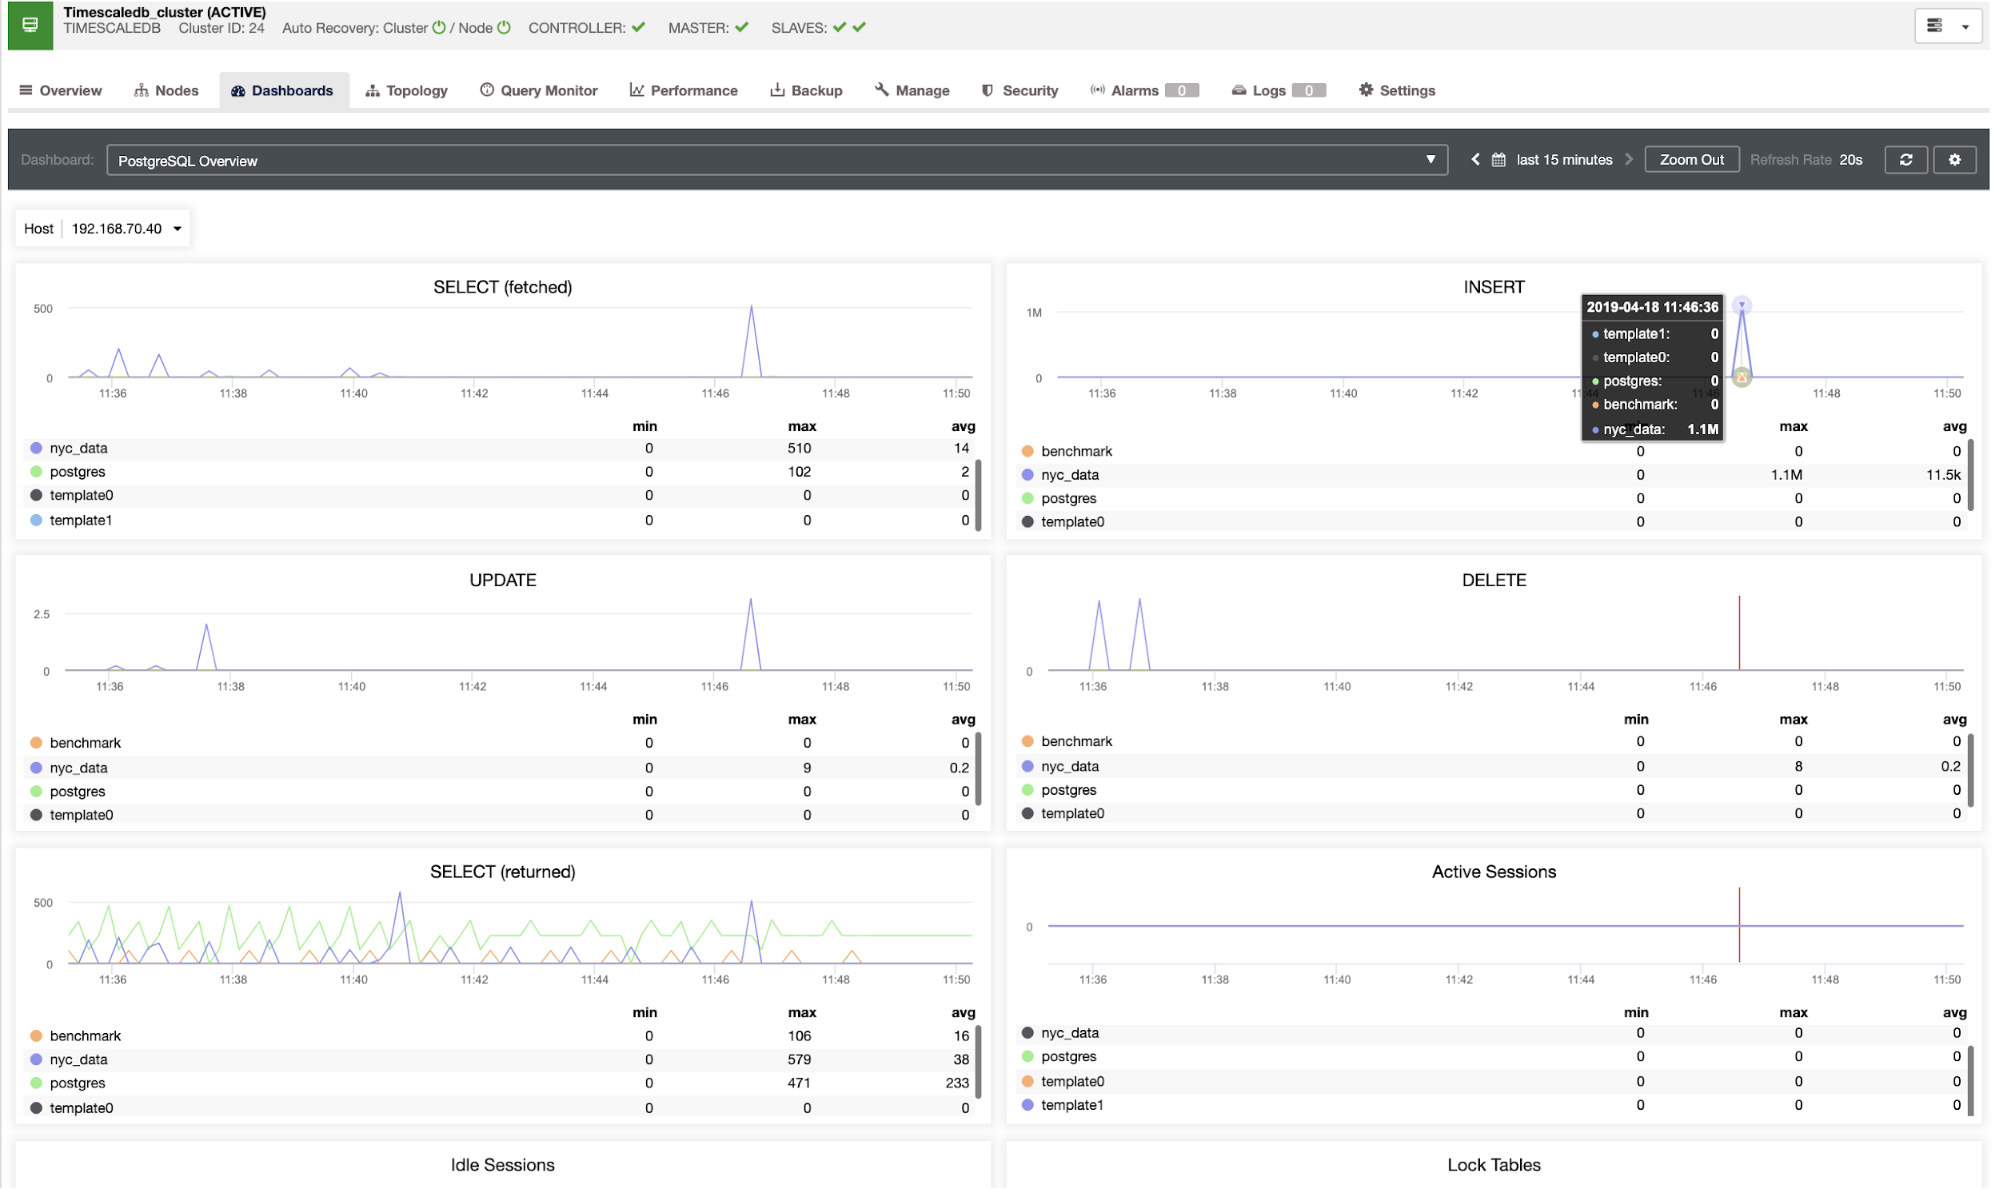
Dashboards was just released last year and with the support of PostgreSQL dashboards, you can take advantage of these graphs. For example, I inserted 1M rows in nyc_data database. See below how it reflects in the PostgreSQL Overview Dashboard:
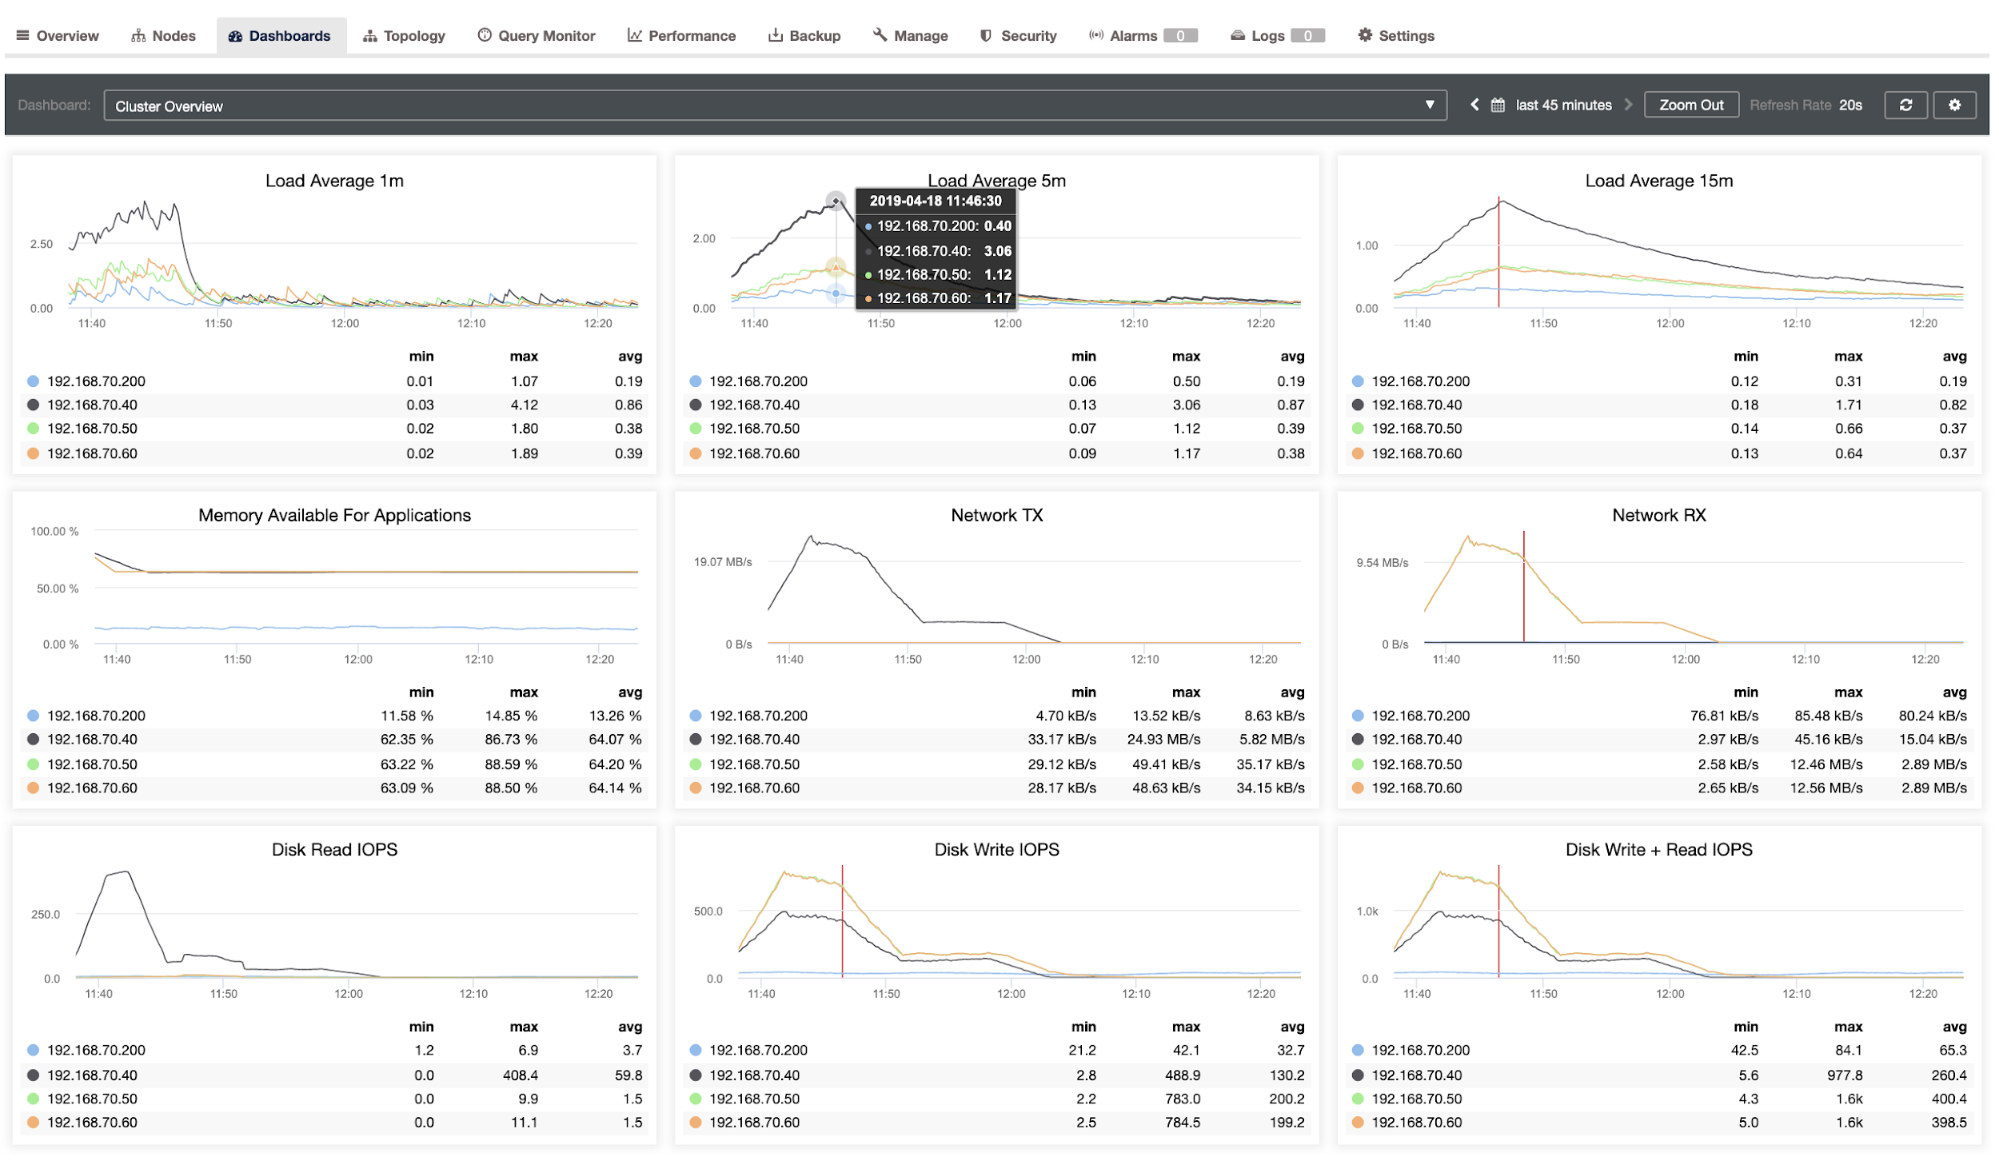
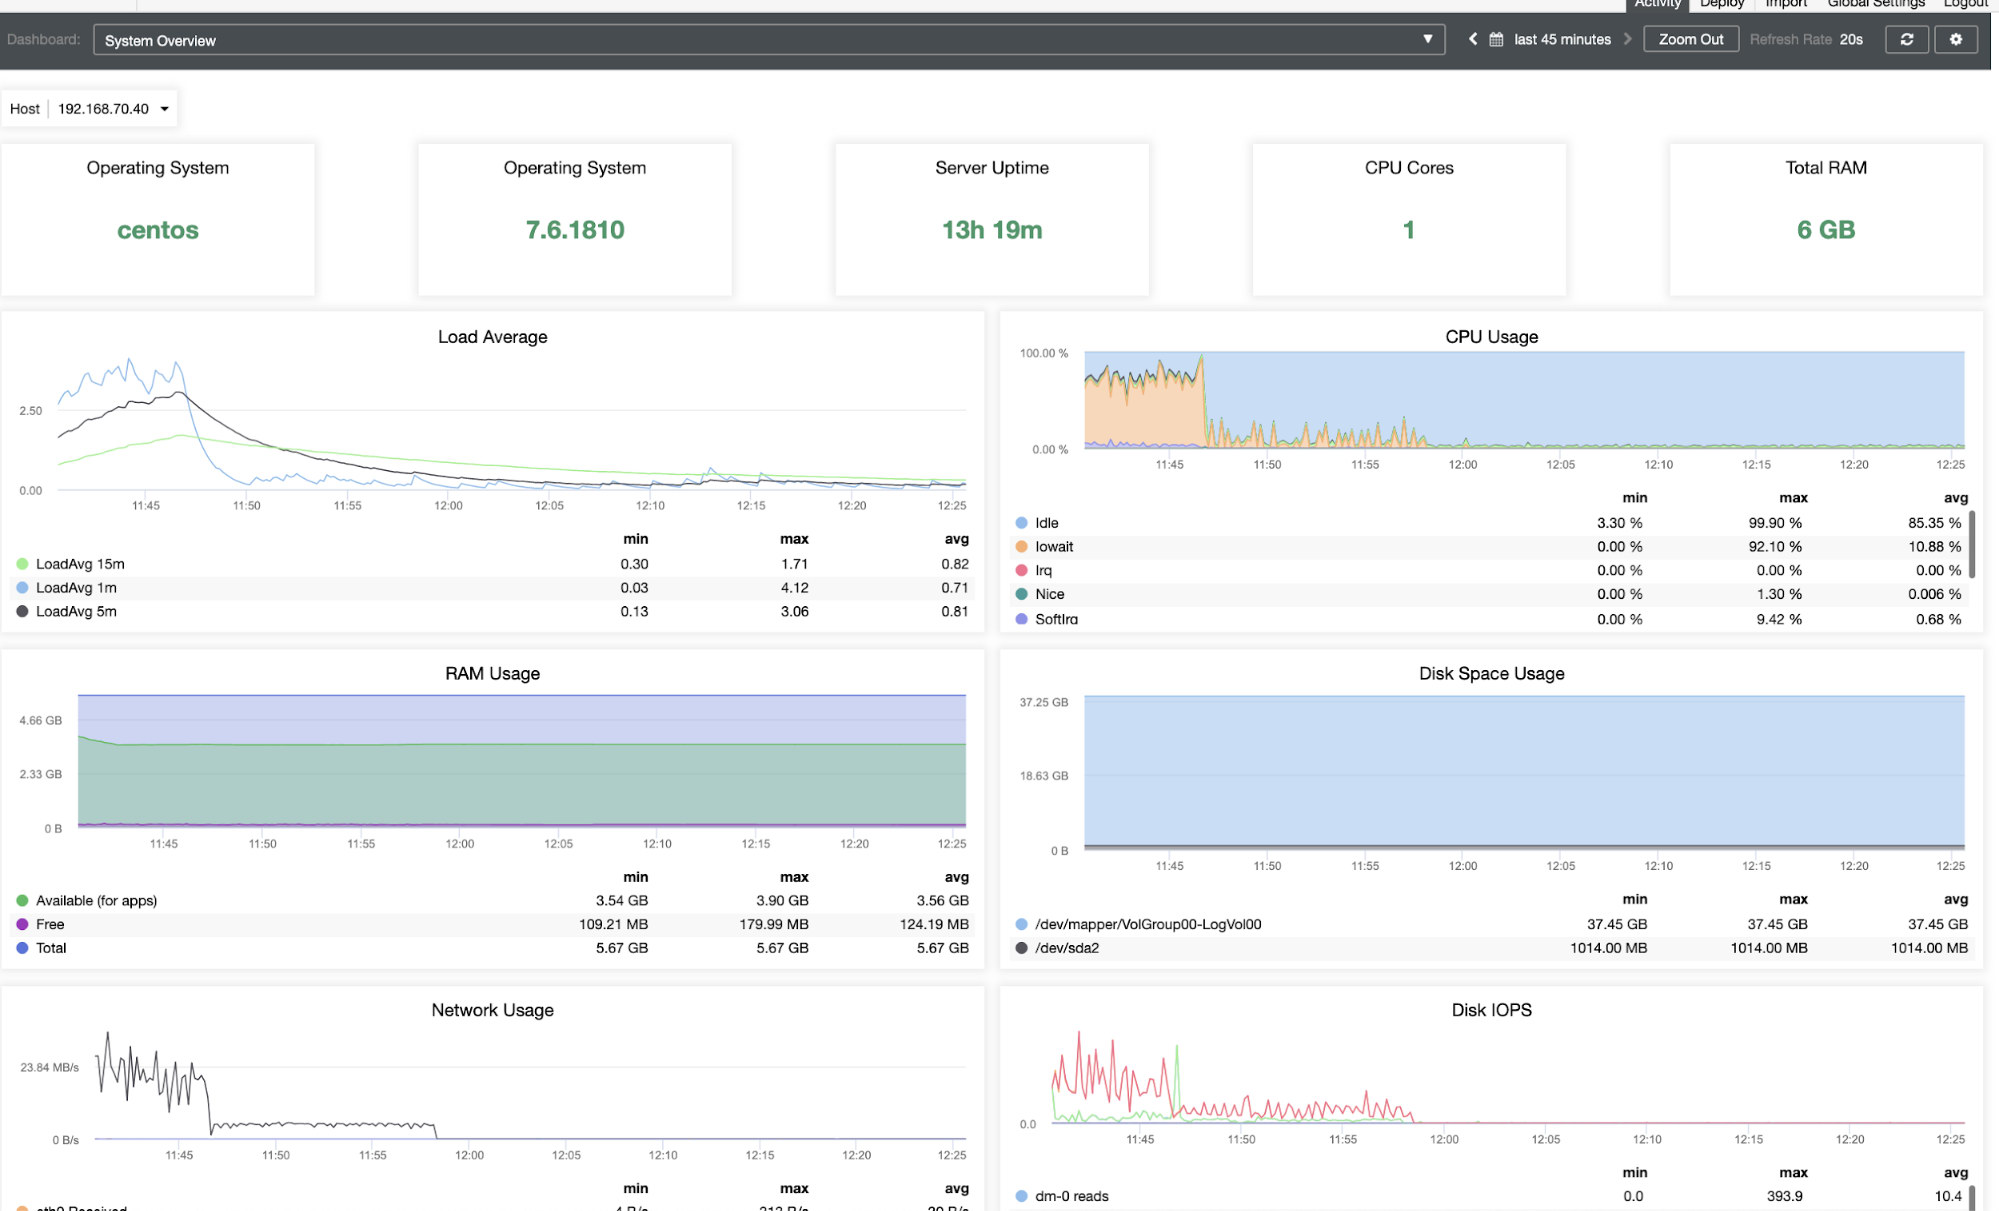
After inserting the 1.1 M rows, we can see that the node 192.168.70.40 is still performant and there’s no sign of high CPU and high disk utilization. See the following dashboard while we monitor its performance:
Aside from the Cluster Overview Dashboard, you can also have a granular view of system performance. See image below:
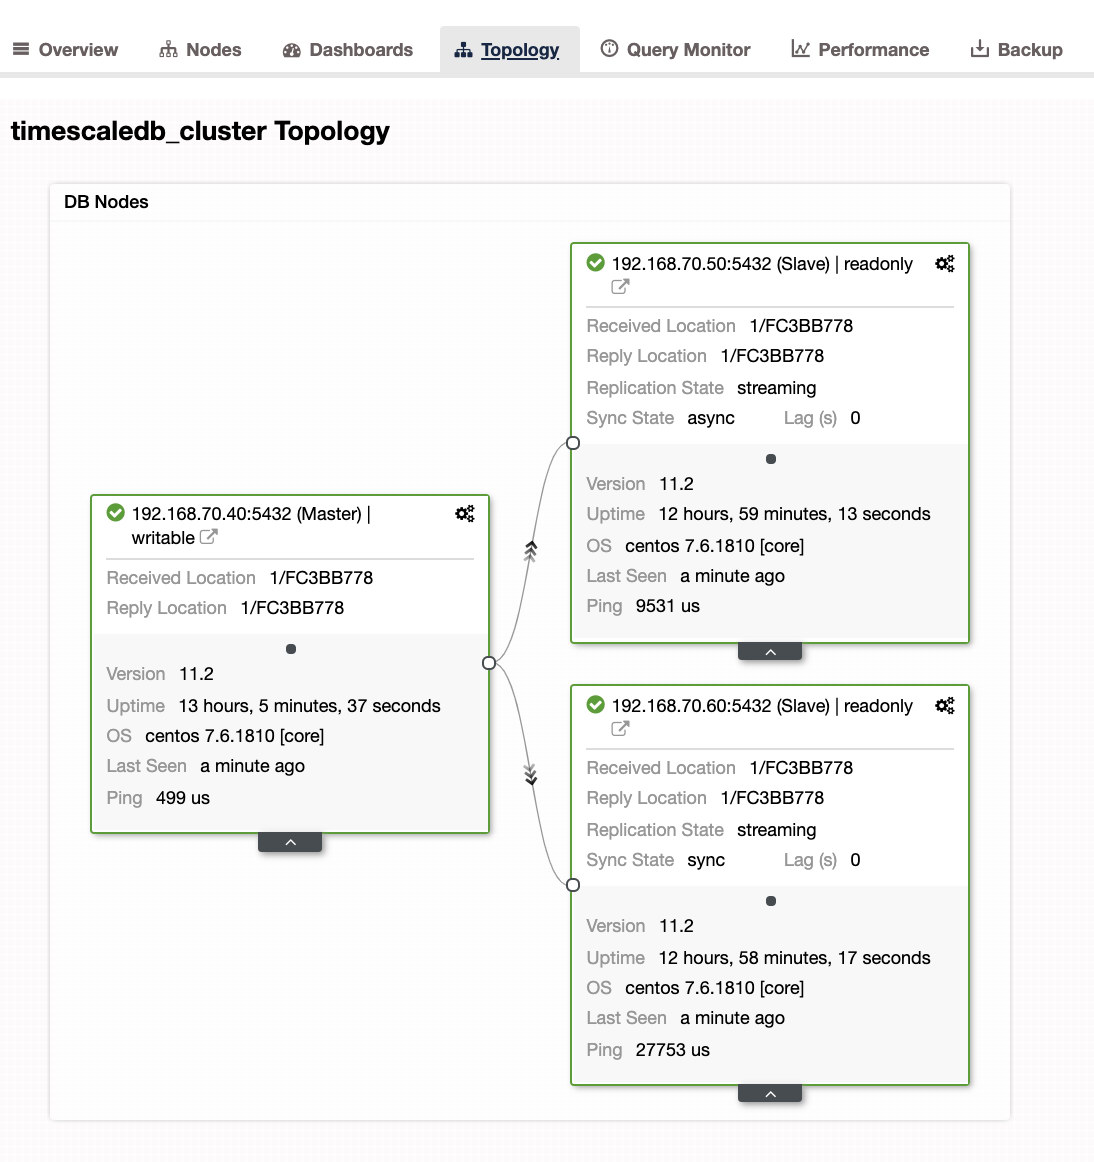
The “Topology” Tab
This tab is simple but offers a view of your master-slave replication topology. It gives you brief but concise information about how does your master and slaves perform. See image below:
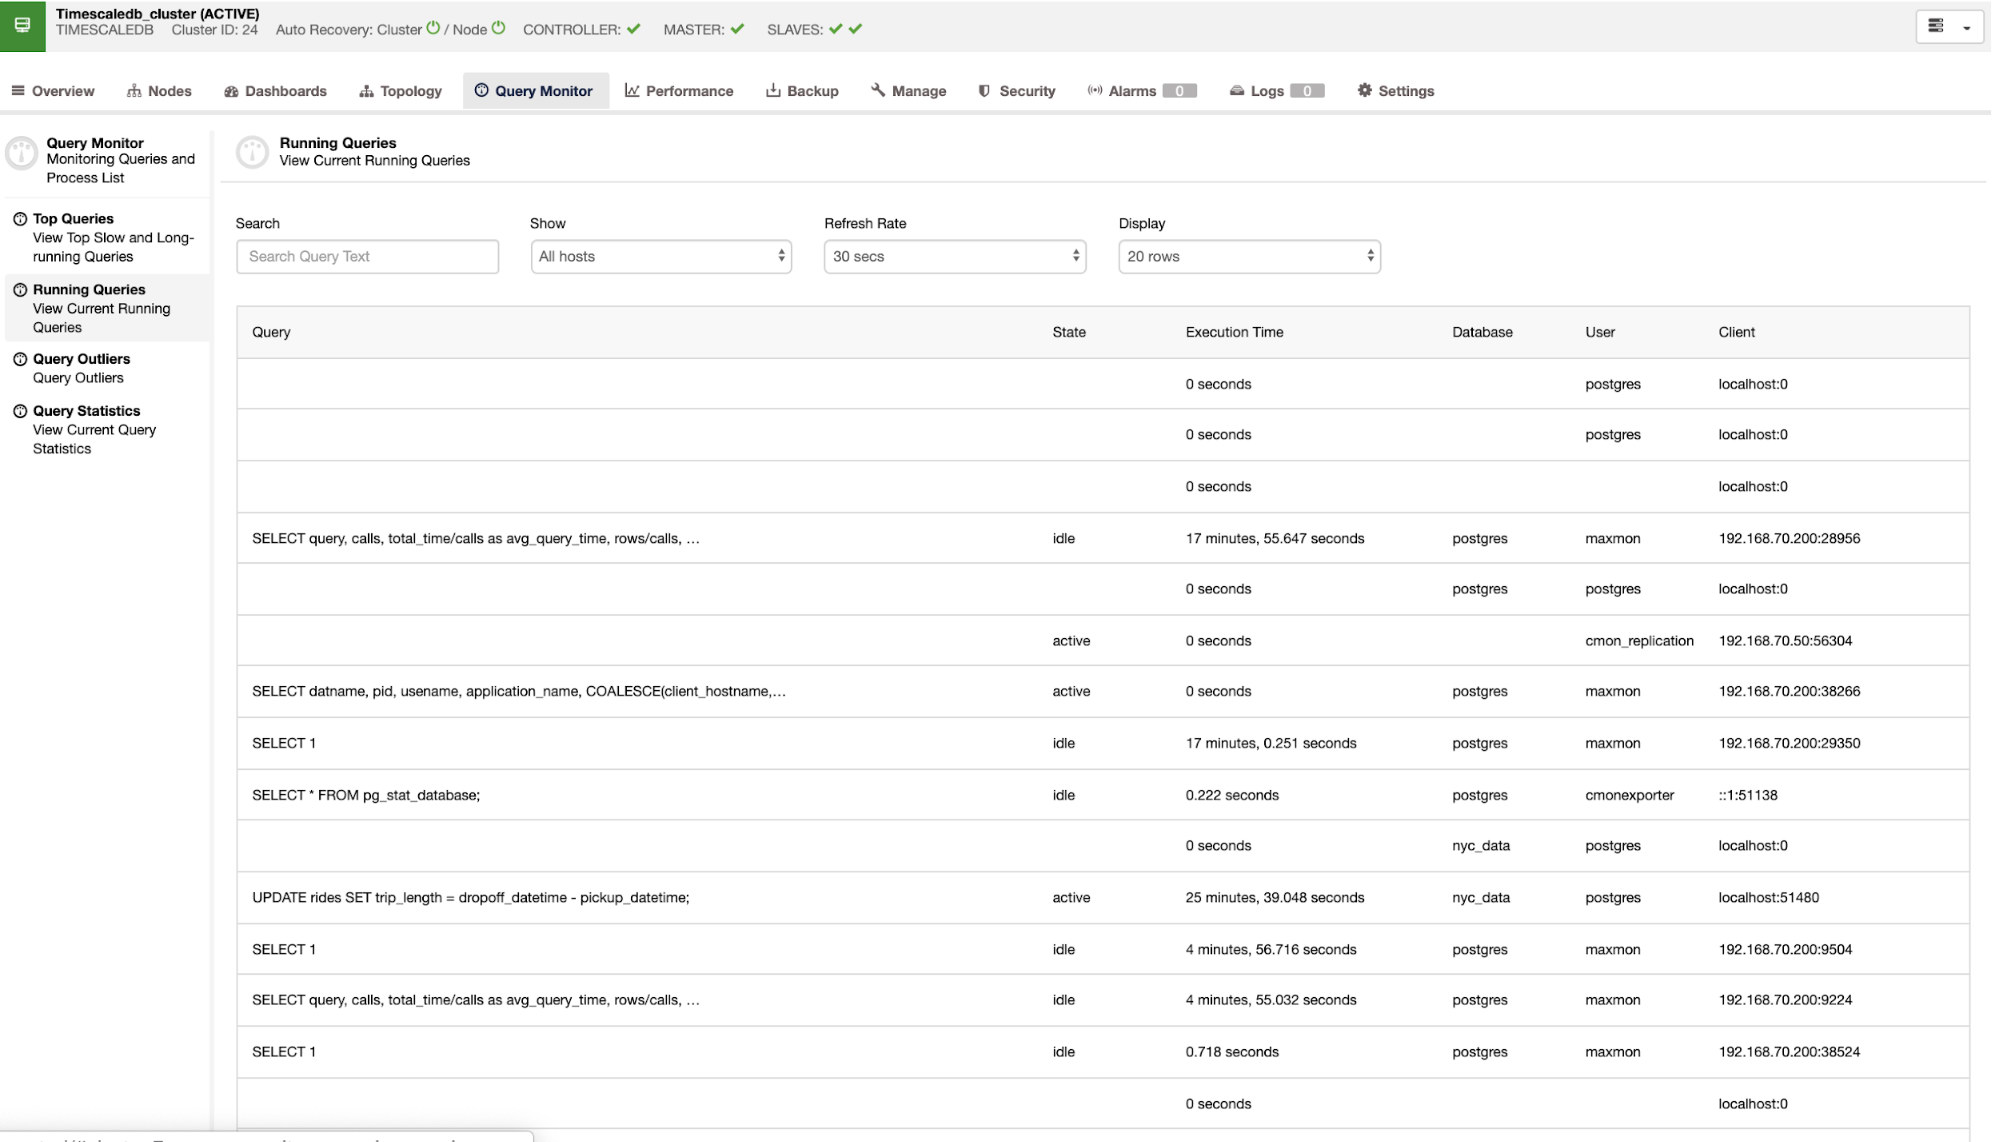
The “Query Monitor” Tab
Monitoring queries in TimescaleDB is very important for a DBA as well as the developers handling the application logic. This tab is very important to understand how queries perform. You can view here the top queries, running queries, query outliers, and query statistics. For example, you can view the queries running on all hosts, or you can filter based on the node you’re trying to monitor. An example below shows how it looks like when viewed under the Query Monitor.
If you want to gather statistics of your TimescaleDB chunks/indexes, you can take advantage here under Query Statistics. It shows a list of your indexes that are used by TimescaleDB. See image below:
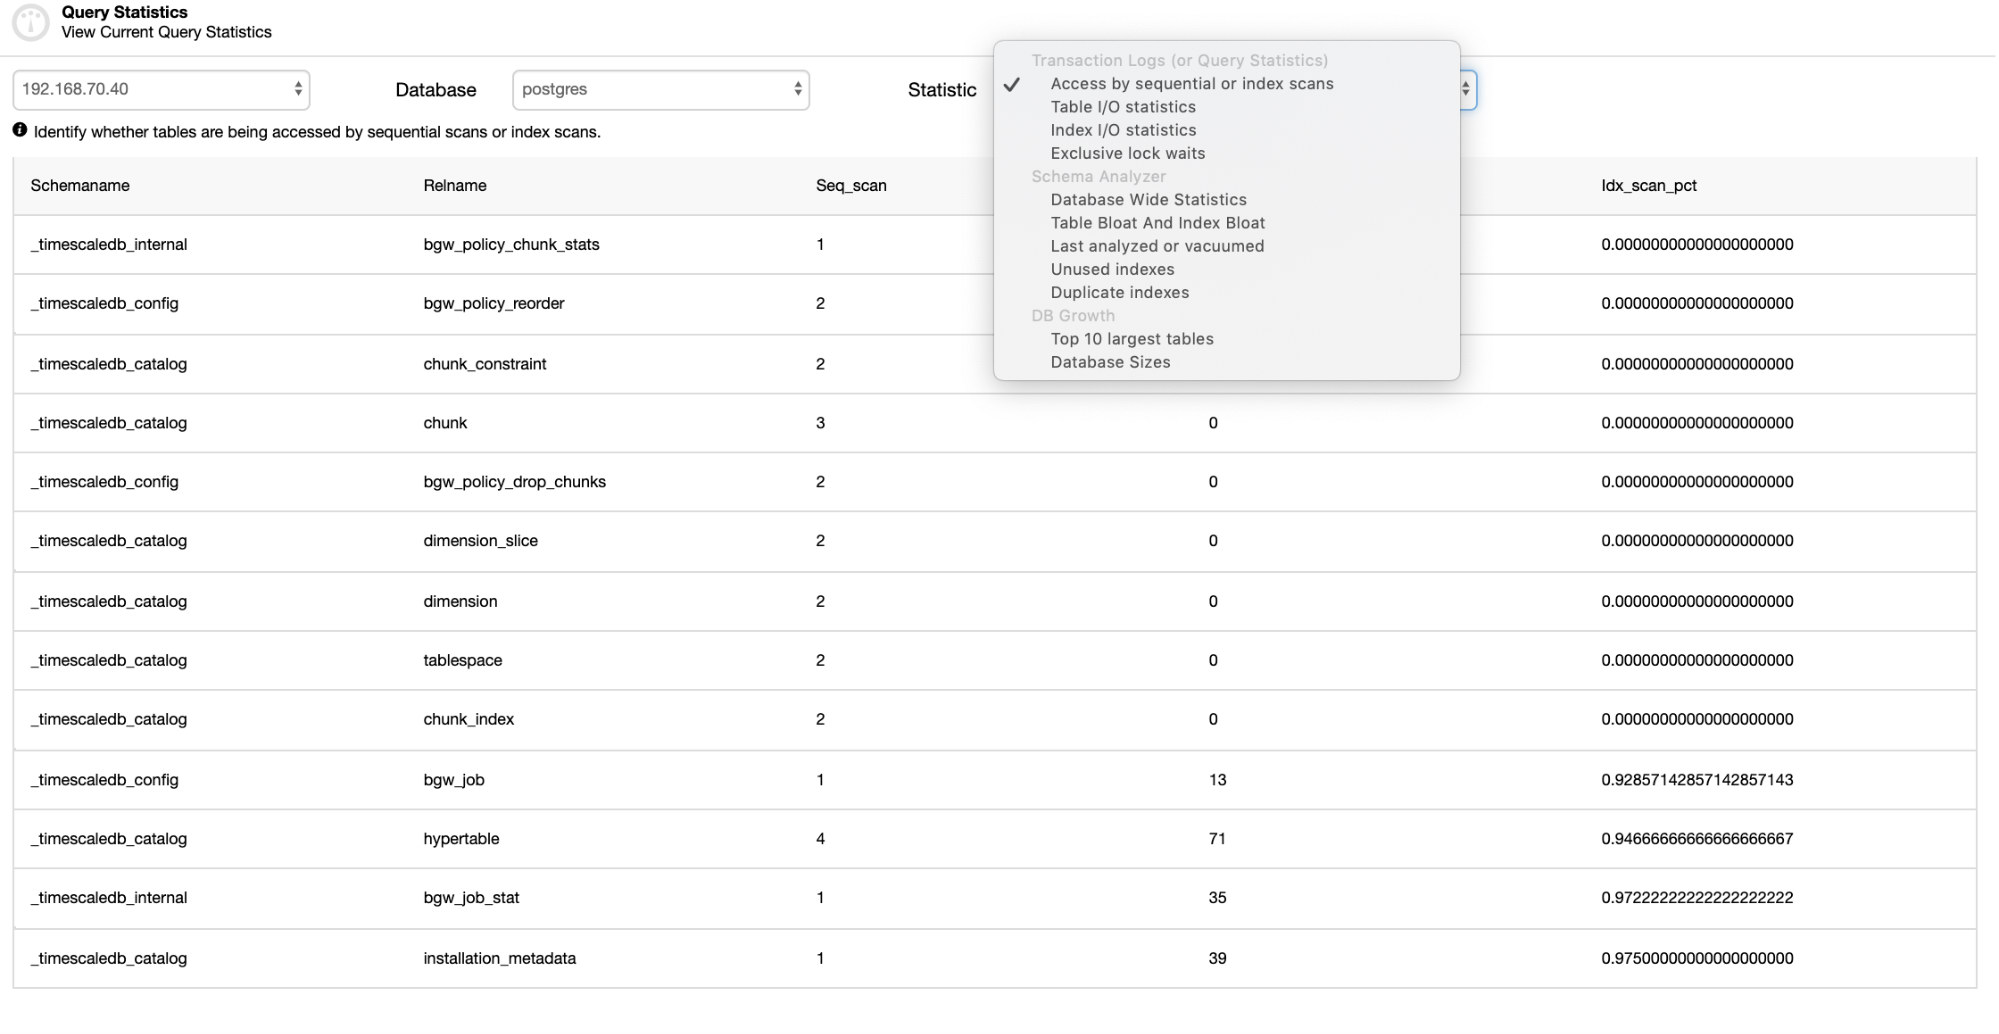
Not only you can view the stats of specific indexes, you can also filter it by its table I/O statistics, index I/O statistics, or its exclusive lock waits. Hence you can check out the other items in the “Statistic” list which you prefer to monitor.
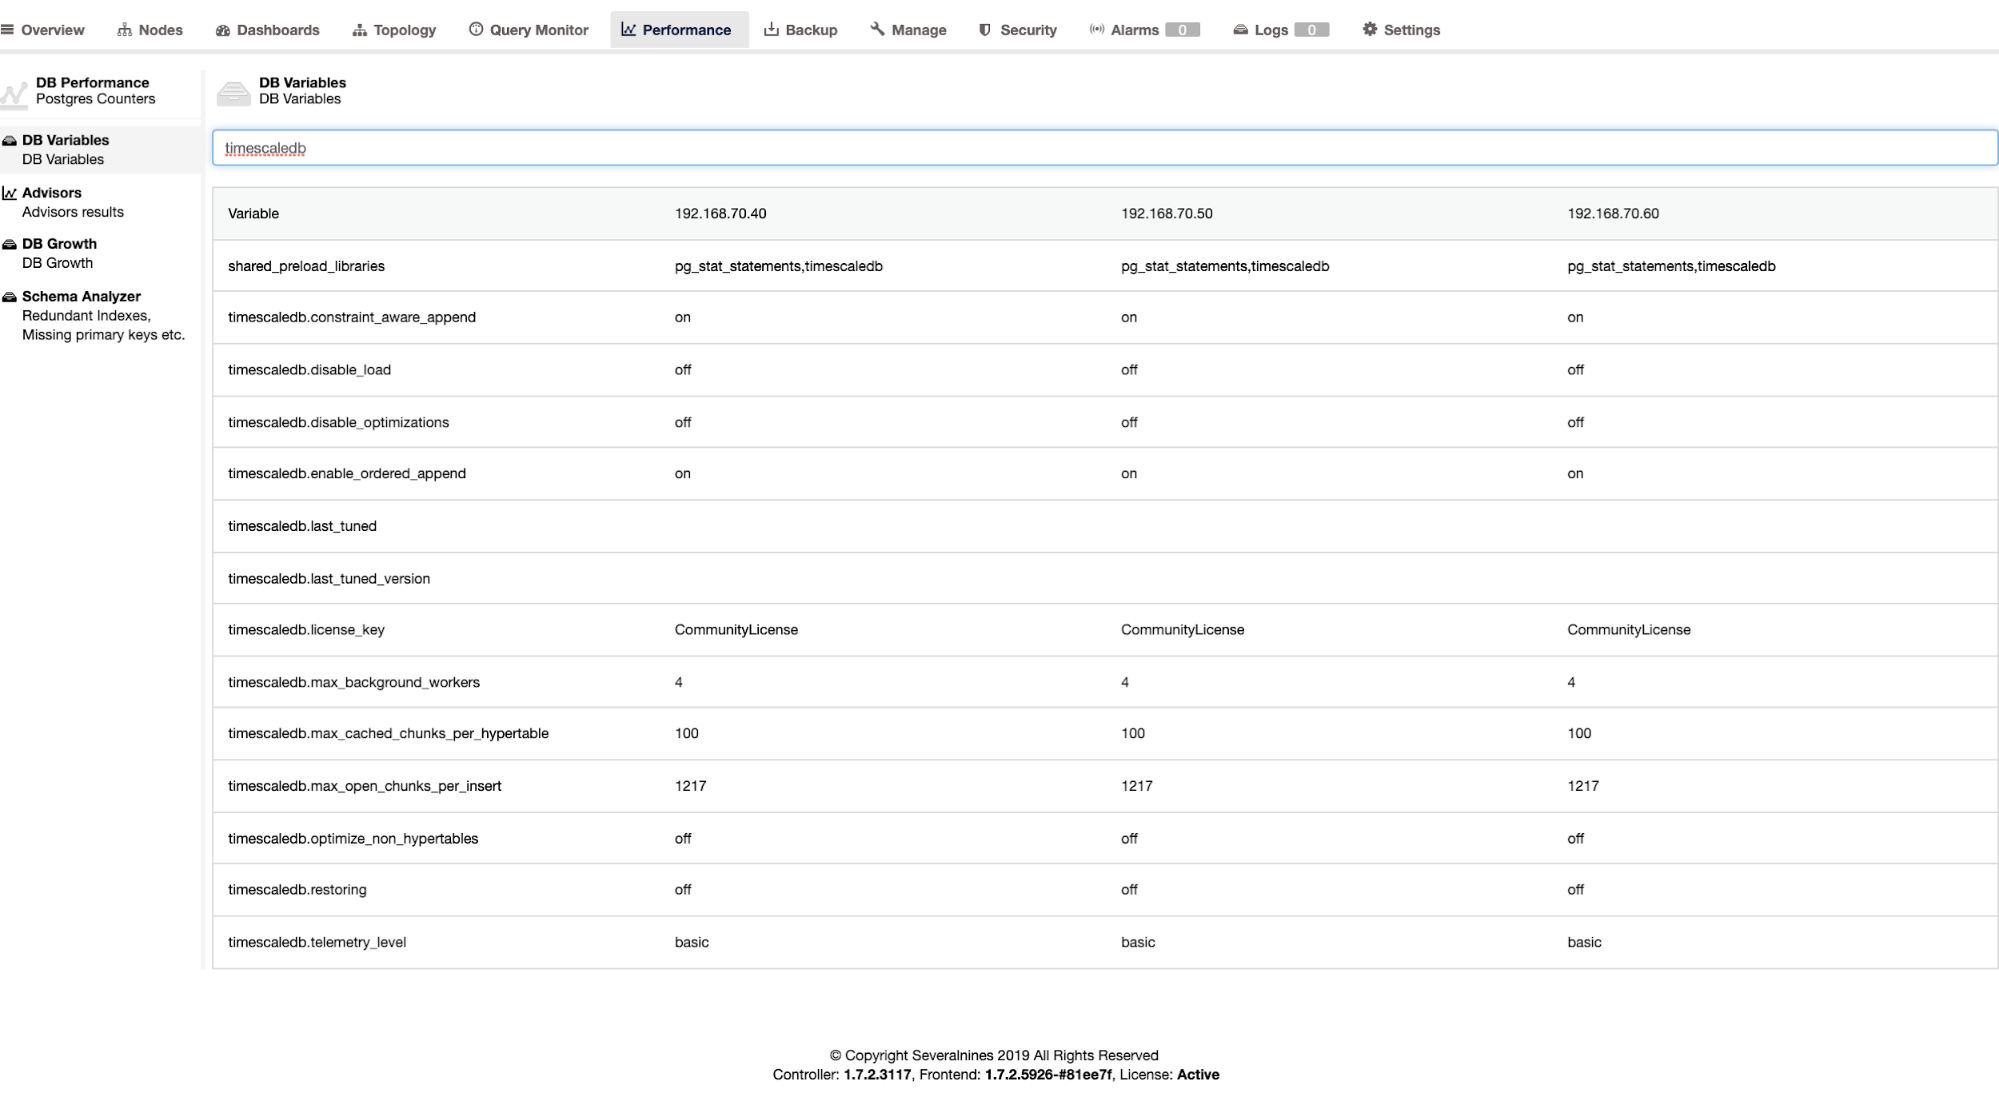
The “Performance” Tab
Under this tab, this is where you are able to review the variables set for optimization and tuning, set up advisors, check the database growth, and generate a schema analysis to gather tables without Primary Keys.
For example, you can view side-by-side the available nodes in the setup and compare variables. See tab below:
That’s all for now. It would be great to hear your feedback, and especially let us know what we are missing.


