blog
A Performance Cheat Sheet for MongoDB

Database performance affects organizational performance, and we tend to want to look for a quick fix. There are many different avenues to improve performance in MongoDB. In this blog, we will help you to understand better your database workload, and things that may cause harm to it. Knowledge of how to use limited resources is essential for anybody managing a production database.
We will show you how to identify the factors that limit database performance. To ensure that database performs as expected, we will start from the free MongoDB Cloud monitoring tool. Then we will check how to manage log files and how to examine queries. To be able to achieve optimal usage of hardware resources, we will take a look into kernel optimization and other crucial OS settings. Finally, we will look into MongoDB replication and how to examine performance.
Free Monitoring of Performance
MongoDB introduced a free performance monitoring tool in the cloud for standalone instances and replica sets. When enabled, the monitored data is uploaded periodically to the vendor’s cloud service. That does not require any additional agents, the functionality is built into the new MongoDB 4.0+. The process is fairly simple to setup and manage. After the single command activation, you will get a unique Web address to access your recent performance stats. You can only access monitored data that has been uploaded within the past 24 hours.
Here is how to activate this feature. You can enable/disable free monitoring during runtime using:
-- Enable Free Monitoring
db.enableFreeMonitoring()
-- Disable Free Monitoring
db.disableFreeMonitoring()
You can also enable or disable free monitoring during mongod startup using either the configuration file setting cloud.monitoring.free.state or the command-line option –enableFreeMonitoring
db.enableFreeMonitoring()After the activation, you will see a message with the actual status.
{
    "state" : "enabled",
    "message" : "To see your monitoring data, navigate to the unique URL below. Anyone you share the URL with will also be able to view this page. You can disable monitoring at any time by running db.disableFreeMonitoring().",
    "url" : "https://cloud.mongodb.com/freemonitoring/cluster/XEARVO6RB2OTXEAHKHLKJ5V6KV3FAM6B",
    "userReminder" : "",
    "ok" : 1
}
Simply copy/paste the URL from the status output to the browser, and you can start checking performance metrics.
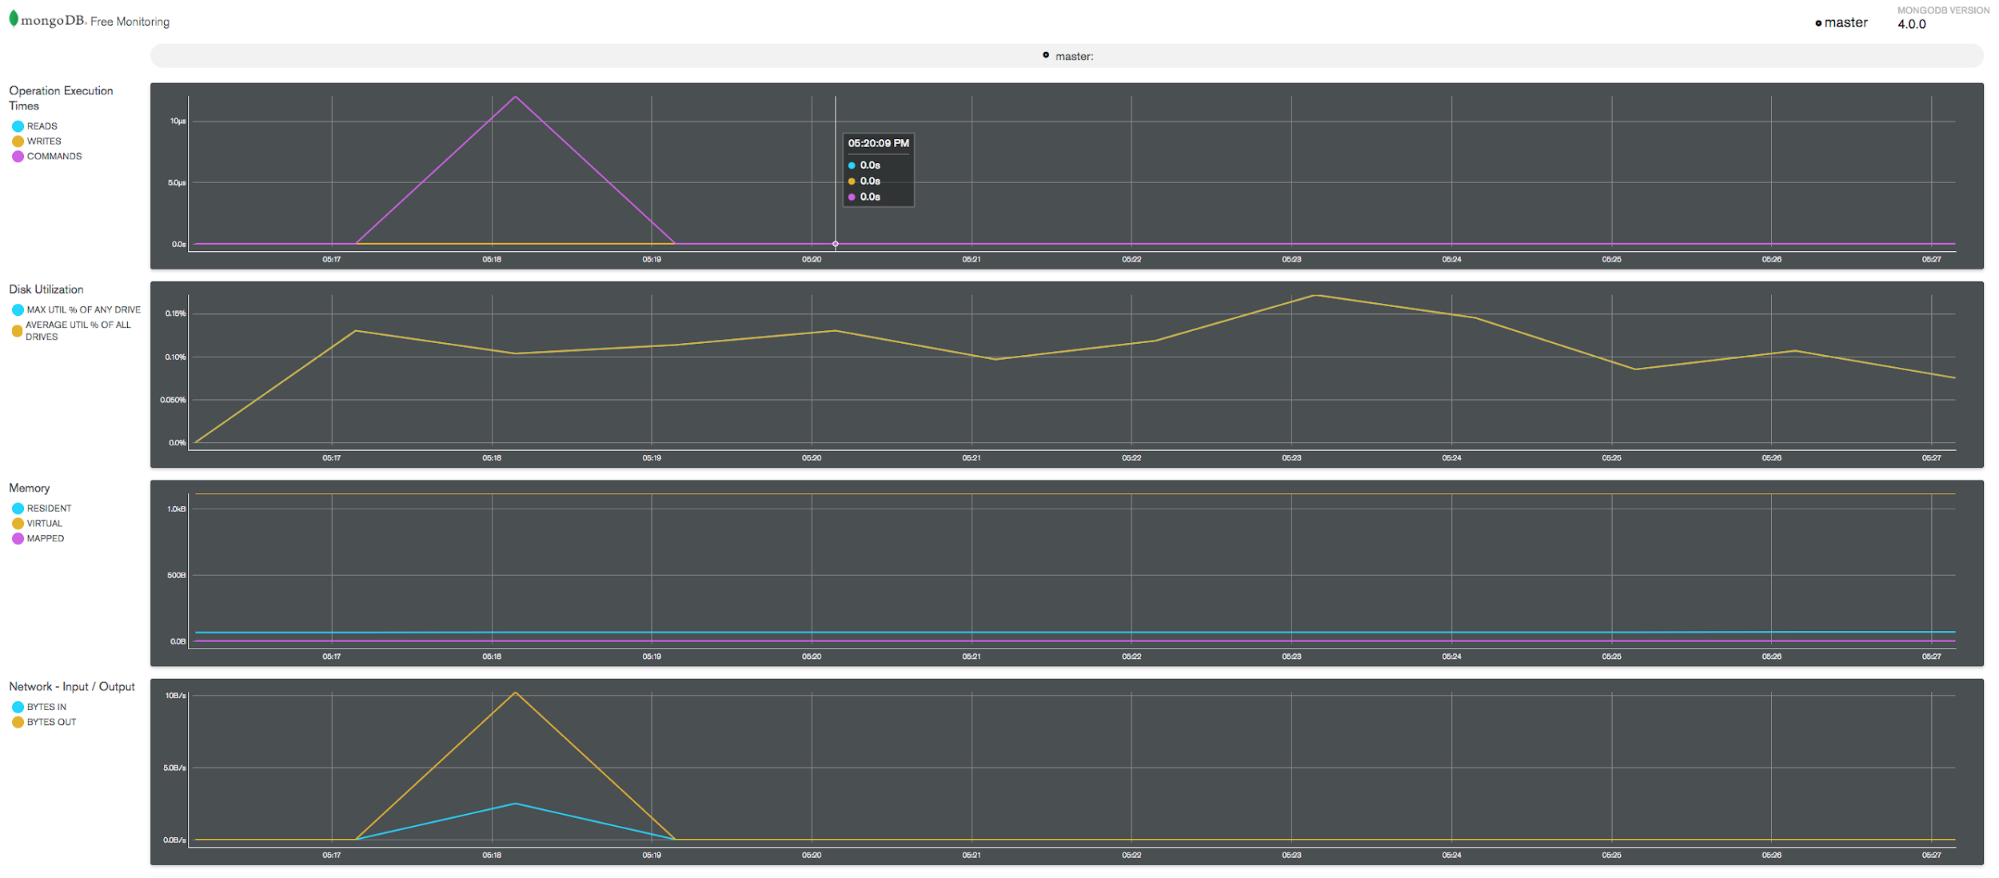
MongoDB Free monitoring provides information about the following metrics:
- Operation Execution Times (READ, WRITES, COMMANDS)
- Disk utilization (MAX UTIL % OF ANY DRIVE, AVERAGE UTIL % OF ALL DRIVES)
- Memory (RESIDENT, VIRTUAL, MAPPED)
- Network – Input / Output (BYTES IN, BYTES OUT)
- Network – Num Requests (NUM REQUESTS)
- Opcounters (INSERT, QUERY, UPDATE, DELETE, GETMORE, COMMAND)
- Opcounters – Replication (INSERT, QUERY, UPDATE, DELETE, GETMORE, COMMAND)
- Query Targeting (SCANNED / RETURNED, SCANNED OBJECTS / RETURNED)
- Queues (READERS, WRITERS, TOTAL)
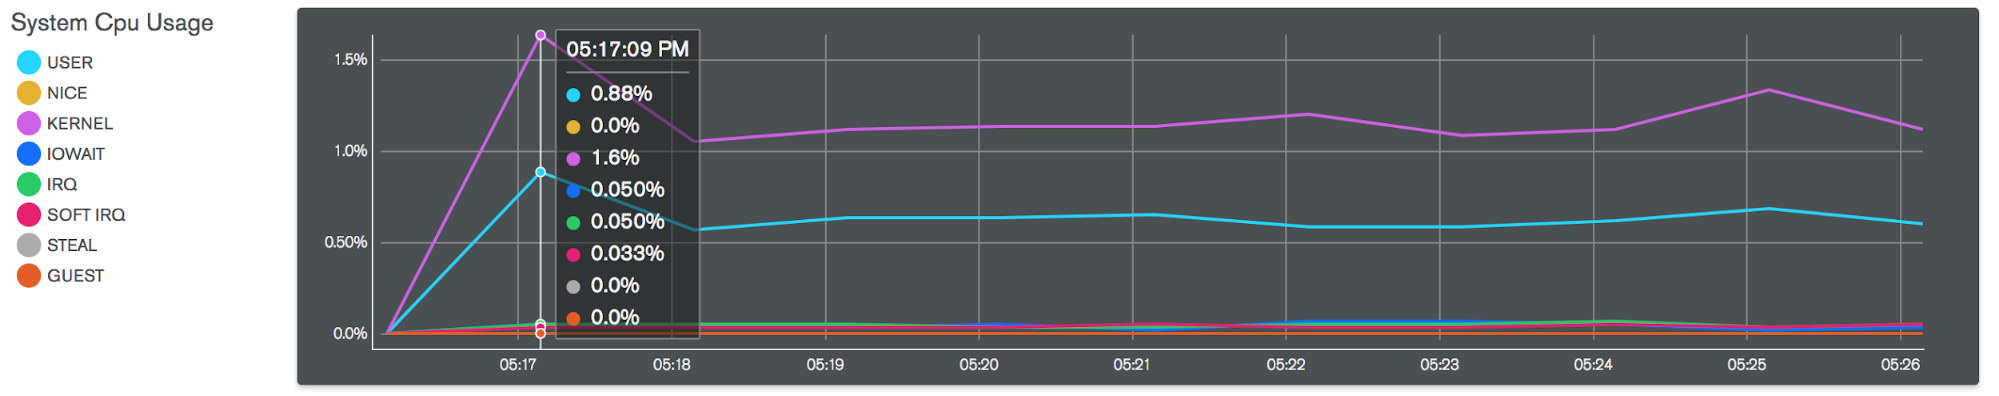
- System Cpu Usage (USER, NICE, KERNEL, IOWAIT, IRQ, SOFT IRQ, STEAL, GUEST)
To view the state of your free monitoring service, use following method:
db.getFreeMonitoringStatus()The serverStatus and the helper db.serverStatus() also includes free monitoring statistics in the free Monitoring field.
When running with access control, the user must have the following privileges to enable free monitoring and get status:
{ resource: { cluster : true }, actions: [ "setFreeMonitoring", "checkFreeMonitoringStatus" ] }This tool may be a good start for those who find it difficult to read MongoDB server status output from the commandline:
db.serverStatus()Free Monitoring is a good start but it has very limited options, if you need a more advanced tool you may want to check MongoDB Ops Manager or ClusterControl.
Logging database operations
MongoDB drivers and client applications can send information to the server log file. Such information depends on the type of the event. To check current settings, login as admin and execute:
db.getLogComponents()Log messages include many components. This is to provide a functional categorization of the messages. For each of the component, you can set different log verbosity. The current list of components is:
ACCESS, COMMAND, CONTROL, FTD, GEO, INDEX, NETWORK, QUERY, REPL_HB, REPL, ROLLBACK, REPL, SHARDING, STORAGE, RECOVERY, JOURNAL, STORAGE, WRITE.For more details about each of the components, check the documentation.
Capturing queries – Database Profiler
MongoDB Database Profiler collects information about operations that run against a mongod instance. By default, the profiler does not collect any data. You can choose to collect all operations (value 2), or those that take longer than the value of slowms. The latter is an instance parameter which can be controled through the mongodb configuration file. To check the current level:
db.getProfilingLevel()To capture all queries set:
db.setProfilingLevel(2)In the configuration file, you can set:
profile = <0/1/2>
slowms =
This setting will be applied on a single instance and not propagate across a replica set or shared cluster, so you need to repeat this command of all of the nodes if you want to capture all activities. Database profiling can impact database performance. Enable this option only after careful consideration.
Then to list the 10 most recent:
db.system.profile.find().limit(10).sort(
{ ts : -1 }
).pretty()
To list all:
db.system.profile.find( { op:
{ $ne : 'command' }
} ).pretty()
And to list for a specific collection:
db.system.profile.find(
{ ns : 'mydb.test' }
).pretty()
MongoDB logging
MongoDB log location is defined in your configuration’s logpath setting, and it’s usually /var/log/mongodb/mongod.log. You can find MongoDB configuration file at /etc/mongod.conf.
Here is sample data:
2018-07-01T23:09:27.101+0000 I ASIO     [NetworkInterfaceASIO-Replication-0] Connecting to node1:27017
2018-07-01T23:09:27.102+0000 I ASIO     [NetworkInterfaceASIO-Replication-0] Failed to connect to node1:27017 - HostUnreachable: Connection refused
2018-07-01T23:09:27.102+0000 I ASIO     [NetworkInterfaceASIO-Replication-0] Dropping all pooled connections to node1:27017 due to failed operation on a connection
2018-07-01T23:09:27.102+0000 I REPL_HB  [replexec-2] Error in heartbeat (requestId: 21589) to node1:27017, response status: HostUnreachable: Connection refused
2018-07-01T23:09:27.102+0000 I ASIO     [NetworkInterfaceASIO-Replication-0] Connecting to node1:27017
You can modify log verbosity of the component by setting (query example):
db.setLogLevel(2, "query")The log file can be significant, so you may want to clear it before profiling. From the MongoDB commandline console, enter:
db.runCommand({ logRotate : 1 });Checking operating system parameters
Memory limits
To see the limits associated with your login, use the command ulimit -a. The following thresholds and settings are particularly important for mongod and mongos deployments:
-f (file size): unlimited
-t (cpu time): unlimited
-v (virtual memory): unlimited
-n (open files): 64000
-m (memory size): unlimited [1]
-u (processes/threads): 32000
The newer version of the mongod startup script (/etc/init.d/mongod) has the default settings built into the start option:
start()
{
  # Make sure the default pidfile directory exists
  if [ ! -d $PIDDIR ]; then
    install -d -m 0755 -o $MONGO_USER -g $MONGO_GROUP $PIDDIR
  fi

  # Make sure the pidfile does not exist
  if [ -f "$PIDFILEPATH" ]; then
      echo "Error starting mongod. $PIDFILEPATH exists."
      RETVAL=1
      return
  fi

  # Recommended ulimit values for mongod or mongos
  # See http://docs.mongodb.org/manual/reference/ulimit/#recommended-settings
  #
  ulimit -f unlimited
  ulimit -t unlimited
  ulimit -v unlimited
  ulimit -n 64000
  ulimit -m unlimited
  ulimit -u 64000
  ulimit -l unlimited

  echo -n $"Starting mongod: "
  daemon --user "$MONGO_USER" --check $mongod "$NUMACTL $mongod $OPTIONS >/dev/null 2>&1"
  RETVAL=$?
  echo
  [ $RETVAL -eq 0 ] && touch /var/lock/subsys/mongod
}
The role of the memory management subsystem also called the virtual memory manager is to manage the allocation of physical memory (RAM) for the entire kernel and user programs. This is controled by the vm.* parameters. There are two which you should consider in first place in order to tune MongoDB performance – vm.dirty_ratio and vm.dirty_background_ratio.
vm.dirty_ratio is the absolute maximum amount of system memory that can be filled with dirty pages before everything must get committed to disk. When the system gets to this point, all new I/O blocks until dirty pages have been written to disk. This is often the source of long I/O pauses. The default is 30, which is usually too high. vm.dirty_background_ratio is the percentage of system memory that can be filled with “dirty” pages — memory pages that still need to be written to disk. The good start is to go from 10 and measure performance. For a low memory environment, 20 is a good start. A recommended setting for dirty ratios on large-memory database servers is vm.dirty_ratio = 15 and vm.dirty_background_ratio = 5 or possibly less.
To check dirty ratio run:
sysctl -a | grep dirtyYou can set this by adding the following lines to “/etc/sysctl.conf”:
Swappiness
On servers where MongoDB is the only service running, it’s a good practice to set vm.swapiness = 1. The default setting is set to 60 which is not appropriate for a database system.
vi /etc/sysctl.conf
vm.swappiness = 1
Transparent huge pages
If you are running your MongoDB on RedHat, make sure that Transparent Huge Pages is disabled.
This can be checked by commnad:
cat /proc/sys/vm/nr_hugepages
0
0 means that transparent huge pages are disabled.
Filesystem options
ext4 rw,seclabel,noatime,data=ordered 0 0NUMA (Non-Uniform Memory Access)
MongoDB does not support NUMA, disable it in BIOS.
Network stack
net.core.somaxconn = 4096
net.ipv4.tcp_fin_timeout = 30
net.ipv4.tcp_keepalive_intvl = 30
net.ipv4.tcp_keepalive_time = 120
net.ipv4.tcp_max_syn_backlog = 4096
NTP deamon
To install NTP time server demon, use one of the following system commands.
#Red Hat
sudo yum install ntp
#Debian
sudo apt-get install ntp
You can find more details about OS performance for MongoDB in another blog.
Explain plan
Similar to other popular database systems, MongoDB provides an explain facility which reveals how a database operation was executed. The explain results display the query plans as a tree of stages. Each stage passes its events (i.e. documents or index keys) to the parent node. The leaf nodes access the collection or the indices.You can add explain(‘executionStats’) to a query.
db.inventory.find( {
     status: "A",
     $or: [ { qty: { $lt: 30 } }, { item: /^p/ } ]
} ).explain('executionStats');
or append it to the collection:
db.inventory.explain('executionStats').find( {
     status: "A",
     $or: [ { qty: { $lt: 30 } }, { item: /^p/ } ]
} );
The keys whose values you should watch out for in the output of the above command execution:
- totalKeysExamined: The total number of index entries scanned to return query.
- totalDocsExamined: The total number of documents scanned to find the results.
- executionTimeMillis: Total time in milliseconds required for query plan selection and query execution.
Measuring replication lag performance
Replication lag is a delay between an operation on the primary and the application of that operation from the oplog to the secondary. In other words, it defines how far the secondary is behind the primary node, which in the best case scenario, should be as close as possible to 0.
Replication process can be affected for multiple reasons. One of the main issues could be the secondary members are running out of server capacity. Large write operations on the primary member leading to secondary members being unable to replay the oplogs, or Index building on the primary member.
To check the current replication lag, run in a MongoDB shell:
db.getReplicationInfo()
db.getReplicationInfo()
{
    "logSizeMB" : 2157.1845703125,
    "usedMB" : 0.05,
    "timeDiff" : 4787,
    "timeDiffHours" : 1.33,
    "tFirst" : "Sun Jul 01 2018 21:40:32 GMT+0000 (UTC)",
    "tLast" : "Sun Jul 01 2018 23:00:19 GMT+0000 (UTC)",
    "now" : "Sun Jul 01 2018 23:00:26 GMT+0000 (UTC)"
Replication status output can be used to assess the current state of replication, and determine if there is any unintended replication delay.
rs.printSlaveReplicationInfo()It shows the time delay between the secondary members with respect to the primary.
rs.status()It shows the in-depth details for replication. We can gather enough information about replication by using these commands. Hopefully, these tips give a quick overview of how to review MongoDB performance. Let us know if we’ve missed anything.