blog
Monitoring Galera Cluster – Understanding and Optimizing IO-Related InnoDB Metrics

This blog post is a follow up to our previous post on monitoring CPU-related InnoDB metrics in Galera Cluster.
One of the main issues in terms of scalability of MySQL (and thereby also Galera) is the ability to handle large amounts of I/O activity. MySQL, historically, was not very good in this area – flushing caused bumps and spikes in the workload, and kernel mutex was wrecking havoc in the overall stability. I/O handling changed in MySQL 5.5 and has been improved even further in MySQL 5.6. Multiple background threads for I/O, adaptive approach to flushing data, splitting the kernel mutex into a number of new mutexes and rw-locks. Even with all those changes, checking MySQL I/O metrics is a very important part of the daily routine.
How InnoDB saves data modifications?
So, how does InnoDB handle writes? It’s a long story, but necessary to be told in order to give you some background in regards to the metrics we’ll be discussing later. We will try to make it short and concise, so please expect some simplifications.
Once a DML is committed, the cogwheels start to spin. To ensure durability, the change is written into the InnoDB log buffer and then flushed to InnoDB log files, known also as InnoDB redo log. The way things work here is governed by the innodb_flush_log_at_trx_commit variable. By default (innodb_flush_log_at_trx_commit = 1), data is flushed to both log buffer in memory and redo log on disk at the transaction commit. This ensures durability (data is on disk) but it puts stress on the I/O subsystem (each commit requires a disk write). In some cases it’s acceptable to live with less strict durability rules. In such case we have two more options available.
First (innodb_flush_log_at_trx_commit = 2) is very similar to the default one. The change is written to in-memory InnoDB log buffer and to the InnoDB redo log, but it is not flushed to disk immediately but rather, once per second (approximately). This is a significant change. Flushing forces data to be written to disk. Writing without a flush does not force the disk write – data can be (and in fact, it is) stored in the operating system’s disk buffers and flushed to disk later. This change is crucial – we don’t have a flush per transaction commit but a flush per second. It brings some danger too – if the whole instance went down between the moment of committing and the moment of data flush, those transactions may get lost.
Second option (innodb_flush_log_at_trx_commit=0) is the most risky one but also the fastest. With such setting there are no writes to InnoDB redo log after commit – data is stored only in InnoDB’s log buffer and flushed to disk every second. As a result, we have even less disk operations but now, even a MySQL crash may cause data loss.
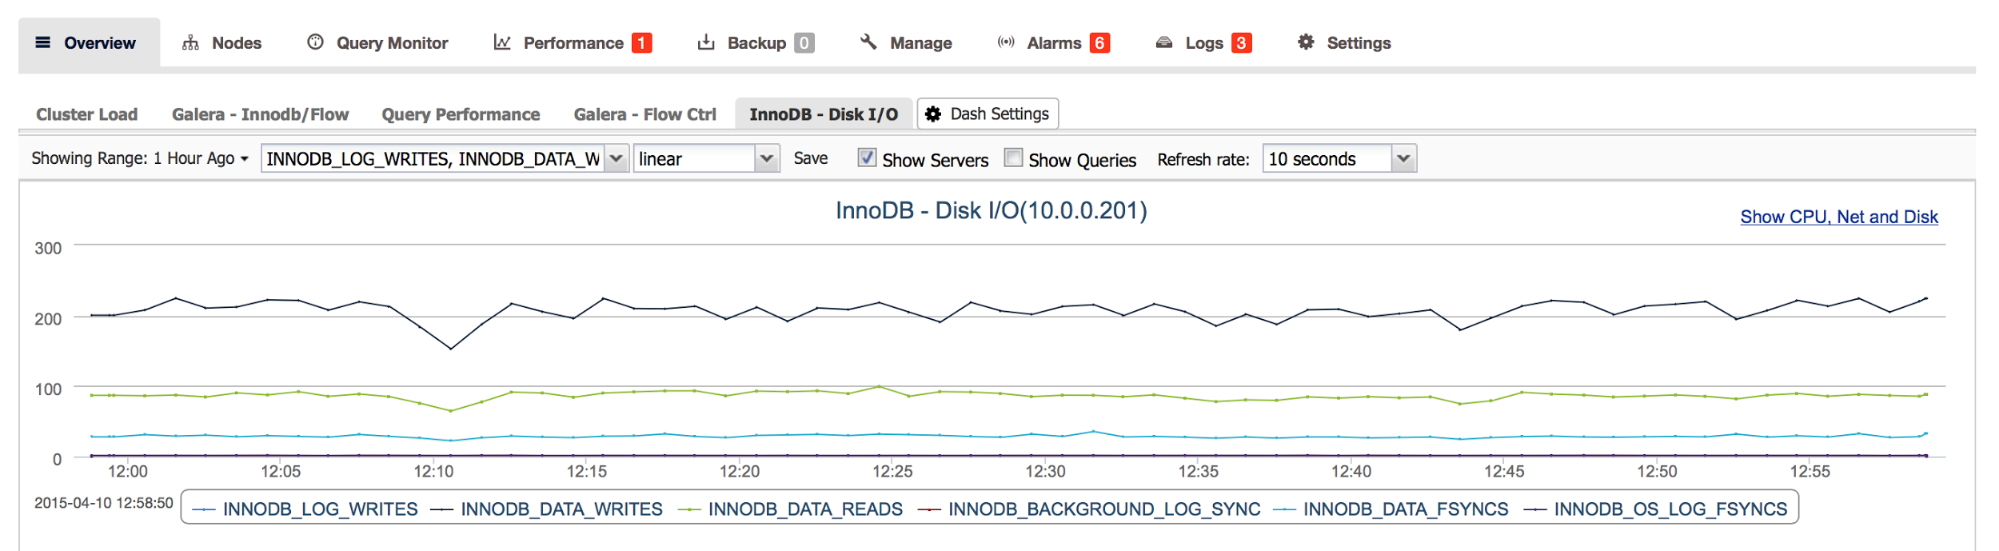
The result? Please check this screenshot. At first innodb_flush_log_at_trx_commit = 2 was used, then innodb_flush_log_at_trx_commit = 1 and finally innodb_flush_log_at_trx_commit = 0. As you can see, the difference between the most durable mode and the less safe ones is significant.
What is the InnoDB redo log? This is a file or a set of files used by InnoDB to store data about modifications before they’re pushed further to tablespaces. InnoDB performs writes in a sequential manner, starting from the first byte of the first file and ending at the last byte in the last file. After it reaches that place, the next write will hit the first byte of the first file and the whole process repeats.
Another bit that plays an important part in InnoDB’s I/O workload is the InnoDB buffer pool. It is used to cache reads but it also takes part in caching writes. If we modify the data that’s already stored in the buffer pool, such modifications are applied and the relevant pages are marked as dirty. If not all of the needed pages are in the memory, those missing pages will be read from disk and, again, marked as dirty in the buffer pool. At some later point, those changes will be flushed to tablespaces.
Both redo logs and InnoDB buffer pool work together – buffer pool stores data that was actually modified while redo logs stores information that describe the kind of modifications that were applied – this combines in-memory write cache with durable storage that allows to recreate modifications should memory be erased by a MySQL restart.
This mechanism was designed in the time when spindles ruled the world of databases. Magnetic hard disks have a well known pattern – they are nice and fast for sequential reads or writes but much worse when the access pattern is random. Pushing changes directly to InnoDB tables would be, in most cases, random access. That’s why changes are written in a sequential manner to the redo log and random writes hit the memory first (buffer pool). Then write aggregation is performed and data is pushed to tablespaces in the most efficient way possible – as sequential as it’s doable under current workload. Once data is flushed, it can be removed from both the InnoDB buffer pool and the InnoDB redo log.
Now many use solid state drives, where random writes are not that expensive. But we still have those mechanisms in place and we need to know about them in order to understand InnoDB behavior.
To sum this up, InnoDB needs I/O capacity for:
- flush modifications from buffer pool to disk (tablespaces) to make sure the InnoDB buffer pool won’t run out of space to store more dirty pages
- flush modifications from InnoDB buffer pool to make sure there’ll be enough space in the InnoDB redo log to store data about modifications
There’s still some more to it. What is described above is flushing caused by some factors like high number of the dirty pages or InnoDB error logs getting full but there’s also some more “regular” flushing. InnoDB manages it’s buffer pool as a list using a modified version of LRU algorithm. It simply means that frequently used pages stay in the buffer pool and least frequently used pages are removed from it. If such a page is a ‘dirty’ page (contains modifications), it needs to be flushed to disk before it can be discarded.
Checking dirty pages’ status
Enough theory for now, let’s see how we can monitor these mechanisms. First, check what data we have regarding buffer pool and dirty pages. There are couple of status variables. We have innodb_buffer_pool_pages_data which tells us how many pages we used in the buffer pool. We have also innodb_buffer_pool_pages_free which tells us how many free pages we have. Combined, this gives us a total size of the buffer pool. Another status counter that we have is innodb_buffer_pool_pages_dirty which tells us how many dirty buffer pool pages are stored in memory and eventually will have to be flushed. Finally, there’s a configuration variable, innodb_max_dirty_pages_pct, which defines how many dirty pages we can have compared to the buffer pool size before InnoDB starts to flush them more aggressively. By default, in MySQL 5.6 at least, it is set to 75%.
If you are using ClusterControl, you can see those values by going to the ‘Overview -> Galera – InnoDB/Flow’ graphs.
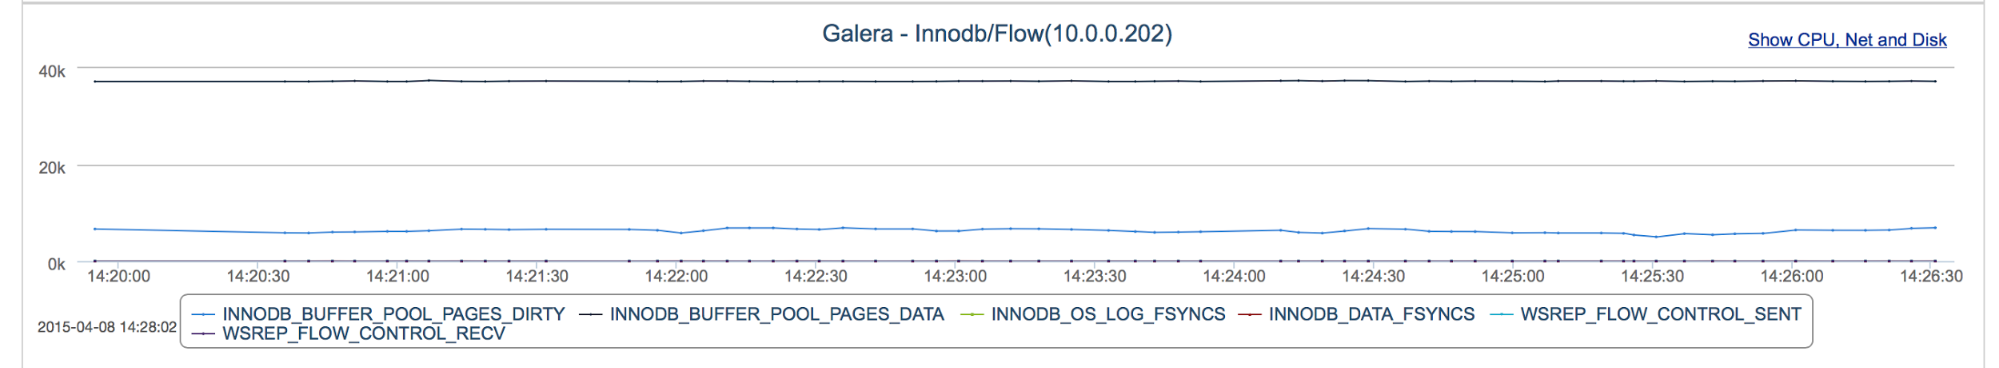
As you can see in the screenshot, we can check if the dirty pages are on a stable level and how large it is when compared to the used part of the buffer pool (which is, for probably most of the cases, same as the total size of the buffer pool – datasets tend to be larger than memory and eventually the whole buffer pool will be filled with data).
In the graph above, there’s nothing really concerning – dirty pages are on a stable level, not even close to the 75% of the total buffer pool’s size.
Checking redo logs’ status
We took a look at the state of the buffer pool, let’s now check the other side of the equation and see if we are facing any issues with InnoDB redo logs.
The main place we’ll be looking at is the output of SHOW ENGINE INNODB STATUS. It is available in ClusterControl under Performance -> InnoDB Status section. If you use Percona or MariaDB flavours of MySQL, you’ll want to look for something as below:
---
LOG
---
Log sequence number 512674741
Log flushed up to 508337304
Pages flushed up to 428250285
Last checkpoint at 427908090
Max checkpoint age 430379460
Checkpoint age target 416930102
Modified age 84424456
Checkpoint age 84766651
Interesting for us are “Checkpoint age”, which shows us how much data (in bytes) was not flushed out to tablespaces, and “Max checkpoint age” which tells us how much data can be stored in the InnoDB redo logs.
If you use vanilla MySQL from Oracle, this section will look like:
---
LOG
---
Log sequence number 17052114386863
Log flushed up to   17052114357422
Pages flushed up to 17050224411023
Last checkpoint at  17050187452119
You can still calculate the checkpoint age by subtracting ‘Log sequence number’ from the ‘Last checkpoint at’ value.
Basically, the closer checkpoint age is to the max checkpoint age, the more filled are the logs and InnoDB will be doing more I/O in order to maintain some free space in the logs. We are not going into details here – the checkpointing mechanism differs in subtle details between Percona XtraDB-based flavours, MariaDB and Oracle’s version, you can also find differences in it’s implementation between MySQL versions.
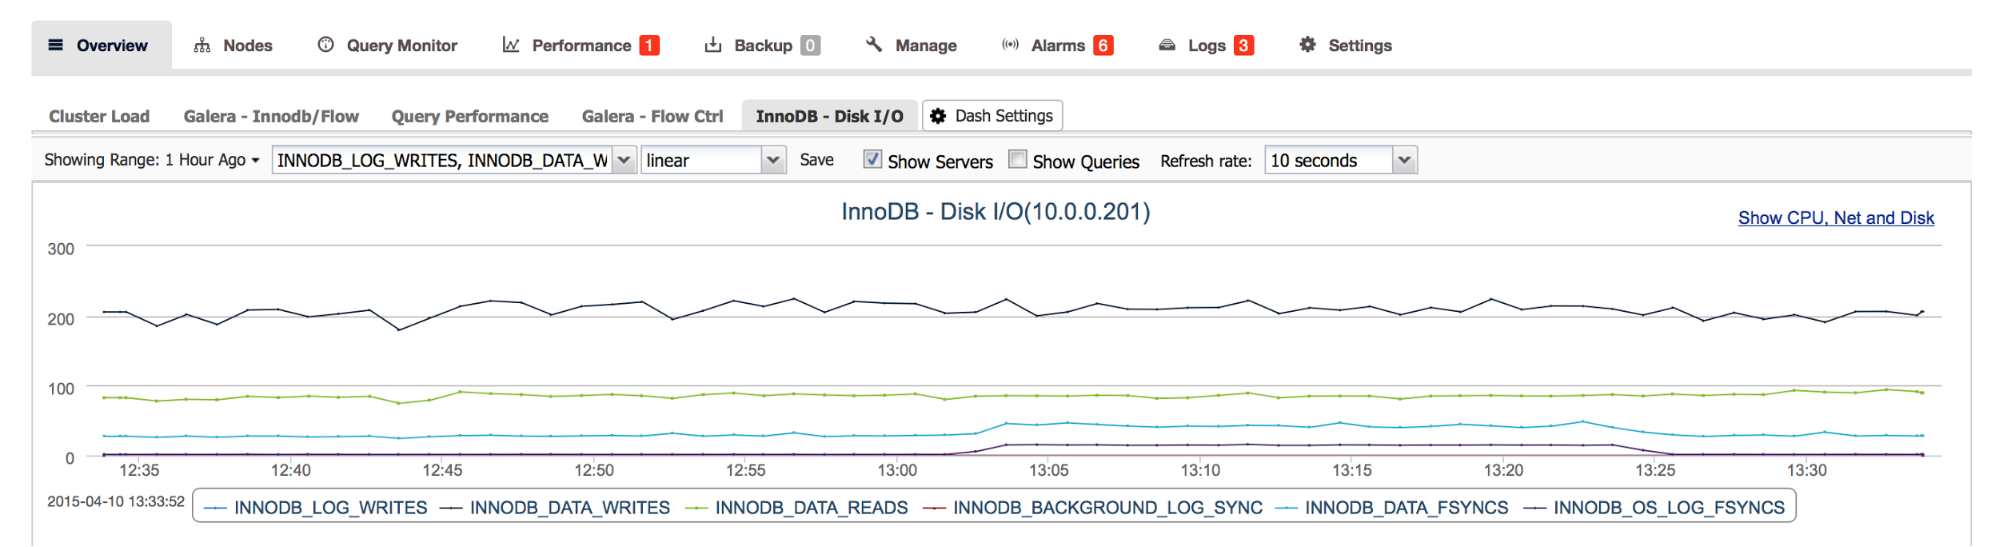
Checking InnoDB I/O activity
In ClusterControl we can check the current level of InnoDB’s I/O activity by looking at the Overview -> InnoDB Disk I/O tab. Those graphs are not really meaningful without putting them in the context of your hardware’s limitations – this is why proper benchmarking of the server before putting it into production is so important. It’s true also in the cloud – you may have an option to “buy” disk volume with some number of IOPS but at the end you have to check what’s the maximum level of performance you can get from it under your exact workload.
If you are familiar with your I/O subsystem capacity, you can derive some more information from this graph. Do I have spiky workload or is it stable? What’s the maximum number of reads and writes per second? How does it compare to my hardware capacity? Should I be concerned about my I/O subsystem getting close to being fully saturated?
What kind of flushing InnoDB does?
Another good place to look for are the status counters called innodb_buffer_pool_pages_flushed and innodb_buffer_pool_pages_lru_flushed. Reads and writes mentioned previously contain all I/O InnoDB does. It’s not only flushing but also writes to InnoDB redo log, double-write buffer and some other internal structures.
The two status counters mentioned above are showing us only the flushing part of the I/O. They are not graphed by default in ClusterControl but it is very easy to add a new graph to the Overview section:
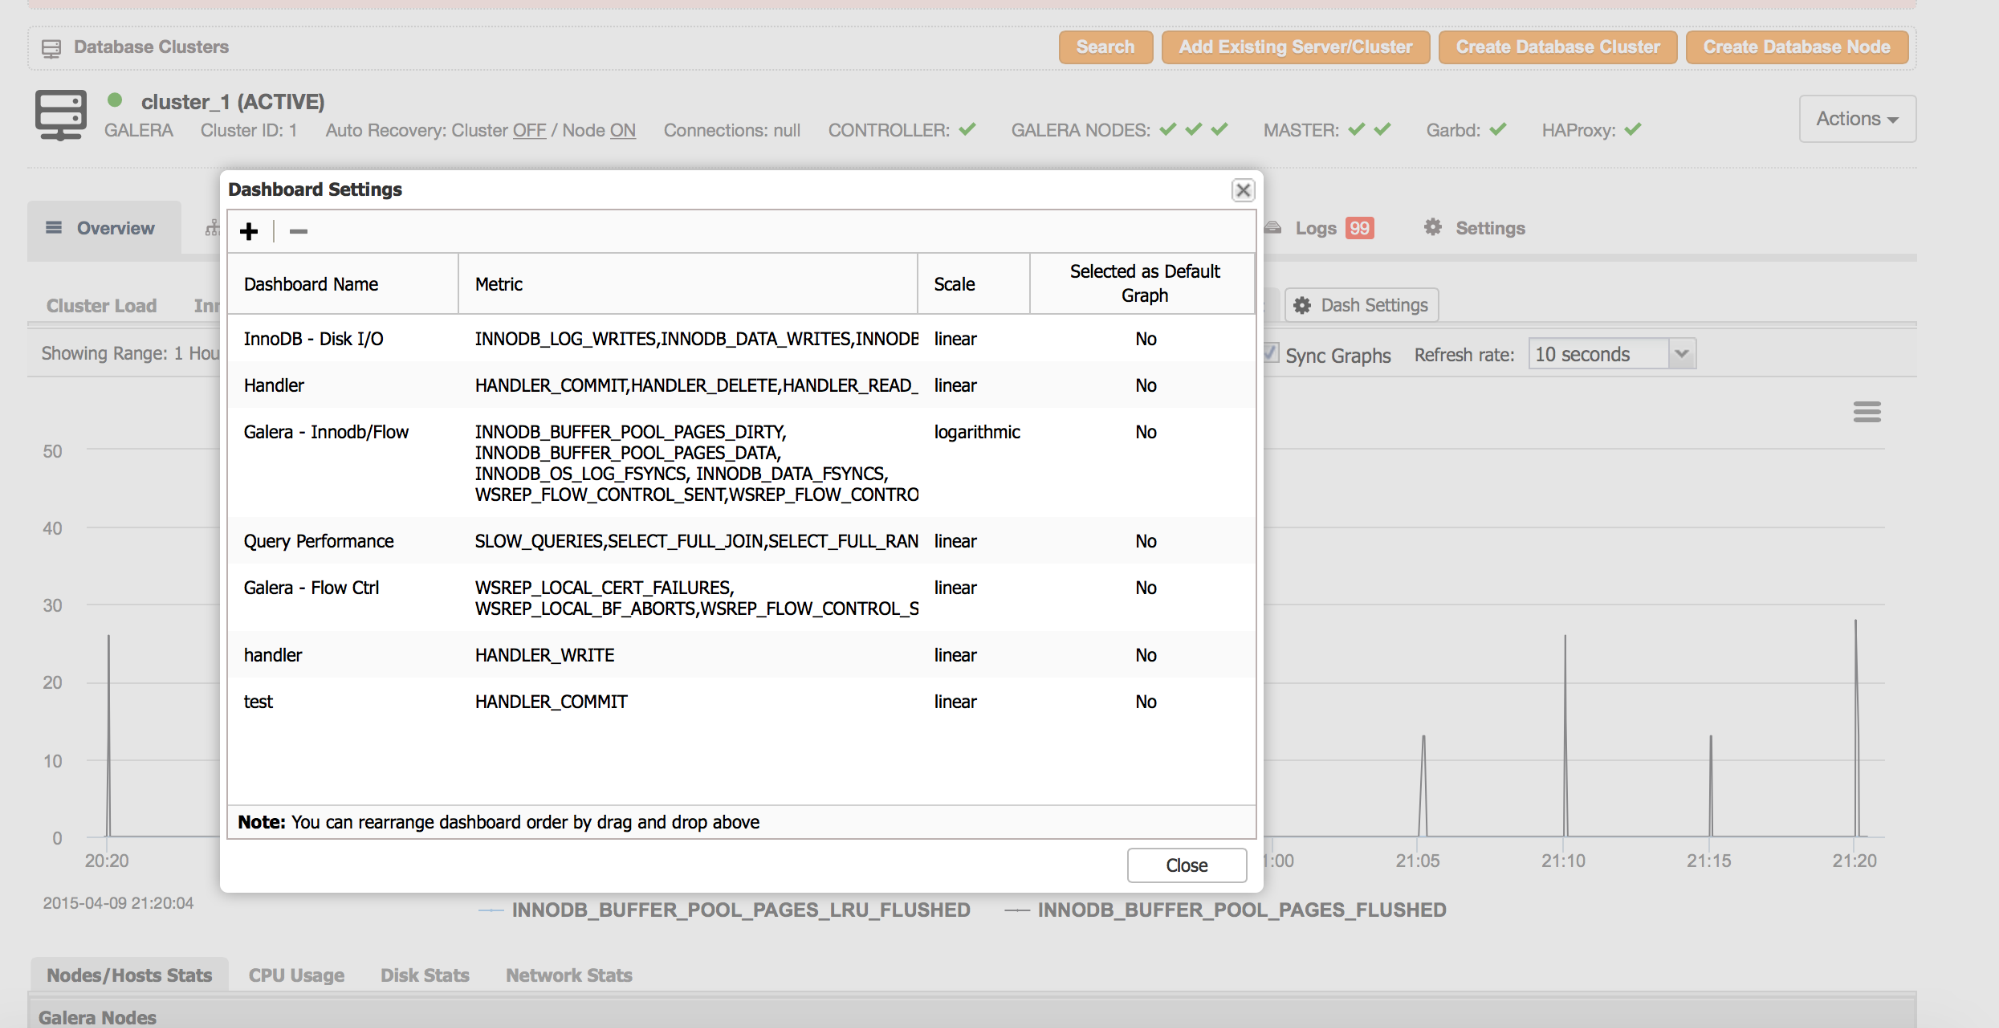
- Click on the Dashboard Settings tab
- In the dialog window that opens, click on the ‘+’ icon to add a new graph
- Fill the dashboard name
- Pick innodb_buffer_pool_pages_flushed and innodb_buffer_pool_pages_lru_flushed from the ‘Metric’ list
- Save the graph
You should see the new tab in the “Overview” section.
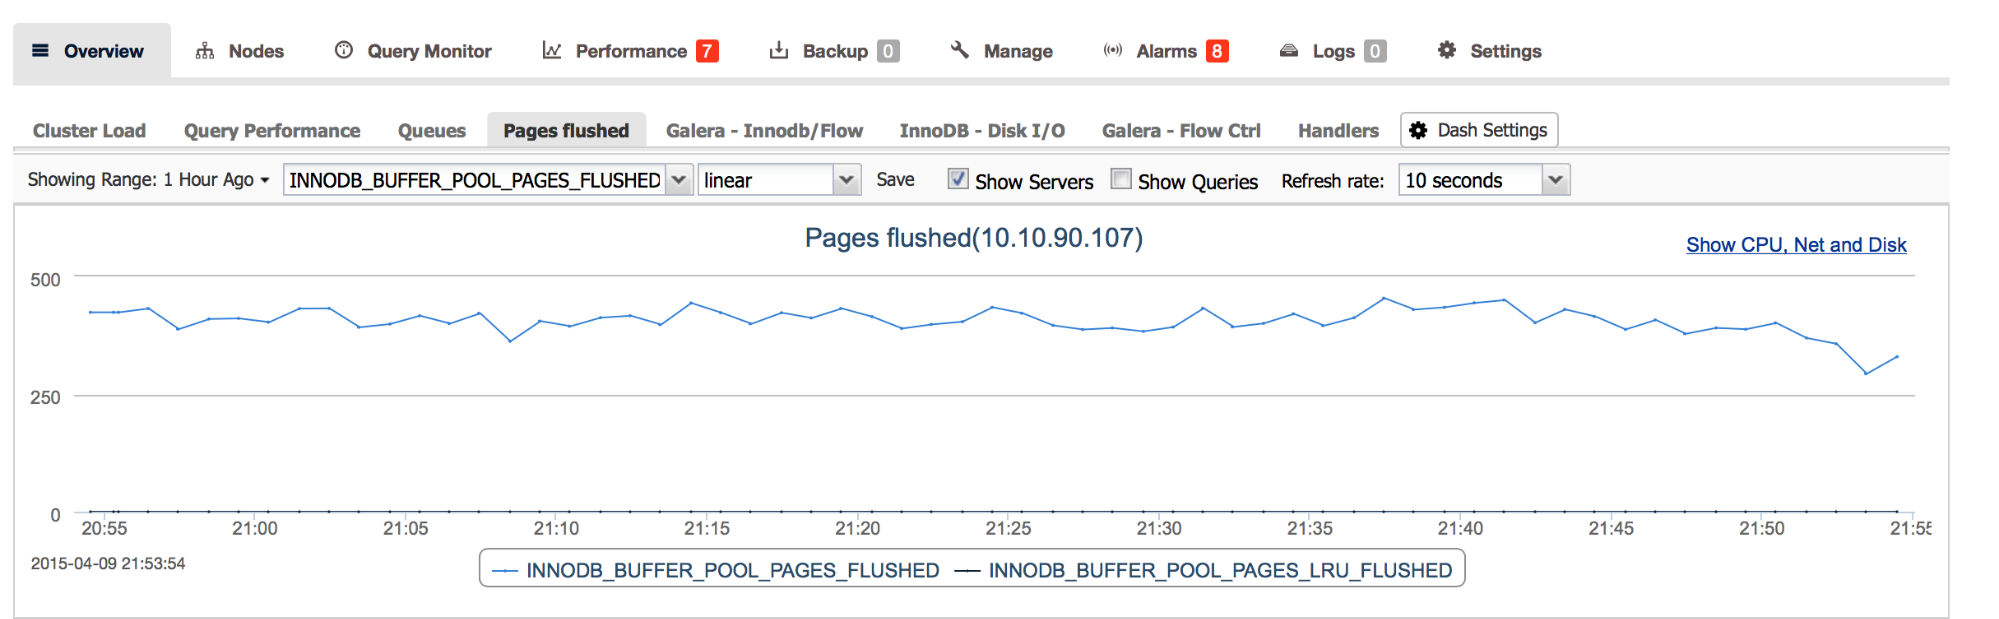
This data should help you to determine what kind of flushing is the most common under your workload. If we see mainly thousands of ‘innodb_buffer_pool_pages_flushed’ per second and the graph seems to be spiky, you may then want to create a bit of room for InnoDB by increasing InnoDB redo log’s size – this can be done by changing innodb_log_file_size.
In general, a good way to calculate redo log size is to see how much data InnoDB writes to the log. A rule of thumb is that the redo log should be able to accommodate one hour worth of writes. This should be enough data to benefit from write aggregation when redo log is flushed to the tablespaces. You can do some estimation regarding log size required by running the following SQL:
P grep "Log sequence number"
show engine innodb statusG select sleep(60) ; show engine innodb statusG
Result could look like below:
mysql> P grep "Log sequence number"
PAGER set to 'grep "Log sequence number"'
mysql> show engine innodb statusG select sleep(60) ; show engine innodb statusG
Log sequence number 18887290448024
1 row in set (0.00 sec)

1 row in set (1 min 0.00 sec)

Log sequence number 18887419437674
1 row in set (0.00 sec)
Then we need to subtract the first result from the second one:
mysql> P
Default pager wasn't set, using stdout.

mysql> select (18887419437674 - 18887290448024) * 60 / 1024/1024 as "MB/h";
+---------------+
| MB/h          |
+---------------+
| 7380.84697723 |
+---------------+
1 row in set (0.00 sec)
As a result we estimated that based on current sample from the last minute, this particular server writes 7.3GB/hour of data so we should aim at around 8GB of the total redo log size. Of course, the longer sampling time, the better approximation. We also have to take under the consideration spikyness of the workload – if there are periods of increased writes, we need to do sampling to cover them.
As stated at the beginning, we did not cover all of the details in this post – for example we did not mention InnoDB’s change buffer, we did not explain how double-write buffer works. What we did in this post is to put together some basic information about how InnoDB handles I/O traffic and what metrics are available to users to understand InnoDB’s I/O-related behavior. Hopefully it will be enough to help you find your way when handling I/O-related issues in your production MySQL environments.