blog
Monitoring Galera Cluster – Understanding and Optimizing CPU-Related InnoDB Metrics

The performance of a Galera cluster is strongly connected to the performance of MySQL. Galera only supports the InnoDB storage engine, it is therefore important to have an insight into how InnoDB operates – what metrics we can rely on and what kind of issues we might face. In this blog post, we will give you a tour of some of the InnoDB internals. Note that we covered Galera monitoring and host/OS monitoring in previous blogs.
For starters, we’d like to emphasize this is by no means comprehensive guide. Some details will not be mentioned here in this blog post – it’s a topic you can write a book about.
This post assumes MySQL 5.6, which has been GA since February 2013. In MySQL 5.6, InnoDB does a pretty good in terms of scaling on a number of CPUs. Depending on your workload, it should not come as a surprise to see 32 cores fully utilized by the database – something that was not really the case in older MySQL versions. The database is not lock-free internally and, under certain workloads, it may suffer from internal contentions. By internal contentions we mean here mutexes and latches – mechanisms which protect some part of the code, which cannot be executed in parallel by multiple threads or which protect some data structures, which in turn cannot be accessed by multiple threads at once.
Let’s take a look at some examples. The most popular latch contention that was haunting DBAs prior to version 5.6 is the infamous btr_search_latch – a latch that is protecting InnoDB Adaptive Hash Index. AHI is a data structure where InnoDB builds it’s own internal hash index and stores data about some of the most frequently used index pages. It’s all automatic and, well, adaptive – main point is to speed up some type of workload (index-based lookups, small number of rows involved). The main problem with an Adaptive Hash Index is that the access to it has to be serialized to maintain data consistency. Under small to medium workload it should not be a problem but while under high concurrent workload, the latch that protects AHI was known to limit the server’s performance. Pretty often, users disabled this feature altogether to get more scalability. This was actually fixed in MySQL 5.6 with the introduction of multiple Adaptive Hash Indexes where the AHI is split across several partitions, each protected by it’s own latch. Thanks to that, contention is splitted across multiple partitions and as a result, InnoDB’s ability to execute concurrent queries increased significantly.
As for mutexes, the best known was most probably InnoDB’s kernel_mutex, which was a nightmare for DBA’s managing MySQL up to 5.5. This global kernel mutex was used to protect the main points in the code like getting transaction lists, locking rows etc. The problem was that it was also used in some less important parts of the code. Therefore, under higher concurrency, it was severely limiting MySQL performance. In MySQL 5.6 kernel_mutex was replaced by new mutexes and rw-locks, which allowed this version to scale properly.
Even though some of the largest latch or mutex-related issues were fixed in MySQL 5.6, it is still possible to be affected by InnoDB’s internal contention. Let’s see where we can learn about it.
If you are using Percona XtraDB Cluster or MariaDB Cluster, you will have access to certain status counters inside MySQL that are not available in vanilla MySQL. The below is a screenshot from ClusterControl (‘Performance’ tab -> ‘DB Status’), filter on variables containing the string ‘waits’.
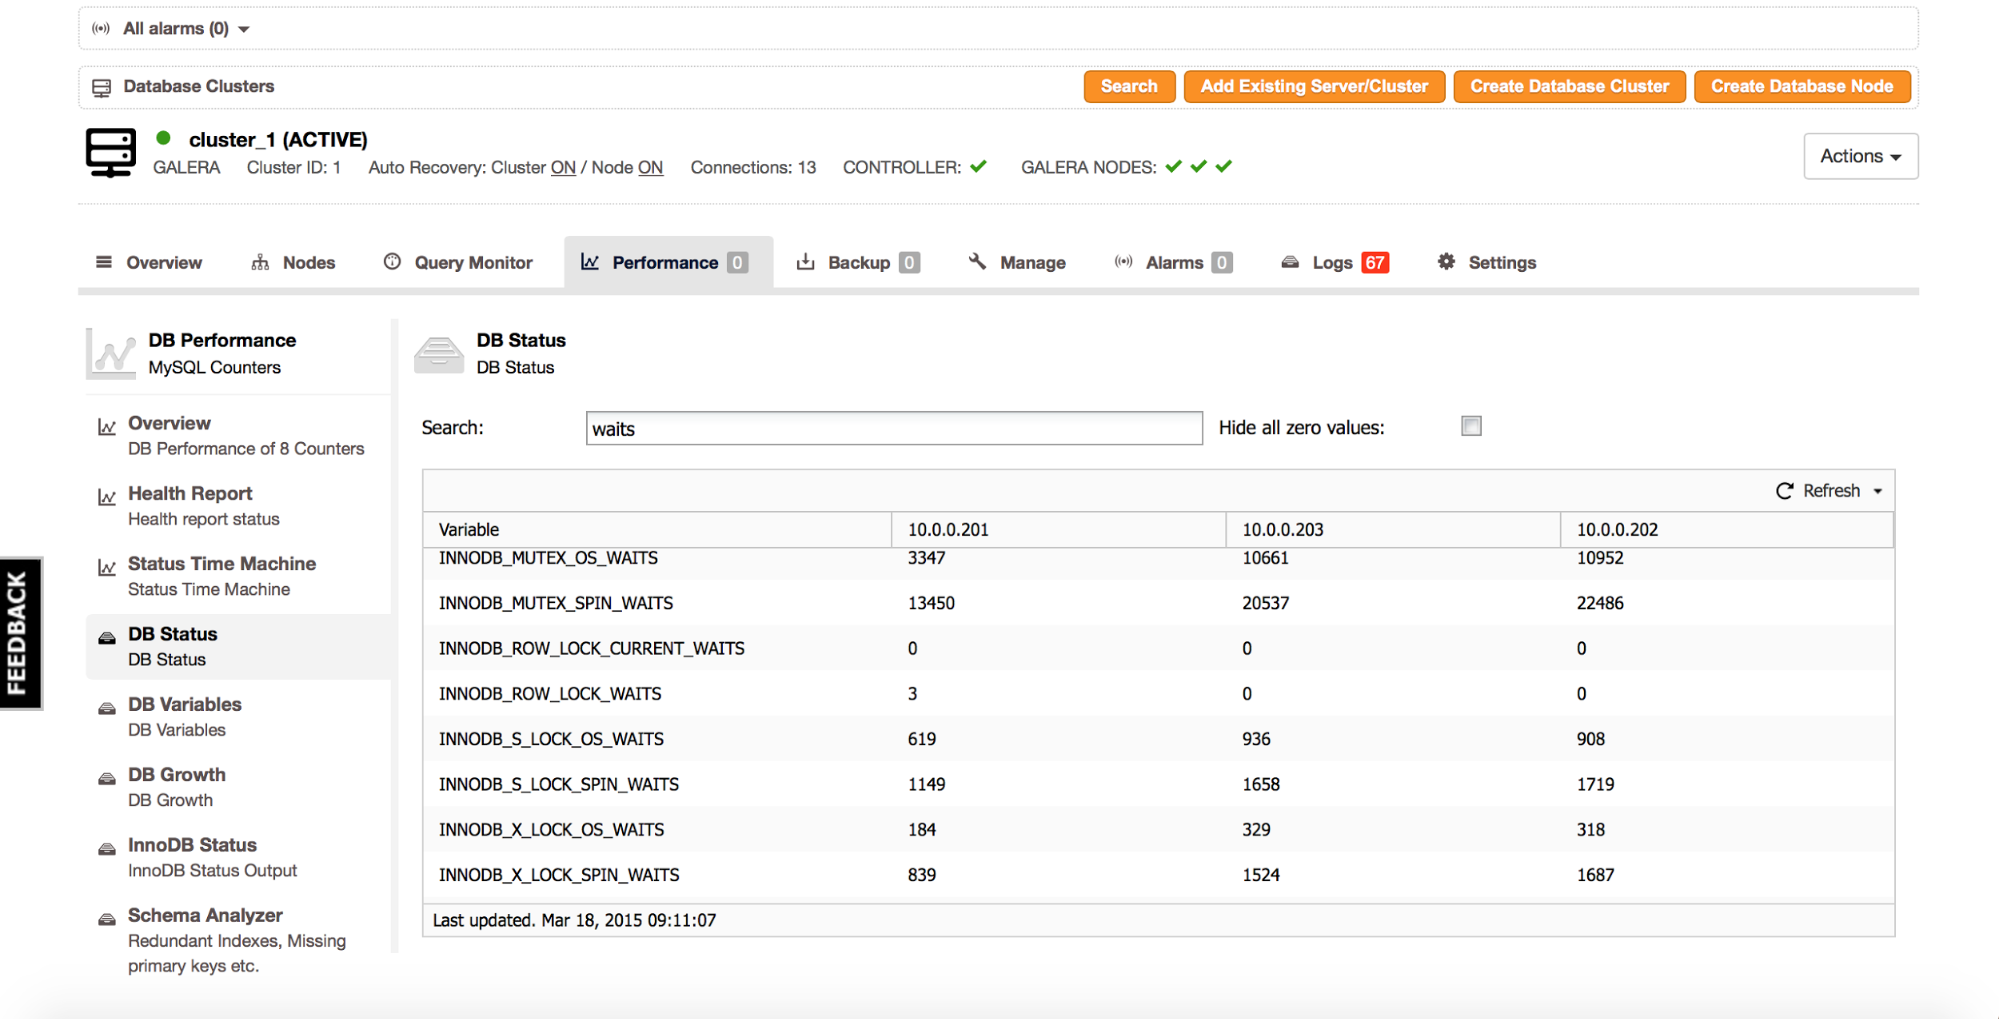
Interesting parts are ‘innodb_mutex_%’, ‘innodb_s_lock_%’ and ‘innodb_x_lock_%’ variables. We have here two main ‘categories’ of the internal locks:
- Mutex – it contains data about mutexes.
- Counters named ‘innodb_s_lock_%’ and ‘innodb_x_lock_%’ shows us the data about semaphores which lock and therefore protect latches.
Locks can be either shared (s_lock) or exclusive (x_lock). Concept is similar to row-level locking.
Sometimes a data structure can be read by multiple threads in parallel, each thread gets a s_lock on it. Sometimes you need to modify data in the data structure, then you have to take an exclusive lock, to make sure no other part of InnoDB will modify it or even read from it while it’s being modified.
For each of those locks (shared or exclusive locks on latches and mutex-related locks) we have two types of waits – os_waits and spin_waits. What’s the difference? Well, at first InnoDB tries to resolve a conflict on it’s own. For a number of times (defined in innodb_sync_spin_loops variable), a thread will spin in a loop trying to acquire a mutex. The spin waits counter keeps track of the number of times the thread has looped. If it was not possible to acquire a lock within a defined number of loops, InnoDB yields the thread to the operating system. At this time, the os_waits counter is increased. Spinning inside InnoDB is fast – the thread is still active, it just enters a loop. As a result, though, such threads burn CPU doing nothing useful – this is not ideal for a long time, therefore the innodb_sync_spin_loops variable which limits the time a thread can stay in such a loop. Os wait, on the other hand, is related to a context switch – a given thread is paused and another process can utilize the CPU while the first one waits until contention is resolved. The problem is that the context switch is an expensive process – it uses some of the system CPU to execute. As long as the frequency of context switches is low, that’s not a big deal but if InnoDB suffers from large internal contention and multiple threads are switching back and forth between InnoDB and the OS, it may seriously increase system CPU utilization.
It’s hard to tell what exact numbers are good or bad – it’s more about answering the question – do waits (and which ones) affect throughput? You can check it, at least partially, by looking into SHOW ENGINE INNODB STATUS output – it is available in ClusterControl under ‘Performance’ -> ‘InnoDB Status’.
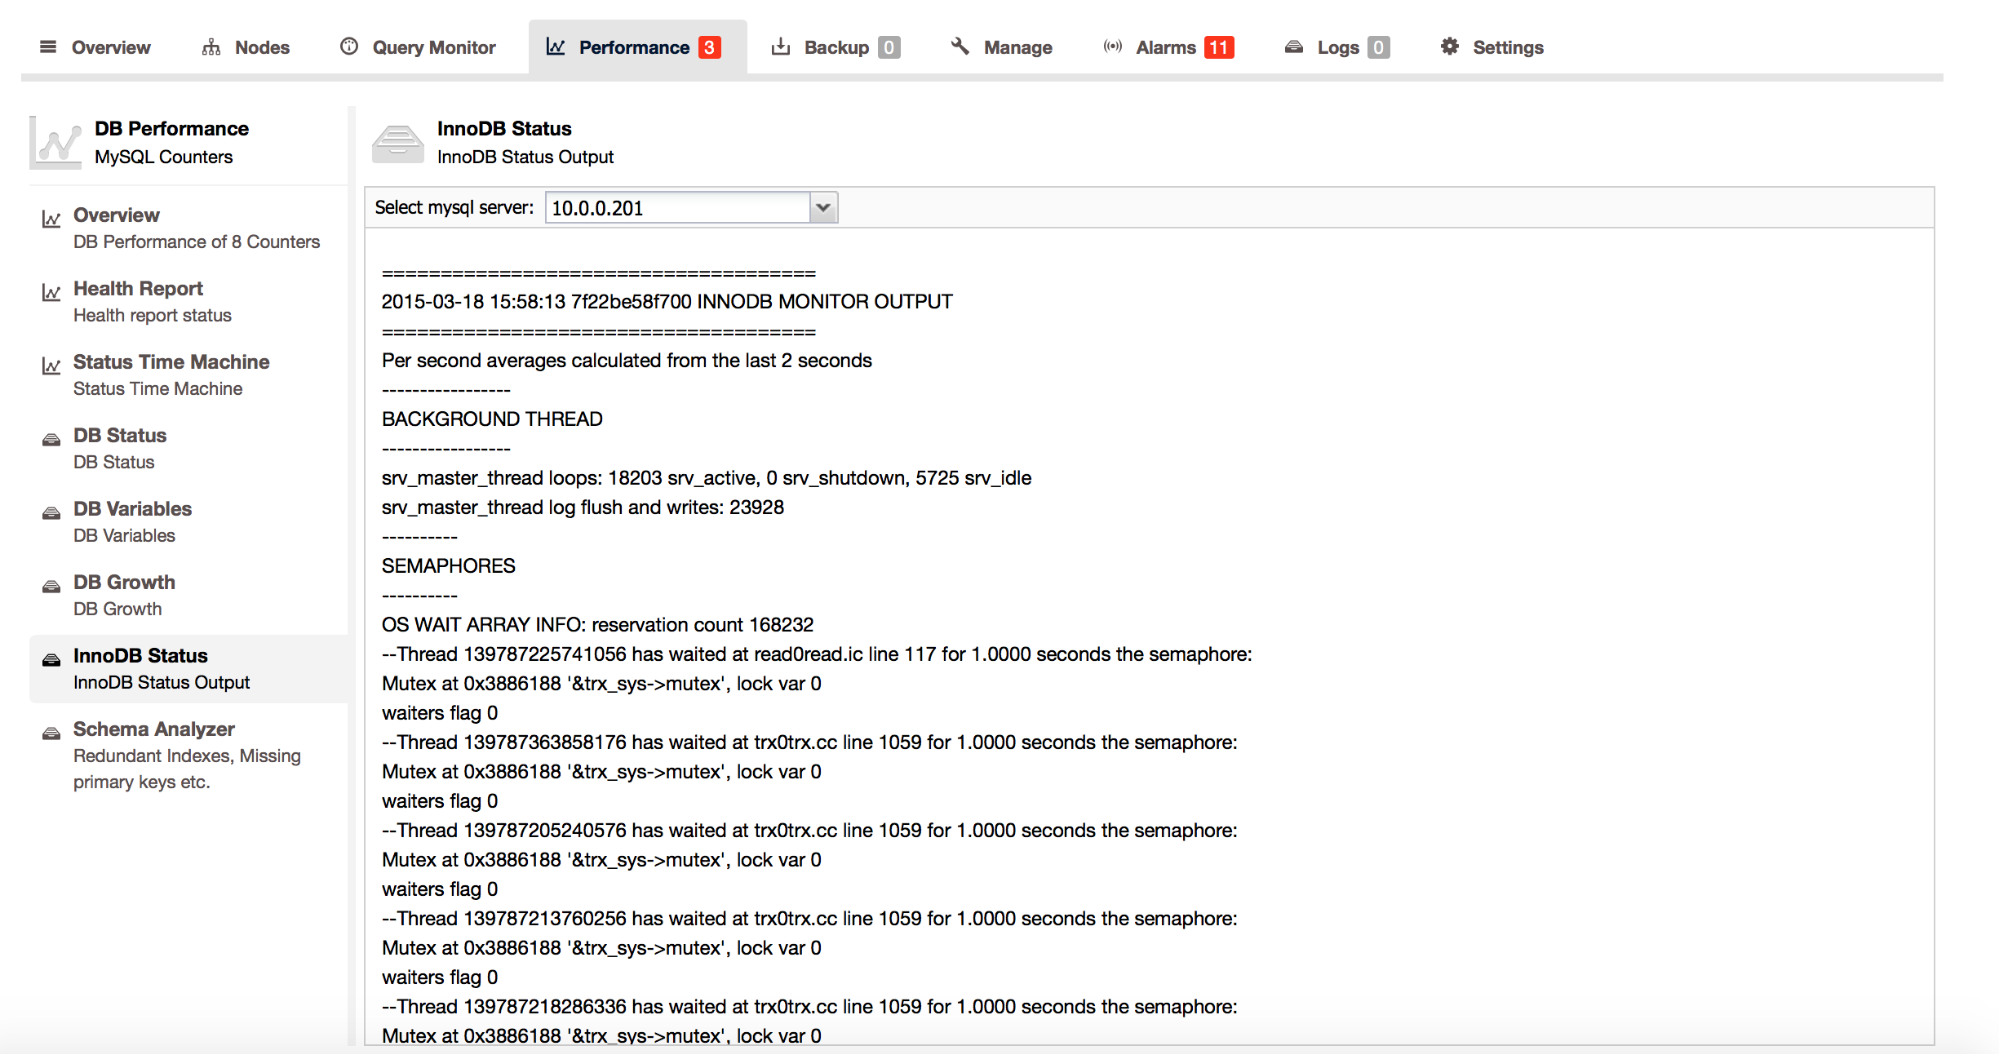
If there is some problem with locking contention, you’ll find it in the ‘SEMAPHORES’ section. For those who do not have status variables that we mentioned earlier (i.e., if you do not use MariaDB or Percona Server, but use the vanilla MySQL from Oracle), you can find those counters here. Let’s take a look at the example below to see what we can tell:
----------
SEMAPHORES
----------
OS WAIT ARRAY INFO: reservation count 151641
--Thread 139787423938304 has waited at buf0flu.cc line 724 for 0.0000 seconds the semaphore:
Mutex at 0x2893158 '&buf_pool->flush_state_mutex', lock var 1
waiters flag 1
--Thread 139787217753856 has waited at trx0sys.ic line 103 for 0.0000 seconds the semaphore:
X-lock (wait_ex) on RW-latch at 0x7f22ce9ff340 '&block->lock'
a writer (thread id 139787217753856) has reserved it in mode  wait exclusive
number of readers 1, waiters flag 0, lock_word: ffffffffffffffff
Last time read locked in file buf0flu.cc line 1078
Last time write locked in file /mnt/workspace/percona-xtradb-cluster-5.6-debian-binary-bzr/label_exp/ubuntu-trusty-64bit/percona-xtradb-cluster-5.6-5.6.22-25.8/storage/innobase/incl
ude/trx0sys.ic line 103
--Thread 139787199383296 has waited at trx0trx.cc line 1059 for 0.0000 seconds the semaphore:
Mutex at 0x3886188 '&trx_sys->mutex', lock var 1
waiters flag 1
--Thread 139787223877376 has waited at trx0trx.cc line 1059 for 0.0000 seconds the semaphore:
Mutex at 0x3886188 '&trx_sys->mutex', lock var 1
waiters flag 1
--Thread 139787212162816 has waited at trx0trx.cc line 1059 for 0.0000 seconds the semaphore:
Mutex at 0x3886188 '&trx_sys->mutex', lock var 1
waiters flag 1
--Thread 139787218818816 has waited at trx0trx.cc line 1059 for 0.0000 seconds the semaphore:
Mutex at 0x3886188 '&trx_sys->mutex', lock var 1
waiters flag 1
What we see here are three types of issues. First:
--Thread 139787423938304 has waited at buf0flu.cc line 724 for 0.0000 seconds the semaphore:
Mutex at 0x2893158 '&buf_pool->flush_state_mutex', lock var 1
waiters flag 1
A thread was waiting to acquire mutex to perform state change on dirty blocks.
Second:
--Thread 139787217753856 has waited at trx0sys.ic line 103 for 0.0000 seconds the semaphore:
X-lock (wait_ex) on RW-latch at 0x7f22ce9ff340 '&block->lock'
a writer (thread id 139787217753856) has reserved it in mode  wait exclusive
number of readers 1, waiters flag 0, lock_word: ffffffffffffffff
Last time read locked in file buf0flu.cc line 1078
Last time write locked in file /mnt/workspace/percona-xtradb-cluster-5.6-debian-binary-bzr/label_exp/ubuntu-trusty-64bit/percona-xtradb-cluster-5.6-5.6.22-25.8/storage/innobase/incl
ude/trx0sys.ic line 103
We can see here an exclusive lock on a page in “transaction system header”.
Third – multiple issues related to:
--Thread 139787199383296 has waited at trx0trx.cc line 1059 for 0.0000 seconds the semaphore:
Mutex at 0x3886188 '&trx_sys->mutex', lock var 1
waiters flag 1
It’s a contention around ‘&trx_sys->mutex‘ which covers, for example, transaction commits.
As you can see, we got some nice information on how long the thread had to wait for a given mutex and, for those who are not afraid of C and C++, there’s information about the place in the MySQL source code where the contention took place. It’s not necessary to know MySQL code by heart to get some value out of it – code is well-documented and pretty often a function name will be enough to shed some light on the culprit of the contention.
One more way to check what kind of contention is impacting MySQL workload is to check the output of a ‘SHOW ENGINE INNODB MUTEX‘ executed from the MySQL command line client.
mysql> SHOW ENGINE INNODB MUTEX;
+--------+------------------------------+----------------+
| Type   | Name                         | Status         |
+--------+------------------------------+----------------+
| InnoDB | &trx_sys->mutex              | os_waits=19963 |
| InnoDB | &log_sys->mutex              | os_waits=7     |
| InnoDB | &buf_pool->flush_state_mutex | os_waits=1087  |
| InnoDB | &fil_system->mutex           | os_waits=29    |
| InnoDB | combined &block->mutex       | os_waits=3929  |
| InnoDB | &log_sys->checkpoint_lock    | os_waits=1573  |
| InnoDB | &btr_search_latch_arr[i]     | os_waits=18266 |
| InnoDB | combined &block->lock        | os_waits=240   |
+--------+------------------------------+----------------+
8 rows in set (0.00 sec)
This pattern is related to a highly concurrent, read only workload. We can see that the main points of contention are ‘trx_sys->mutex’ and ‘&btr_search_latch_arr[i]’.
Now that we know what is causing issues, the next question will be – what we can do about it? As we mentioned before, it’s not easy to tell at which point such contention becomes a real issue. It’s good to look at this data from time to time, especially if you are facing issues related to spiky workloads and transient ‘hang-ups’ in database performance.
It’s not always possible to avoid or eliminate contentions that we described in this blog post. Some of them can be eliminated by configuration changes, for example increasing the number of instances of the adaptive hash index or increasing the number of instances of the InnoDB buffer pool. Sometimes you can completely disable problematic parts of MySQL like InnoDB’s adaptive hash index or query cache (which is also protected by a mutex). Sometimes all you can do is to accept this limitation. Even then, it is worth knowing what kind of limitations you are facing – maybe it is possible to change the workload pattern a bit to go around known problems or, if workaround is not feasible, it is still good to know what we are facing – perhaps future MySQL versions will bring some optimizations in this area and it would be worth upgrading.
If you’re interested in learning more about what to monitor in your Galera Cluster for MySQL/MariaDB, you might be interested in joining us for this new webinar “Deep dive into how to monitor Galera Cluster” on April 21st. This will be a more ‘hands-on’ session, and we’ll show you what metrics to monitor and how to identify issues with your MySQL/MariaDB database nodes.