blog
A Guide to MySQL Galera Cluster Streaming Replication: Part Two

In the first part of this blog we provided an overview of the new Streaming Replication feature in MySQL Galera Cluster. In this blog we will show you how to enable it and take a look at the results.
Enabling Streaming Replication
It is highly recommended that you enable Streaming Replication at a session-level for the specific transactions that interact with your application/client.
As stated in the previous blog, Galera logs its write-sets to the wsrep_streaming_log table in MySQL database. This has the potential to create a performance bottleneck, especially when a rollback is needed. This doesn’t mean that you can’t use Streaming Replication, it just means you need to design your application client efficiently when using Streaming Replication so you’ll get better performance. Still, it’s best to have Streaming Replication for dealing with and cutting down large transactions.
Enabling Streaming Replication requires you to define the replication unit and number of units to use in forming the transaction fragments. Two parameters control these variables: wsrep_trx_fragment_unit and wsrep_trx_fragment_size.
Below is an example of how to set these two parameters:
SET SESSION wsrep_trx_fragment_unit='statements';

SET SESSION wsrep_trx_fragment_size=3;
In this example, the fragment is set to three statements. For every three statements from a transaction, the node will generate, replicate, and certify a fragment.
You can choose between a few replication units when forming fragments:
- bytes – This defines the fragment size in bytes.
- rows – This defines the fragment size as the number of rows the fragment updates.
- statements – This defines the fragment size as the number of statements in a fragment.
Choose the replication unit and fragment size that best suits the specific operation you want to run.
Streaming Replication In Action
As discussed in our other blog on handling large transactions in Mariadb 10.4, we performed and tested how Streaming Replication performed when enabled based on this criteria…
- Baseline, set global wsrep_trx_fragment_size=0;
- set global wsrep_trx_fragment_unit=’rows’; set global wsrep_trx_fragment_size=1
- set global wsrep_trx_fragment_unit=’statements’; set global wsrep_trx_fragment_size=1
- set global wsrep_trx_fragment_unit=’statements’; set global wsrep_trx_fragment_size=5;
- set global wsrep_trx_fragment_unit=’statements’; set global wsrep_trx_fragment_size=1
And results are
Transactions: 82.91 per sec., queries: 1658.27 per sec. (100%)

Transactions: 54.72 per sec., queries: 1094.43 per sec. (66%)

Transactions: 54.76 per sec., queries: 1095.18 per sec. (66%)

Transactions: 70.93 per sec., queries: 1418.55 per sec. (86%)
For this example we’re using Percona XtraDB Cluster 8.0.15 straight from their testing branch using the Percona-XtraDB-Cluster_8.0.15.5-27dev.4.2_Linux.x86_64.ssl102.tar.gz build.
We then tried a 3-node Galera cluster with hosts info below:
testnode11 = 192.168.10.110

testnode12 = 192.168.10.120

testnode13 = 192.168.10.130
We pre-populated a table from my sysbench database and tried to delete a very large rows.
root@testnode11[sbtest]#> select count(*) from sbtest1;

+----------+

| count(*) |

+----------+

| 12608218 |

+----------+

1 row in set (25.55 sec)
At first, running without Streaming Replication,
root@testnode12[sbtest]#> select @@wsrep_trx_fragment_unit, @@wsrep_trx_fragment_size,  @@innodb_lock_wait_timeout;

+---------------------------+---------------------------+----------------------------+

| @@wsrep_trx_fragment_unit | @@wsrep_trx_fragment_size | @@innodb_lock_wait_timeout |

+---------------------------+---------------------------+----------------------------+

| bytes                     | 0 |                         50000 |

+---------------------------+---------------------------+----------------------------+

1 row in set (0.00 sec)
Then run,
root@testnode11[sbtest]#> delete from sbtest1 where id >= 2000000;However, we ended up getting a rollback…
---TRANSACTION 648910, ACTIVE 573 sec rollback

mysql tables in use 1, locked 1

ROLLING BACK 164858 lock struct(s), heap size 18637008, 12199395 row lock(s), undo log entries 11961589

MySQL thread id 183, OS thread handle 140041167468288, query id 79286 localhost 127.0.0.1 root wsrep: replicating and certifying write set(-1)

delete from sbtest1 where id >= 2000000
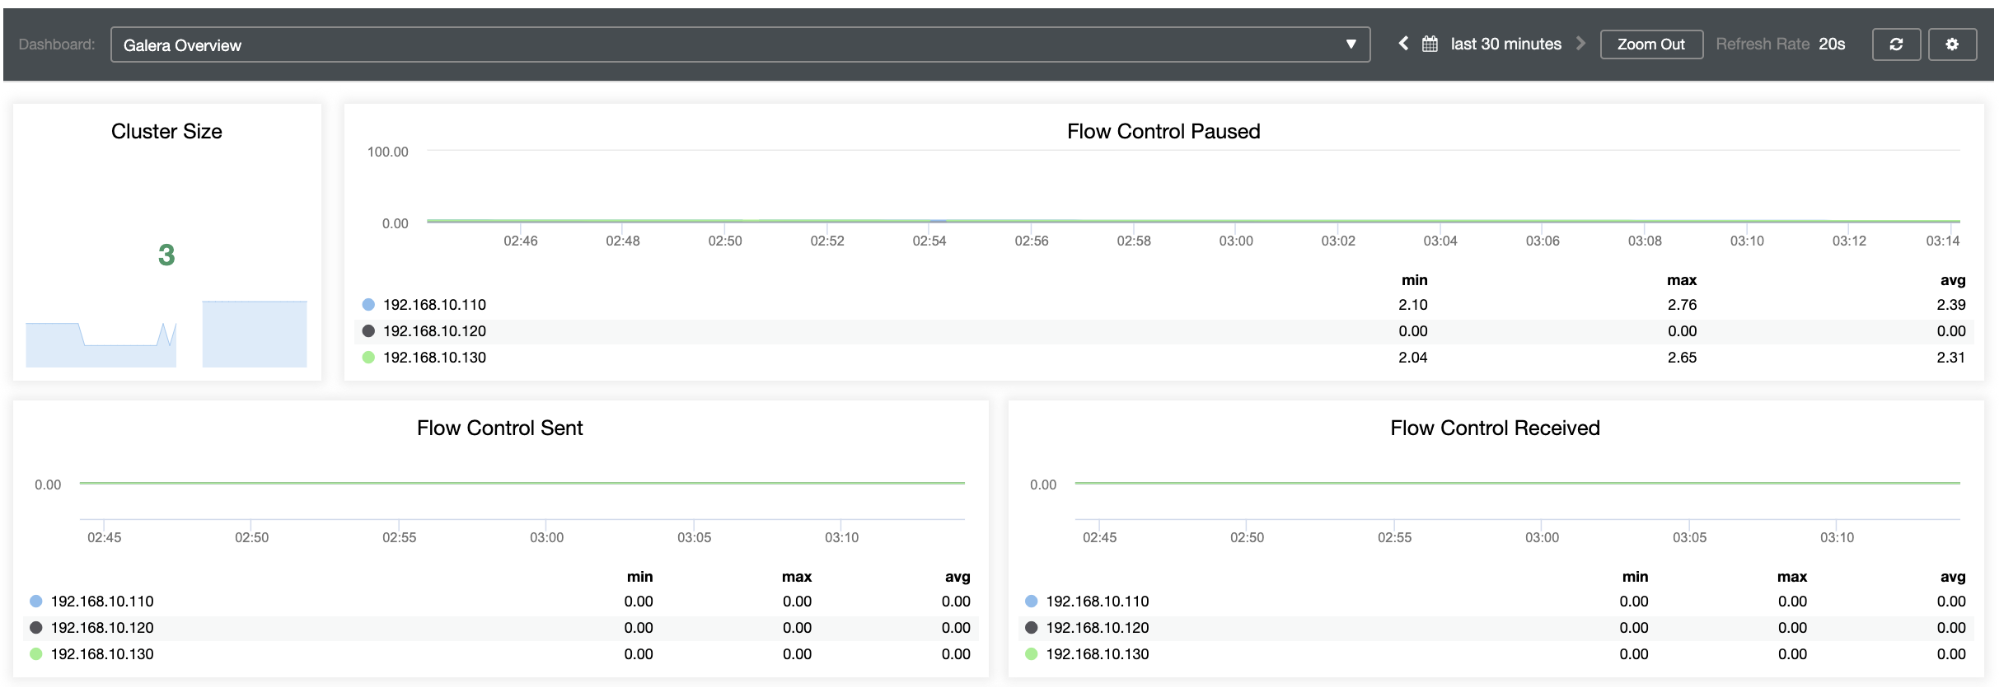
Using ClusterControl Dashboards to gather an overview of any indication of flow control, since the transaction runs solely on the master (active-writer) node until commit time, there’s no any indication of activity for flow control:

In case you’re wondering, the current version of ClusterControl does not yet have direct support for PXC 8.0 with Galera Cluster 4 (as it is still experimental). You can, however, try to import it… but it needs minor tweaks to make your Dashboards work correctly.
Back to the query process. It failed as it rolled back!
root@testnode11[sbtest]#> delete from sbtest1 where id >= 2000000;

ERROR 1180 (HY000): Got error 5 - 'Transaction size exceed set threshold' during COMMIT
regardless of the wsrep_max_ws_rows or wsrep_max_ws_size,
root@testnode11[sbtest]#> select @@global.wsrep_max_ws_rows, @@global.wsrep_max_ws_size/(1024*1024*1024);

+----------------------------+---------------------------------------------+

| @@global.wsrep_max_ws_rows | @@global.wsrep_max_ws_size/(1024*1024*1024) |

+----------------------------+---------------------------------------------+

|                          0 |               2.0000 |

+----------------------------+---------------------------------------------+

1 row in set (0.00 sec)
It did, eventually, reach the threshold.
During this time the system table mysql.wsrep_streaming_log is empty, which indicates that Streaming Replication is not happening or enabled,
root@testnode12[sbtest]#> select count(*) from mysql.wsrep_streaming_log;

+----------+

| count(*) |

+----------+

|        0 |

+----------+

1 row in set (0.01 sec)


root@testnode13[sbtest]#> select count(*) from mysql.wsrep_streaming_log;

+----------+

| count(*) |

+----------+

|        0 |

+----------+

1 row in set (0.00 sec)
and that is verified on the other 2 nodes (testnode12 and testnode13).
Now, let’s try enabling it with Streaming Replication,
root@testnode11[sbtest]#> select @@wsrep_trx_fragment_unit, @@wsrep_trx_fragment_size, @@innodb_lock_wait_timeout;

+---------------------------+---------------------------+----------------------------+

| @@wsrep_trx_fragment_unit | @@wsrep_trx_fragment_size | @@innodb_lock_wait_timeout |

+---------------------------+---------------------------+----------------------------+

| bytes                     | 0 |                      50000 |

+---------------------------+---------------------------+----------------------------+

1 row in set (0.00 sec)


root@testnode11[sbtest]#> set wsrep_trx_fragment_unit='rows'; set wsrep_trx_fragment_size=100;

Query OK, 0 rows affected (0.00 sec)


Query OK, 0 rows affected (0.00 sec)


root@testnode11[sbtest]#> select @@wsrep_trx_fragment_unit, @@wsrep_trx_fragment_size, @@innodb_lock_wait_timeout;

+---------------------------+---------------------------+----------------------------+

| @@wsrep_trx_fragment_unit | @@wsrep_trx_fragment_size | @@innodb_lock_wait_timeout |

+---------------------------+---------------------------+----------------------------+

| rows                      | 100 |                      50000 |

+---------------------------+---------------------------+----------------------------+

1 row in set (0.00 sec)
What to Expect When Galera Cluster Streaming Replication is Enabled?
When query has been performed in testnode11,
root@testnode11[sbtest]#> delete from sbtest1 where id >= 2000000;What happens is that it fragments the transaction piece by piece depending on the set value of variable wsrep_trx_fragment_size. Let’s check this in the other nodes:
Host testnode12
root@testnode12[sbtest]#> pager sed -n '/TRANSACTIONS/,/FILE I/O/p'; show engine innodb statusG nopager; show global status like 'wsrep%flow%'; select count(*) from mysql.wsrep_streaming_log;

PAGER set to 'sed -n '/TRANSACTIONS/,/FILE I/O/p''

TRANSACTIONS

------------

Trx id counter 567148

Purge done for trx's n:o < 566636 undo n:o < 0 state: running but idle

History list length 44

LIST OF TRANSACTIONS FOR EACH SESSION:

..

...

---TRANSACTION 421740651985200, not started

0 lock struct(s), heap size 1136, 0 row lock(s)

---TRANSACTION 553661, ACTIVE 190 sec

18393 lock struct(s), heap size 2089168, 1342600 row lock(s), undo log entries 1342600

MySQL thread id 898, OS thread handle 140266050008832, query id 216824 wsrep: applied write set (-1)

--------

FILE I/O

1 row in set (0.08 sec)


PAGER set to stdout

+----------------------------------+--------------+

| Variable_name                    | Value |

+----------------------------------+--------------+

| wsrep_flow_control_paused_ns     | 211197844753 |

| wsrep_flow_control_paused        | 0.133786 |

| wsrep_flow_control_sent          | 633 |

| wsrep_flow_control_recv          | 878 |

| wsrep_flow_control_interval      | [ 173, 173 ] |

| wsrep_flow_control_interval_low  | 173 |

| wsrep_flow_control_interval_high | 173          |

| wsrep_flow_control_status        | OFF |

+----------------------------------+--------------+

8 rows in set (0.00 sec)


+----------+

| count(*) |

+----------+

|    13429 |

+----------+

1 row in set (0.04 sec)
Host testnode13
root@testnode13[sbtest]#> pager sed -n '/TRANSACTIONS/,/FILE I/O/p'; show engine innodb statusG nopager; show global status like 'wsrep%flow%'; select count(*) from mysql.wsrep_streaming_log;

PAGER set to 'sed -n '/TRANSACTIONS/,/FILE I/O/p''

TRANSACTIONS

------------

Trx id counter 568523

Purge done for trx's n:o < 567824 undo n:o < 0 state: running but idle

History list length 23

LIST OF TRANSACTIONS FOR EACH SESSION:

..

...

---TRANSACTION 552701, ACTIVE 216 sec

21587 lock struct(s), heap size 2449616, 1575700 row lock(s), undo log entries 1575700

MySQL thread id 936, OS thread handle 140188019226368, query id 600980 wsrep: applied write set (-1)

--------

FILE I/O

1 row in set (0.28 sec)


PAGER set to stdout

+----------------------------------+--------------+

| Variable_name                    | Value |

+----------------------------------+--------------+

| wsrep_flow_control_paused_ns     | 210755642443 |

| wsrep_flow_control_paused        | 0.0231273 |

| wsrep_flow_control_sent          | 1653 |

| wsrep_flow_control_recv          | 3857 |

| wsrep_flow_control_interval      | [ 173, 173 ] |

| wsrep_flow_control_interval_low  | 173 |

| wsrep_flow_control_interval_high | 173          |

| wsrep_flow_control_status        | OFF |

+----------------------------------+--------------+

8 rows in set (0.01 sec)


+----------+

| count(*) |

+----------+

|    15758 |

+----------+

1 row in set (0.03 sec)
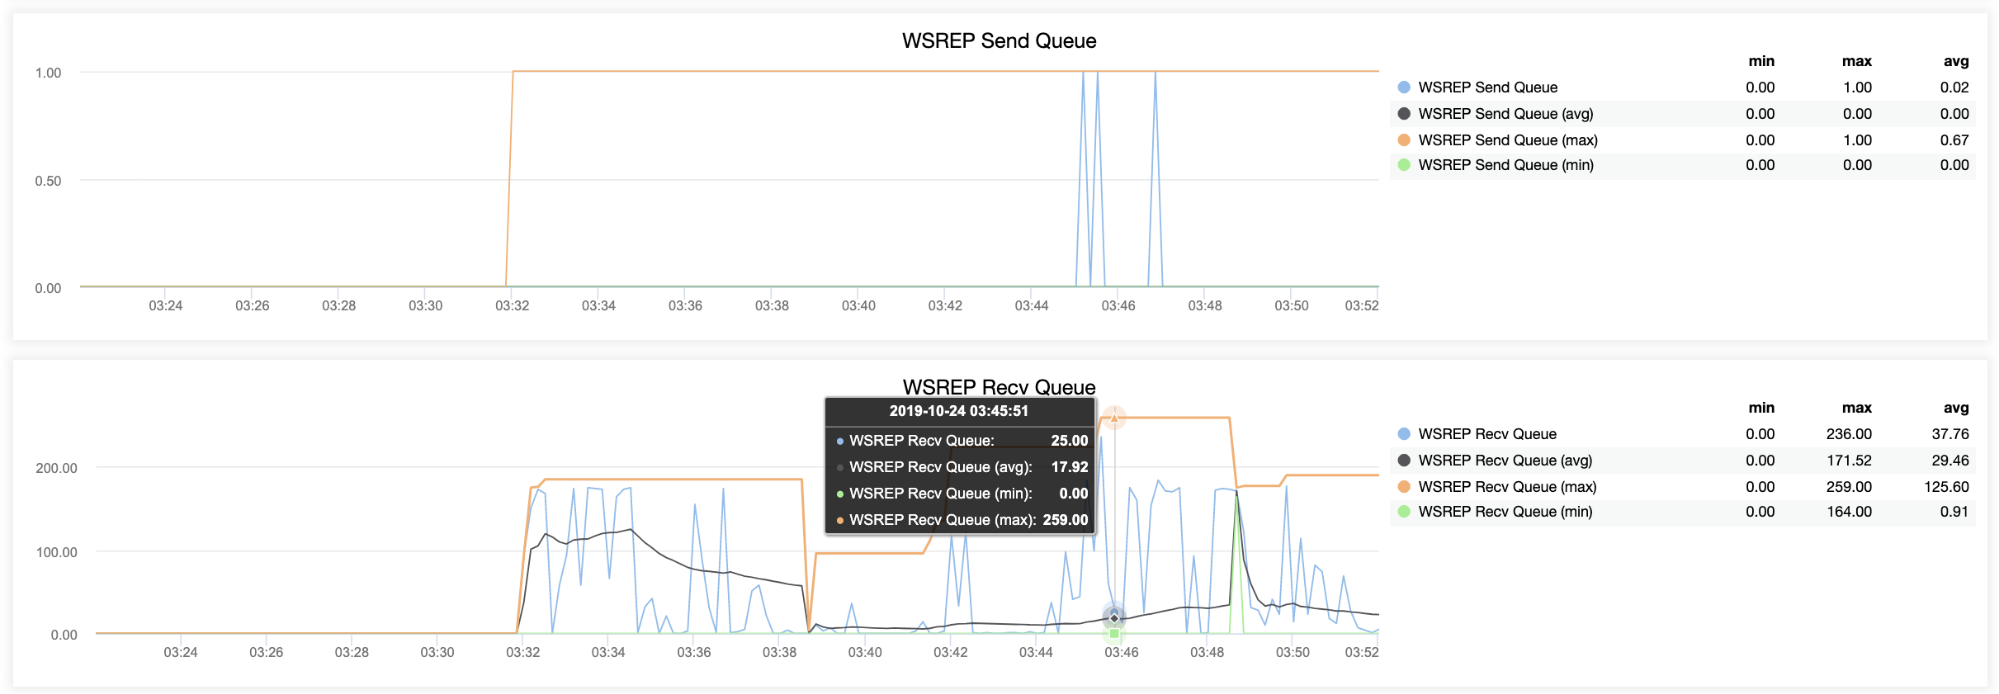
Noticeably, the flow control just kicked in!

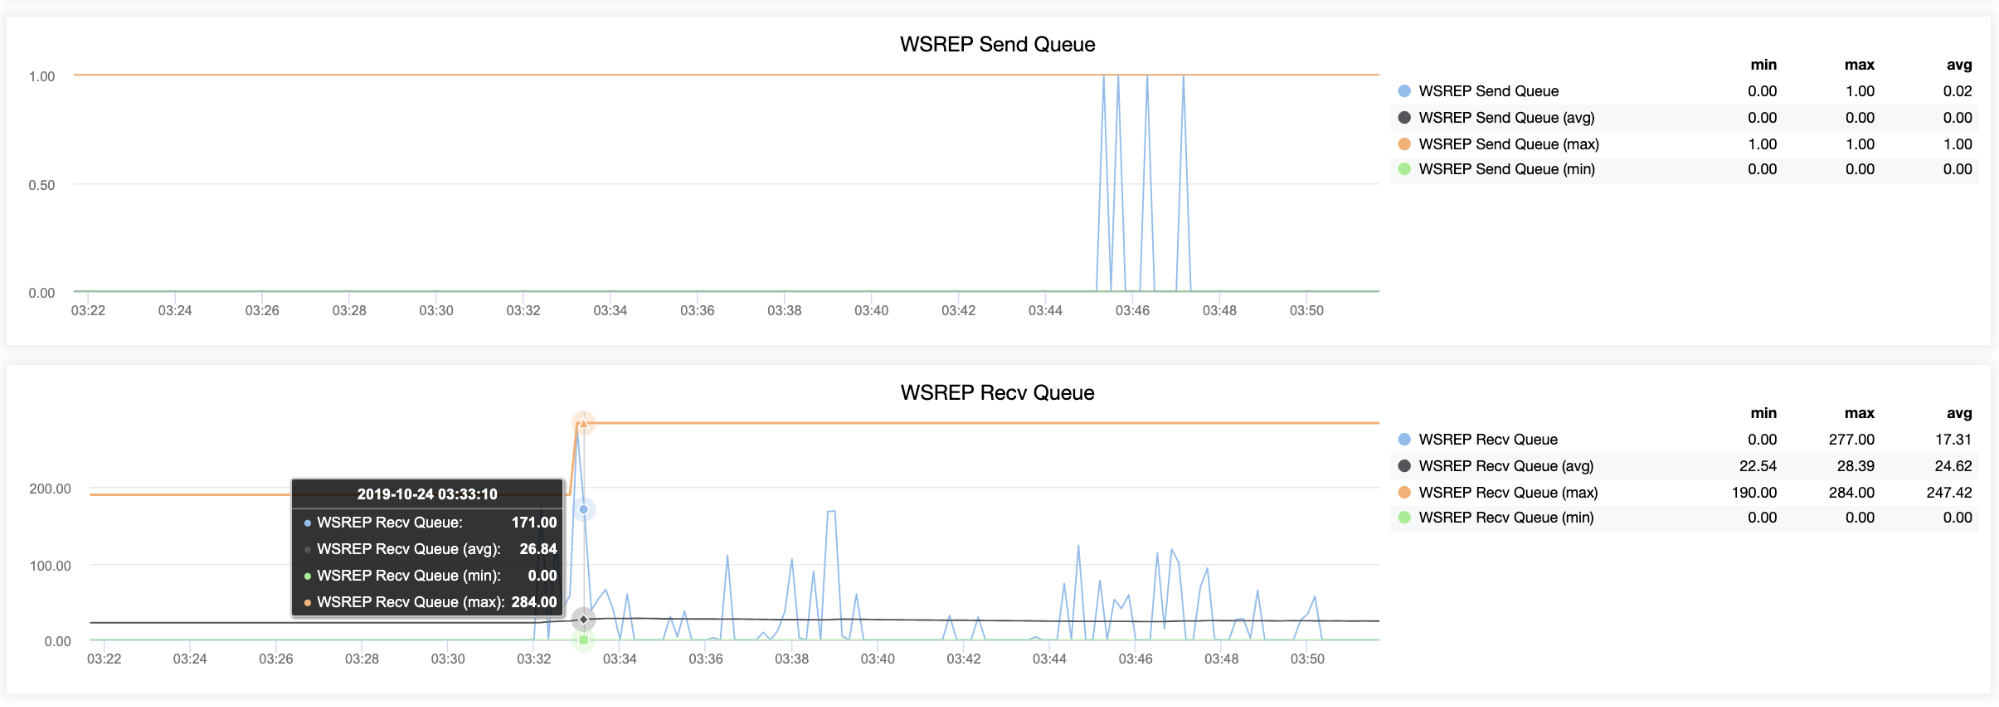
And WSREP queues send/received has been kicking as well:


Now, let's elaborate more of the result from the mysql.wsrep_streaming_log table,
root@testnode11[sbtest]#> pager sed -n '/TRANSACTIONS/,/FILE I/O/p'|tail -8; show engine innodb statusG nopager;

PAGER set to 'sed -n '/TRANSACTIONS/,/FILE I/O/p'|tail -8'

MySQL thread id 134822, OS thread handle 140041167468288, query id 0 System lock

---TRANSACTION 649008, ACTIVE 481 sec

mysql tables in use 1, locked 1

53104 lock struct(s), heap size 6004944, 3929602 row lock(s), undo log entries 3876500

MySQL thread id 183, OS thread handle 140041167468288, query id 105367 localhost 127.0.0.1 root updating

delete from sbtest1 where id >= 2000000

--------

FILE I/O

1 row in set (0.01 sec)
then taking the result of,
root@testnode12[sbtest]#> select count(*) from mysql.wsrep_streaming_log;

+----------+

| count(*) |

+----------+

|    38899 |

+----------+

1 row in set (0.40 sec)
It tells how much fragment has been replicated using Streaming Replication. Now, let's do some basic math:
root@testnode12[sbtest]#> select 3876500/38899.0;

+-----------------+

| 3876500/38899.0 |

+-----------------+

|         99.6555 |

+-----------------+

1 row in set (0.03 sec)
I'm taking the undo log entries from the SHOW ENGINE INNODB STATUSG result and then divide the total count of the mysql.wsrep_streaming_log records. As I've set it earlier, I defined wsrep_trx_fragment_size= 100. The result will show you how much the total replicated logs are currently being processed by Galera.
It’s important to take note at what Streaming Replication is trying to achieve... "the node breaks the transaction into fragments, then certifies and replicates them on the slaves while the transaction is still in progress. Once certified, the fragment can no longer be aborted by conflicting transactions."
The fragments are considered transactions, which have been passed to the remaining nodes within the cluster, certifying the fragmented transaction, then applying the write-sets. This means that once your large transaction has been certified or prioritized, all incoming connections that could possibly have a deadlock will need to wait until the transactions finishes.
Now, the verdict of deleting a huge table?
root@testnode11[sbtest]#> delete from sbtest1 where id >= 2000000;

Query OK, 12034538 rows affected (30 min 36.96 sec)
It finishes successfully without any failure!
How does it look like in the other nodes? In testnode12,
root@testnode12[sbtest]#> pager sed -n '/TRANSACTIONS/,/FILE I/O/p'|tail -8; show engine innodb statusG nopager; show global status like 'wsrep%flow%'; select count(*) from mysql.wsrep_streaming_log;

PAGER set to 'sed -n '/TRANSACTIONS/,/FILE I/O/p'|tail -8'

0 lock struct(s), heap size 1136, 0 row lock(s)

---TRANSACTION 421740651985200, not started

0 lock struct(s), heap size 1136, 0 row lock(s)

---TRANSACTION 553661, ACTIVE (PREPARED) 2050 sec

165631 lock struct(s), heap size 18735312, 12154883 row lock(s), undo log entries 12154883

MySQL thread id 898, OS thread handle 140266050008832, query id 341835 wsrep: preparing to commit write set(215510)

--------

FILE I/O

1 row in set (0.46 sec)


PAGER set to stdout

+----------------------------------+--------------+

| Variable_name                    | Value |

+----------------------------------+--------------+

| wsrep_flow_control_paused_ns     | 290832524304 |

| wsrep_flow_control_paused        | 0 |

| wsrep_flow_control_sent          | 0 |

| wsrep_flow_control_recv          | 0 |

| wsrep_flow_control_interval      | [ 173, 173 ] |

| wsrep_flow_control_interval_low  | 173 |

| wsrep_flow_control_interval_high | 173          |

| wsrep_flow_control_status        | OFF |

+----------------------------------+--------------+

8 rows in set (0.53 sec)


+----------+

| count(*) |

+----------+

|   120345 |

+----------+

1 row in set (0.88 sec)
It stops at a total of 120345 fragments, and if we do the math again on the last captured undo log entries (undo logs are the same from the master as well),
root@testnode12[sbtest]#> select 12154883/120345.0;                                                                                                                                                   +-------------------+

| 12154883/120345.0 |

+-------------------+

|          101.0003 |

+-------------------+

1 row in set (0.00 sec)
So we had a total of 120345 transactions being fragmented to delete 12034538 rows.
Once you're done using or enabling Stream Replication, do not forget to disable it as it will always log huge transactions and adds a lot of performance overhead to your cluster. To disable it, just run
root@testnode11[sbtest]#> set wsrep_trx_fragment_size=0;

Query OK, 0 rows affected (0.04 sec)
Conclusion
With Streaming Replication enabled, it's important that you are able to identify how large your fragment size can be and what unit you have to choose (bytes, rows, statements).
It is also very important that you need to run it at session-level and of course identify when you only need to use Streaming Replication.
While performing these tests, deleting a large number of rows to a huge table with Streaming Replication enabled has noticeably caused a high peak of disk utilization and CPU utilization. The RAM was more stable, but this could due to the statement we performed is not highly a memory contention.
It’s safe to say that Streaming Replication can cause performance bottlenecks when dealing with large records, so using it should be done with proper decision and care.
Lastly, if you are using Streaming Replication, do not forget to always disable this once done on that current session to avoid unwanted problems.


