blog
Effective Monitoring of MySQL With SCUMM Dashboards: Part One

We added a number of new dashboards for MySQL in our latest release of ClusterControl 1.7.0. – and in our previous blog, we showed you How to Monitor Your ProxySQL with Prometheus and ClusterControl.
In this blog, we will look at the MySQL Overview dashboard.
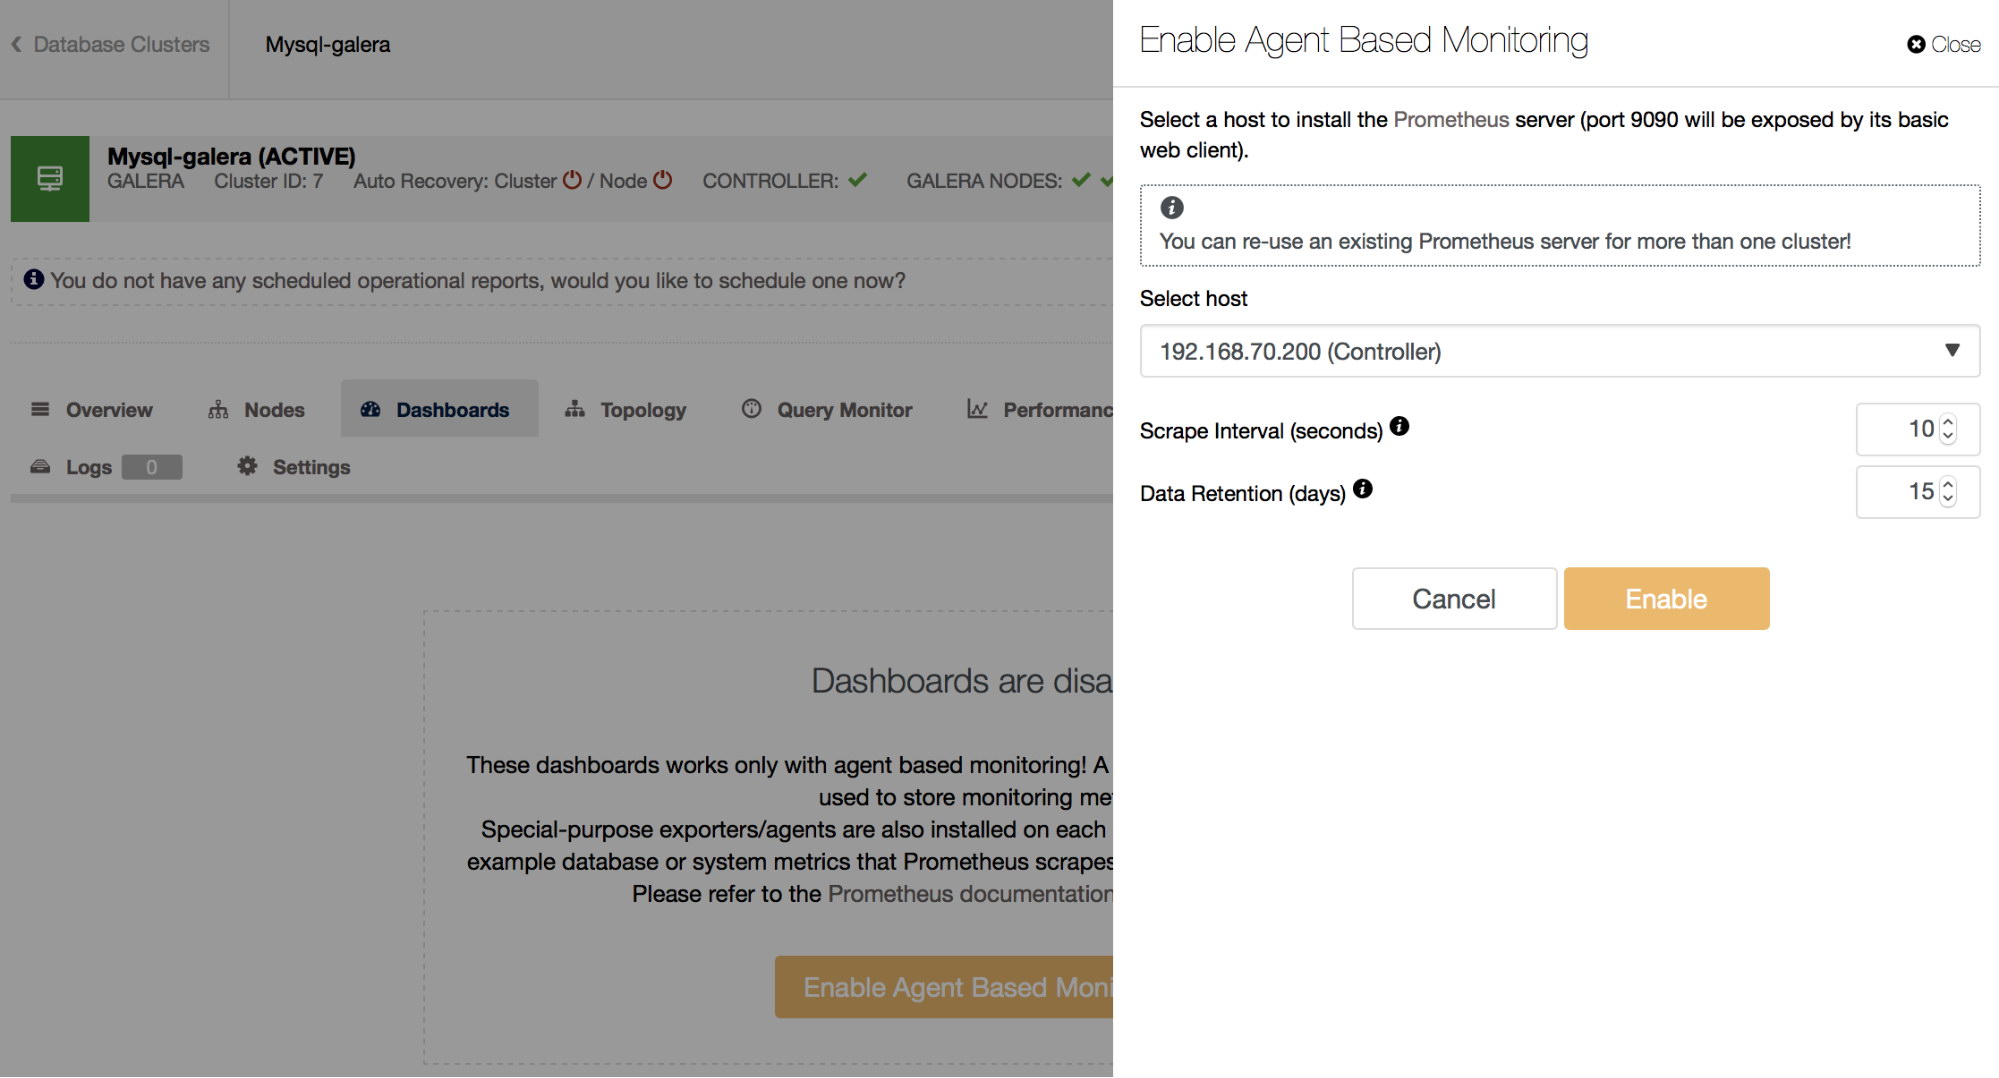
So, we have enabled the Agent Based Monitoring under the Dashboard tab to start collecting metrics to the nodes. Take note that when enabling the Agent Based Monitoring, you have the options to set the “Scrape Interval (seconds)” and “Data retention (days)”. Scraping Interval is where you want to set how aggressively Prometheus will harvest data from the target and Data Retention is how long you want to keep your data collected by Prometheus before it’s deleted.
When enabled, you can identify which cluster has agents and which one has agentless monitoring.
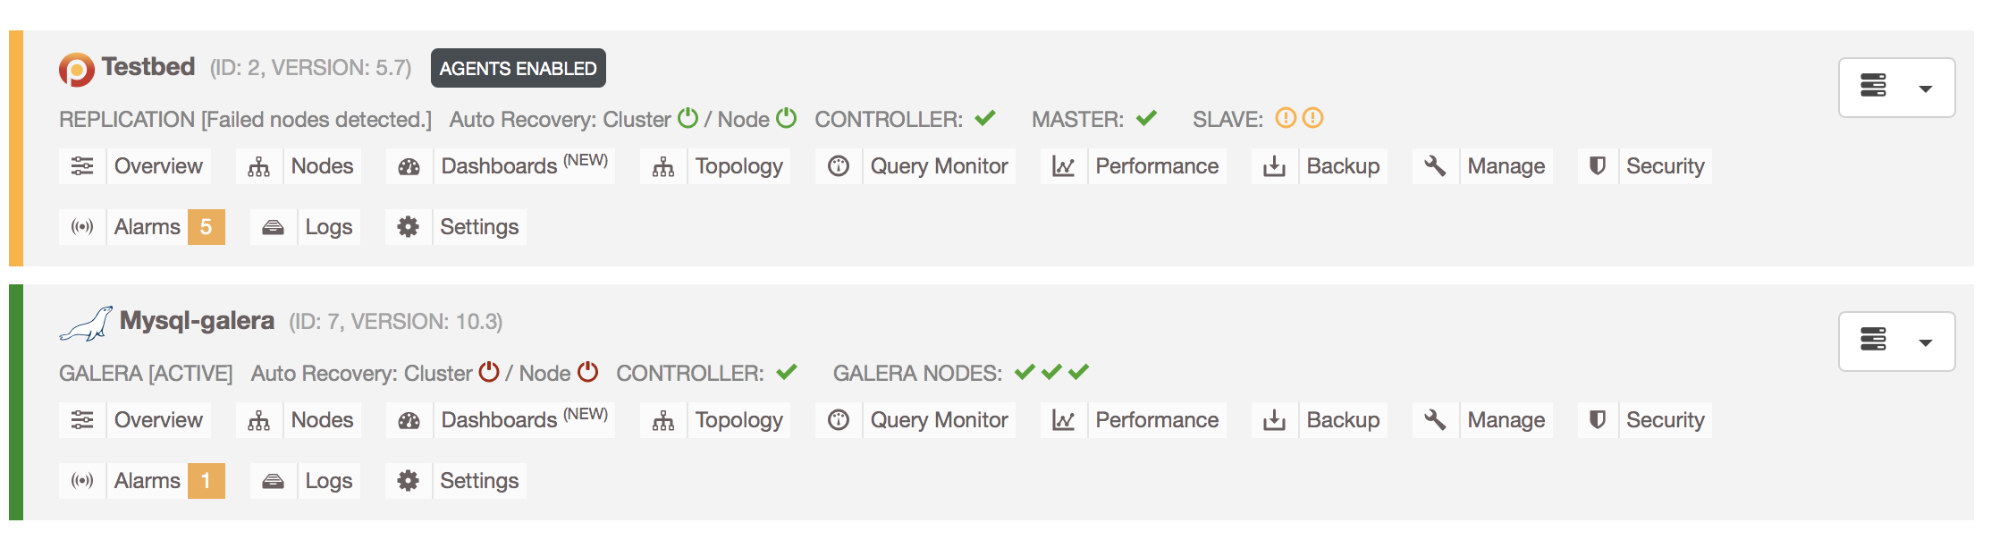
Compared to the agentless approach, the granularity of your data in graphs will be higher with agents.
The MySQL Graphs
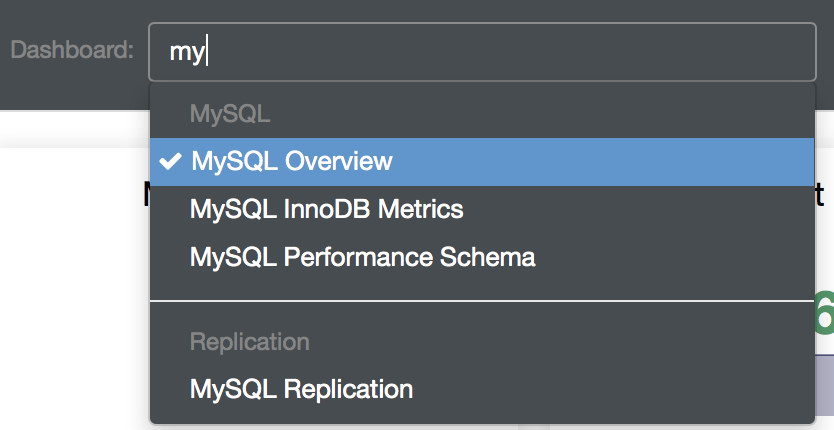
The latest version of ClusterControl 1.7.0 (which you can download for free – ClusterControl Community) has the following MySQL Dashboards for which you can gather information for your MySQL servers. These are MySQL Overview, MySQL InnoDB Metrics, MySQL Performance Schema, and MySQL Replication.
We’ll cover in details the graphs available in the MySQL Overview dashboard.
MySQL Overview Dashboard
This dashboard contains the usual important variables or information regarding the health of your MySQL node. The graphs contained on this dashboard are specific to the node selected upon viewing the dashboards as seen below:

It consists of 26 graphs, but you might not need all of these when diagnosing problems. However, these graphs provides a vital representation of the overall metrics for your MySQL servers. Let’s go over the basic ones, as these are probably the most common things that a DBA will routinely look at.
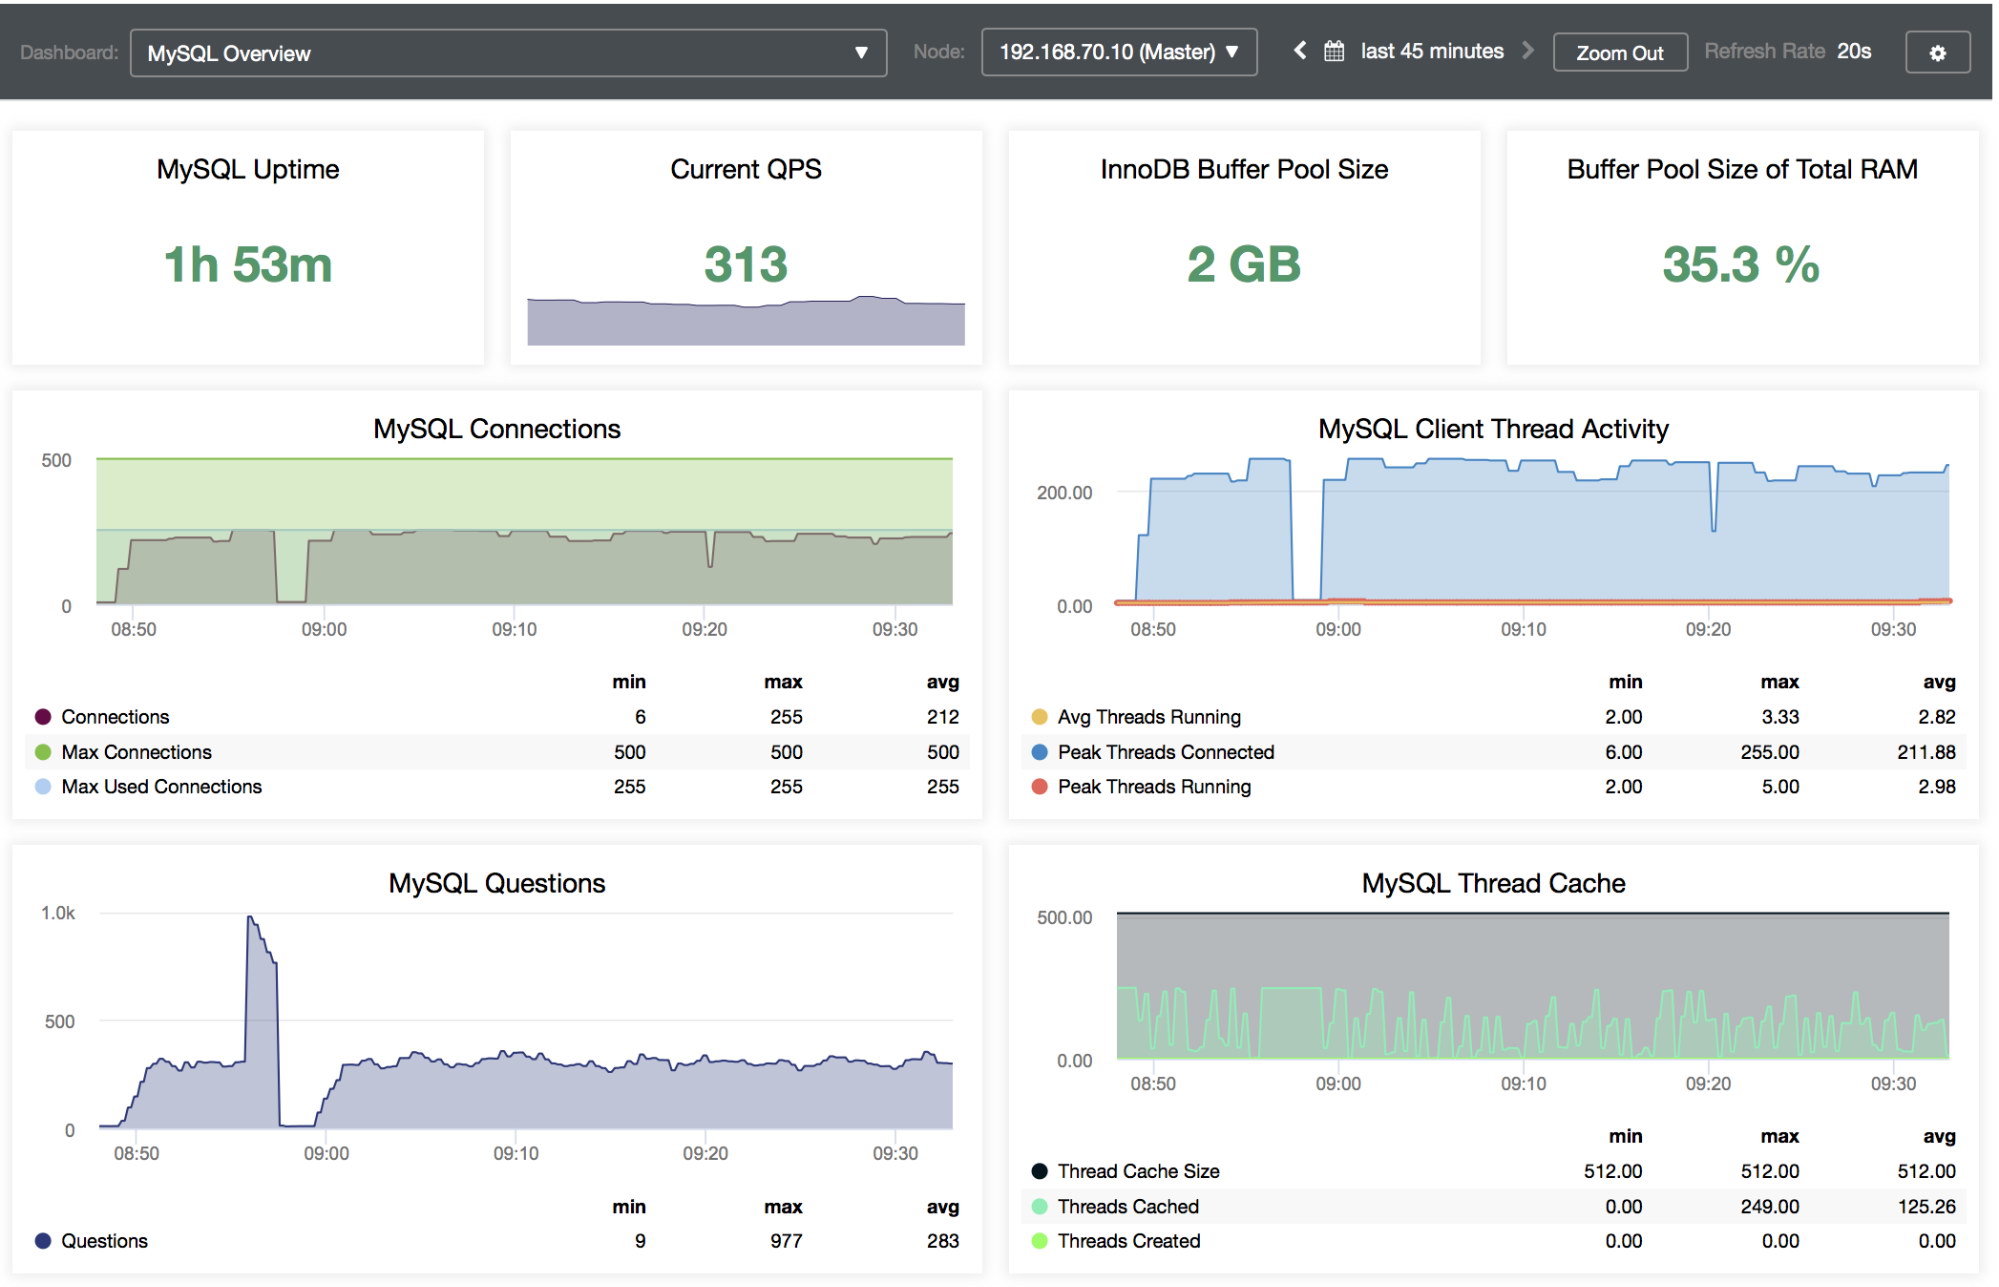
The first four graphs shown above along with the MySQL’s uptime, query per-seconds, and buffer pool information are the most basic pointers we might need. From the graphs displayed above, here are their representations:
- MySQL Connections
This is where you want to check your total client connections thus far allocated in a specific period of time. - MySQL Client Thread Activity
There are times that your MySQL server could be very busy. For example, it might be expected to receive surge in traffic at a specific time, and you want to monitor your running threads activity. This graph is really important to look at. There can be times your query performance could go south if, for example, a large update causes other threads to wait to acquire lock. This would lead to an increased number of your running threads. The cache miss rate is calculated as Threads_created/Connections. - MySQL Questions
These are the queries running in a specific period of time. A thread might be a transaction composed of multiple queries and this can be a good graph to look at. - MySQL Thread Cache
This graph shows the thread_cache_size value, threads that are cached (threads that are reused), and threads that are created (new threads). You can check on this graph for such instances like you need to tune your read queries when noticing a high number of incoming connections and your threads created increases rapidly. For example, if your Threads_running / thread_cache_size > 2 then increasing your thread_cache_size may give a performance boost to your server. Take note that creation and destruction of threads are expensive. However, in the recent versions of MySQL (>=5.6.8), this variable has autosizing by default which you might consider it untouched.
The next four graphs are MySQL Temporary Objects, MySQL Select Types, MySQL Sorts, and MySQL Slow Queries. These graphs are related to each other specially if you are diagnosing long running queries and large queries that needs optimization.
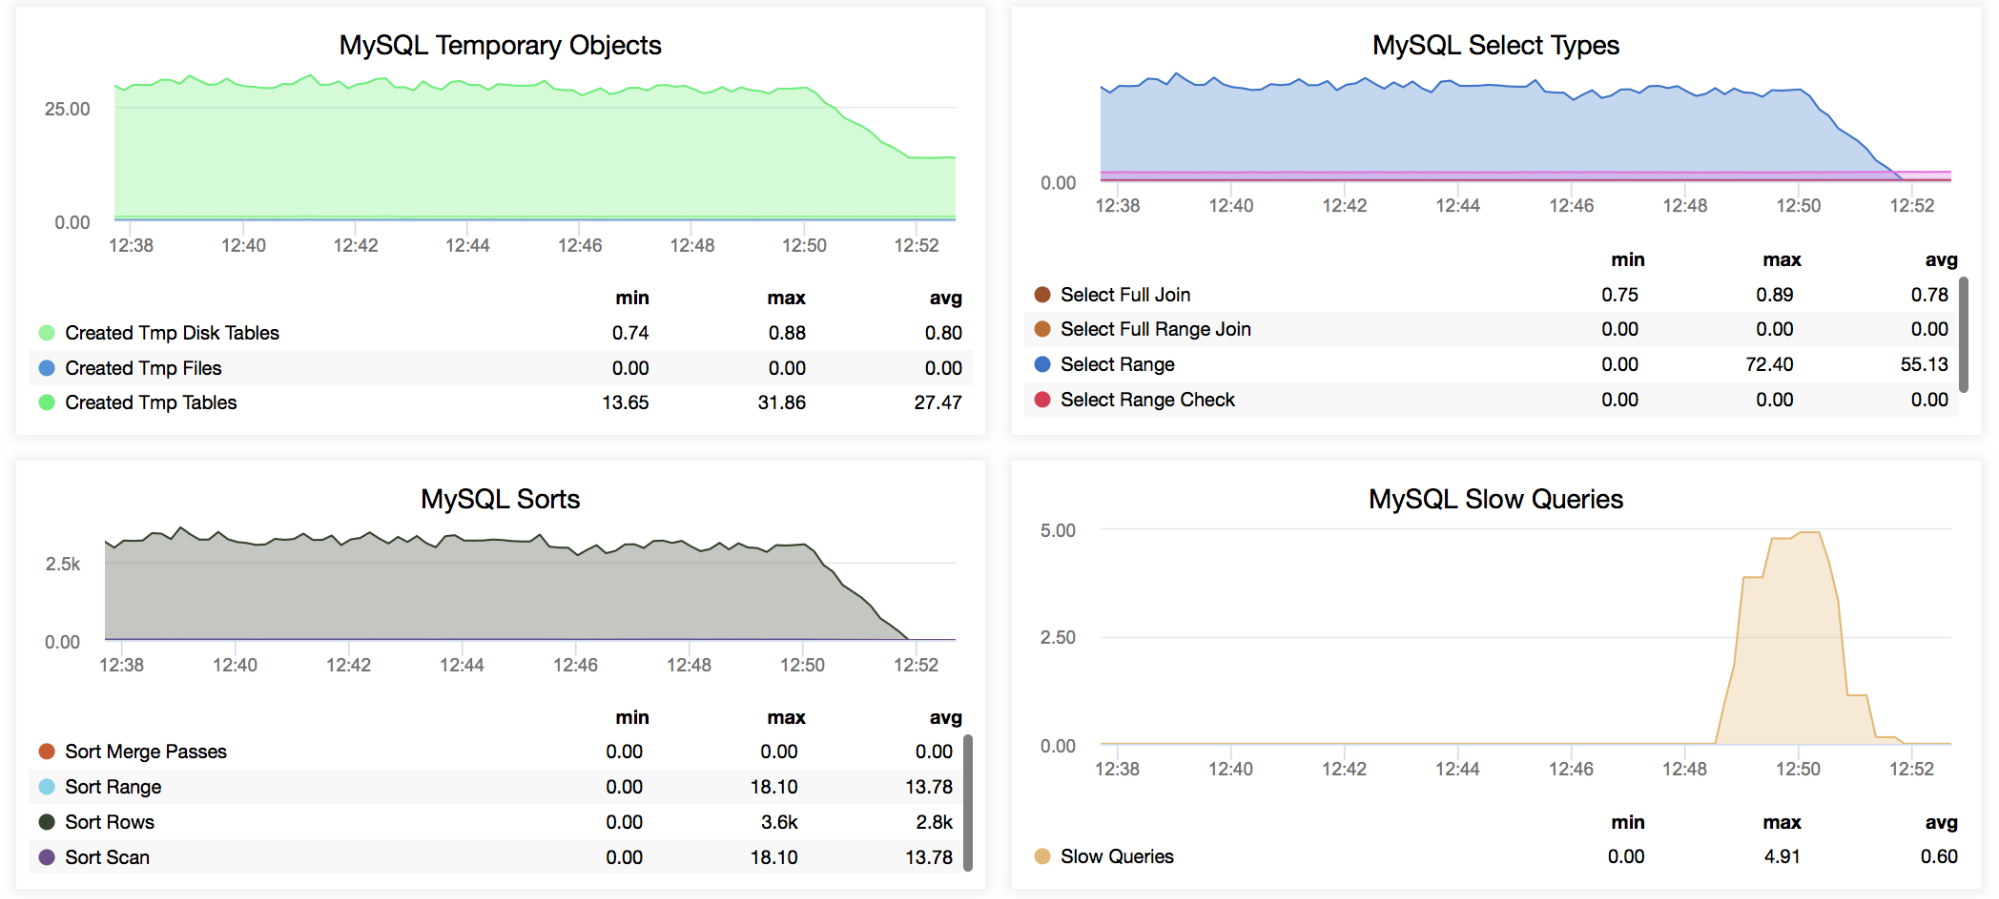
- MySQL Temporary Objects
This graph would be a good source to rely upon if you want to monitor long running queries that would end up using disk instead of temporary tables or files going in-memory. It’s a good place to start looking for periodical occurrence of queries that could add up to create disk space issues especially during odd times. - MySQL Select Types
One source of bad performance is queries that are using full joins, table scans, select range that is not using any indexes. This graph would show how your query performs and what amongst the list from full joins, to full range joins, select range, table scans has the highest trends. - MySQL Sorts
Diagnosing those queries that are using sorting, and the ones that take much time to finish. - MySQL Slow Queries
Trends of your slow queries are collected here on this graph. This is very useful especially on diagnosing how often your queries are slow. What are things that need to be tuned? It could be too small buffer pool, tables that lack indexes and goes a full-table scan, logical backups running on unexpected schedule, etc. Using our Query Monitor in ClusterControl along with this graph is beneficial, as it helps determine slow queries.
The next graphs we have cover is more of the network activity, table locks, and the underlying internal memory that MySQL is consuming during the MySQL’s activity.
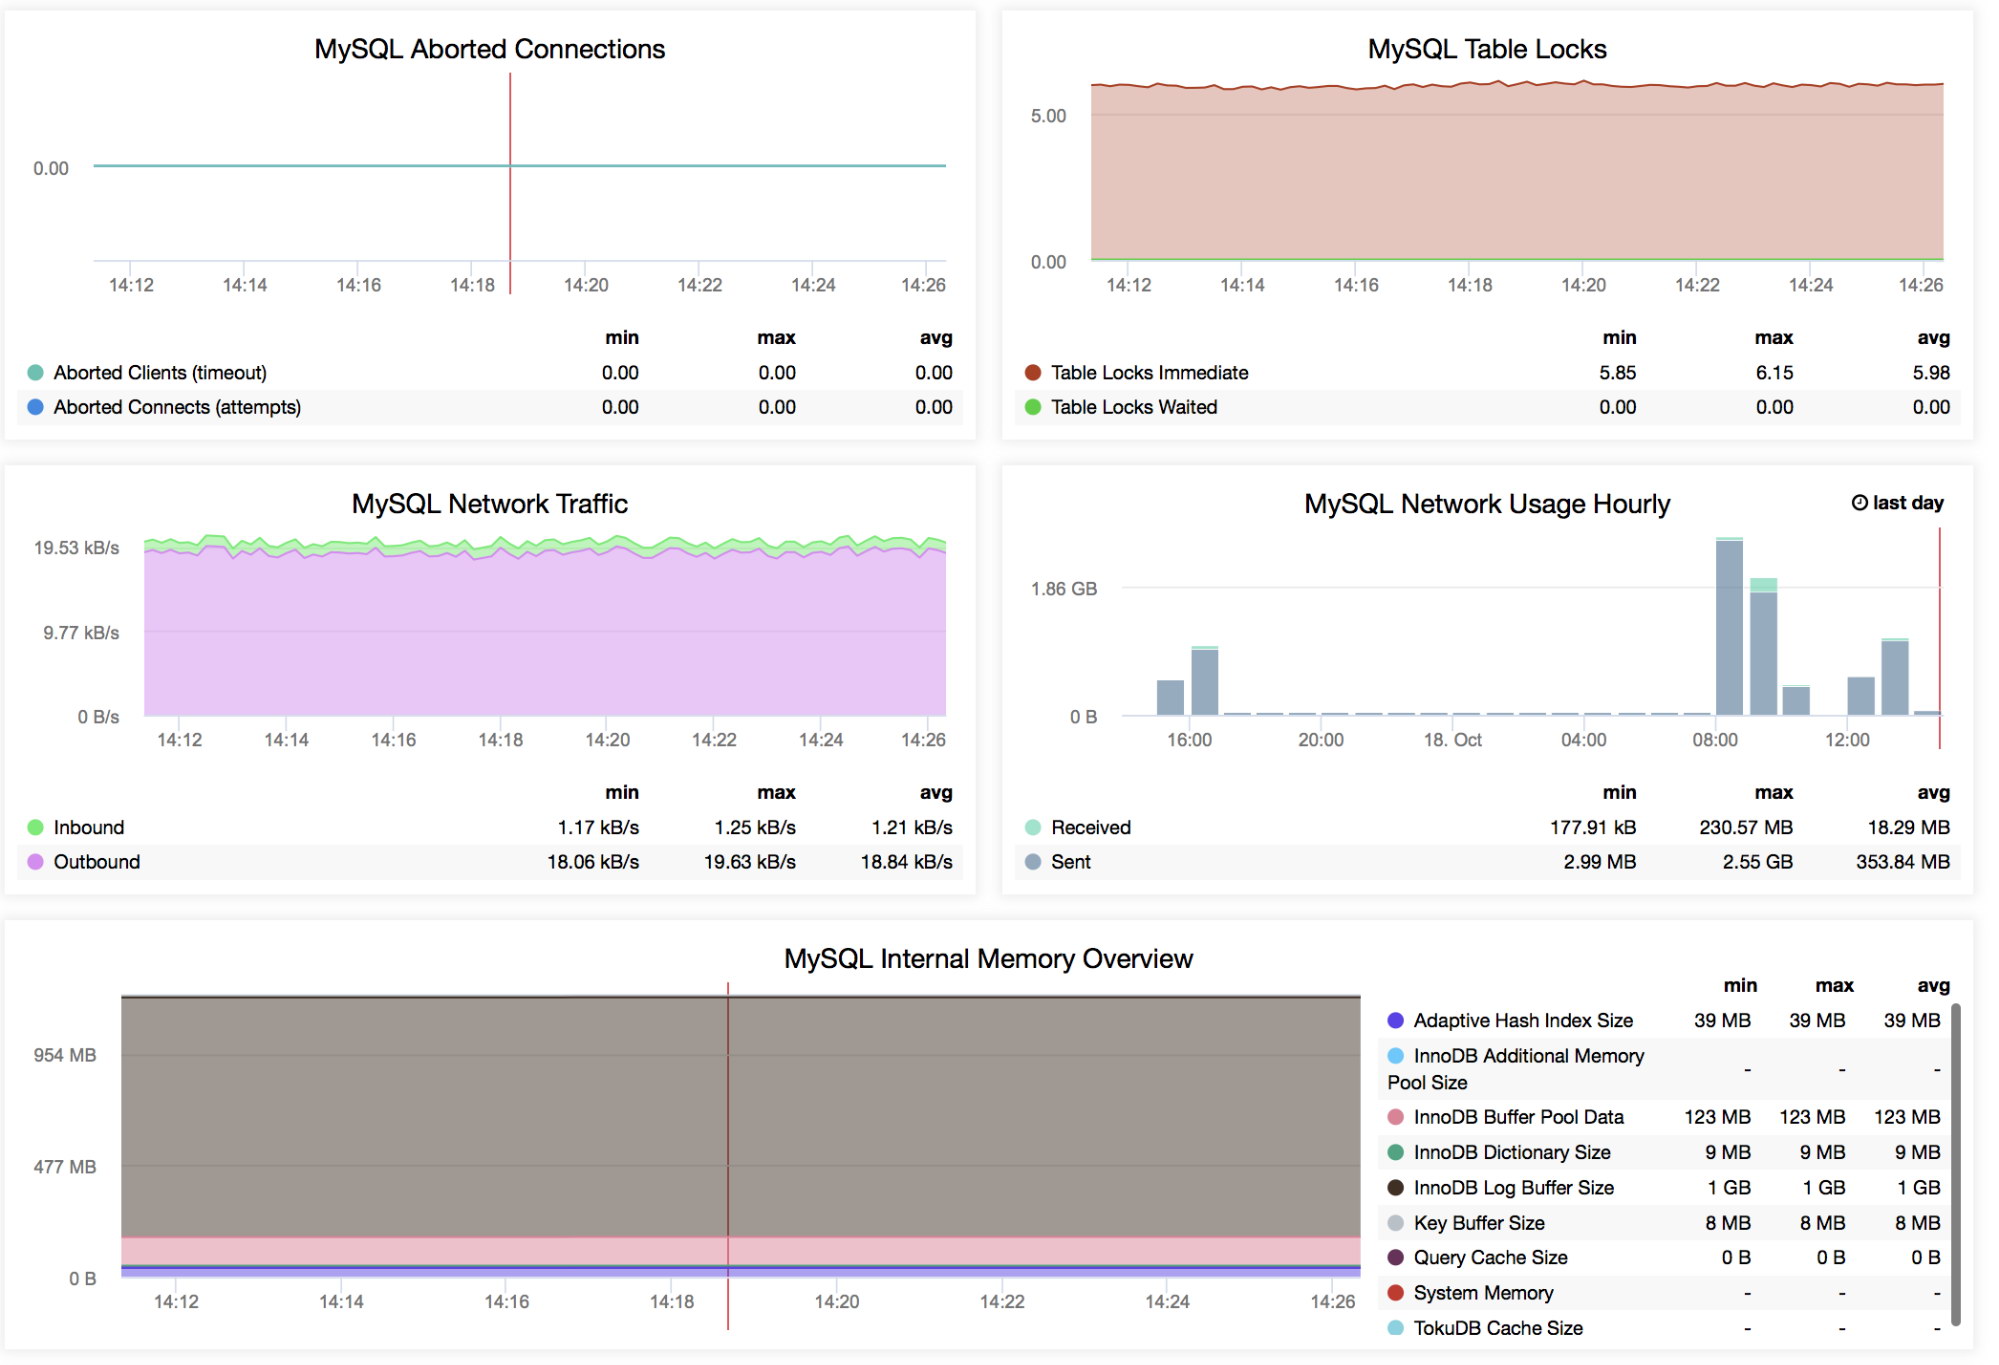
- MySQL Aborted Connections
The number of aborted connections will render on this graph. This covers the aborted clients such as where the network was closed abruptly or where the internet connection was down or interrupted. It also records the aborted connects or attempts such as wrong passwords or bad packets upon establishing a connection from the client. - MySQL Table Locks
Trends for tables that request for a table lock that has been granted immediately and for tables that request for a lock that has not been acquired immediately. For example, if you have table-level locks on MyISAM tables and incoming requests of the same table, these cannot be granted immediately. - MySQL Network Traffic
This graph shows the trends of the inbound and outbound network activity in the MySQL server. “Inbound” is the data received by the MySQL server while “Outbound” is the data sent or transferred by the server from the MySQL server.This graph is best to check upon if you want to monitor your network traffic especially when diagnosing if your traffic is moderate but you’re wondering why it has a very high outbound transferred data, like for example, BLOB data. - MySQL Network Usage Hourly
Same as the network traffic which shows the Received and Sent data. Take note that it’s based on ‘per hour’ and labeled with ‘last day’ which will not follow the period of time you selected in the date picker. - MySQL Internal Memory Overview
This graph is familiar for a seasoned MySQL DBA. Each of these legends in the bar graph are very important especially if you want to monitor your memory usage, your buffer pool usage, or your adaptive hash index size.
The following graphs show the counters that a DBA can rely upon such as checking the statistics for example, the statistics for selects, inserts, updates, the number of master status that has been executed, the number of SHOW VARIABLES that has been executed, check if you have bad queries doing table scans or tables not using indexes by looking over the read_* counters, etc.
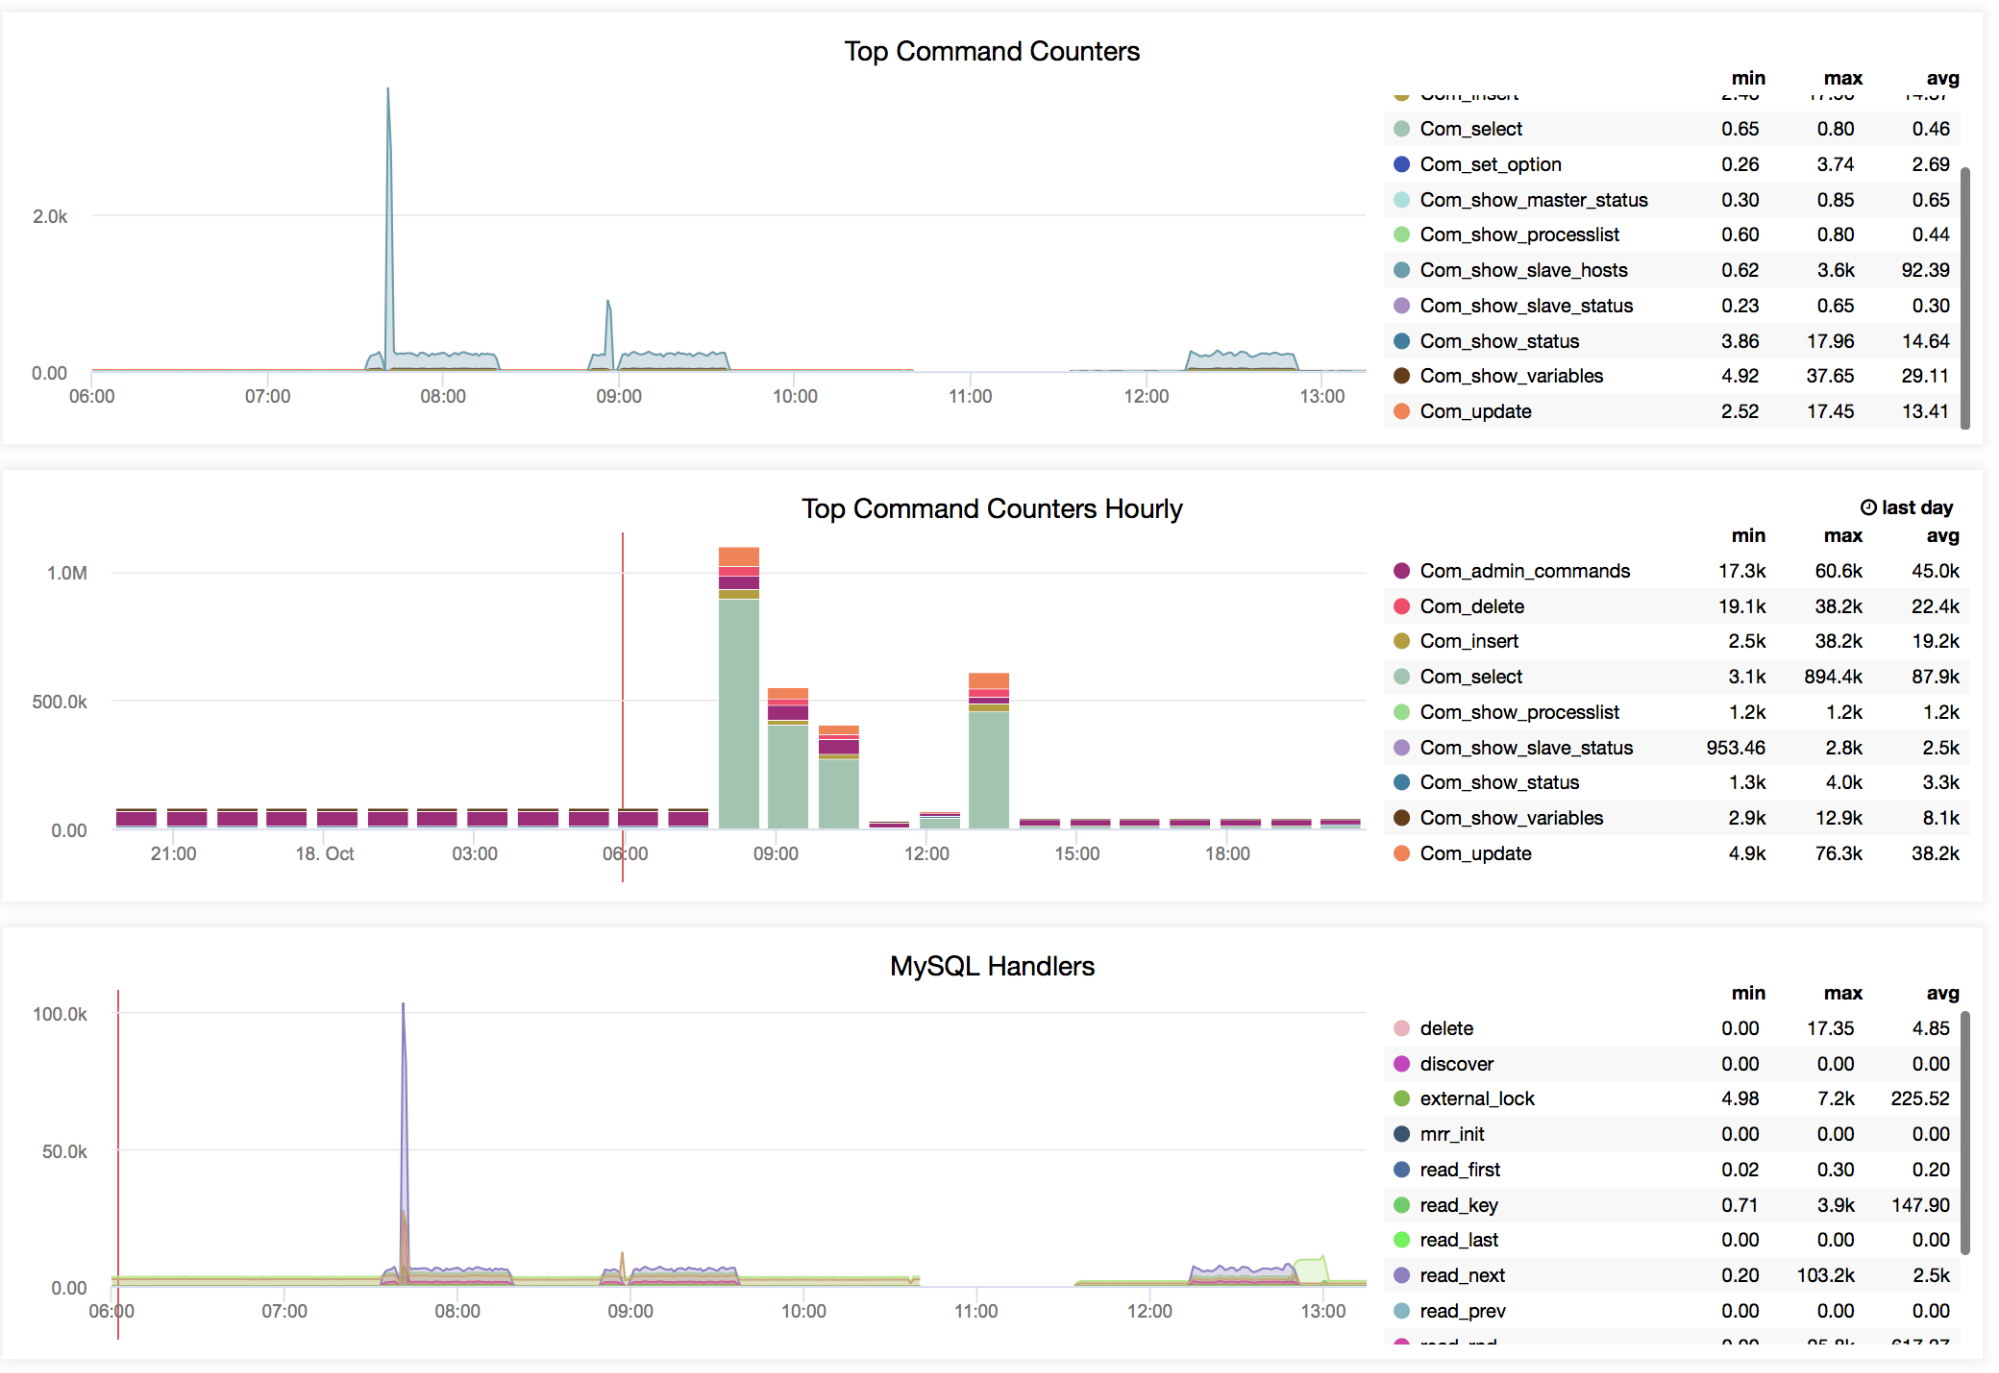
- Top Command Counters (Hourly)
These are the graphs you would likely have to check whenever you would like to see the statistics for your inserts, deletes, updates, executed commands such as gathering the processlist, slave status, show status (health statistics of the MySQL server), and many more. This is a good place if you want to check what kind of MySQL command counters are topmost and if some performance tuning or query optimization is needed. It might also allow you to identify which commands are running aggressively while not needing it. - MySQL Handlers
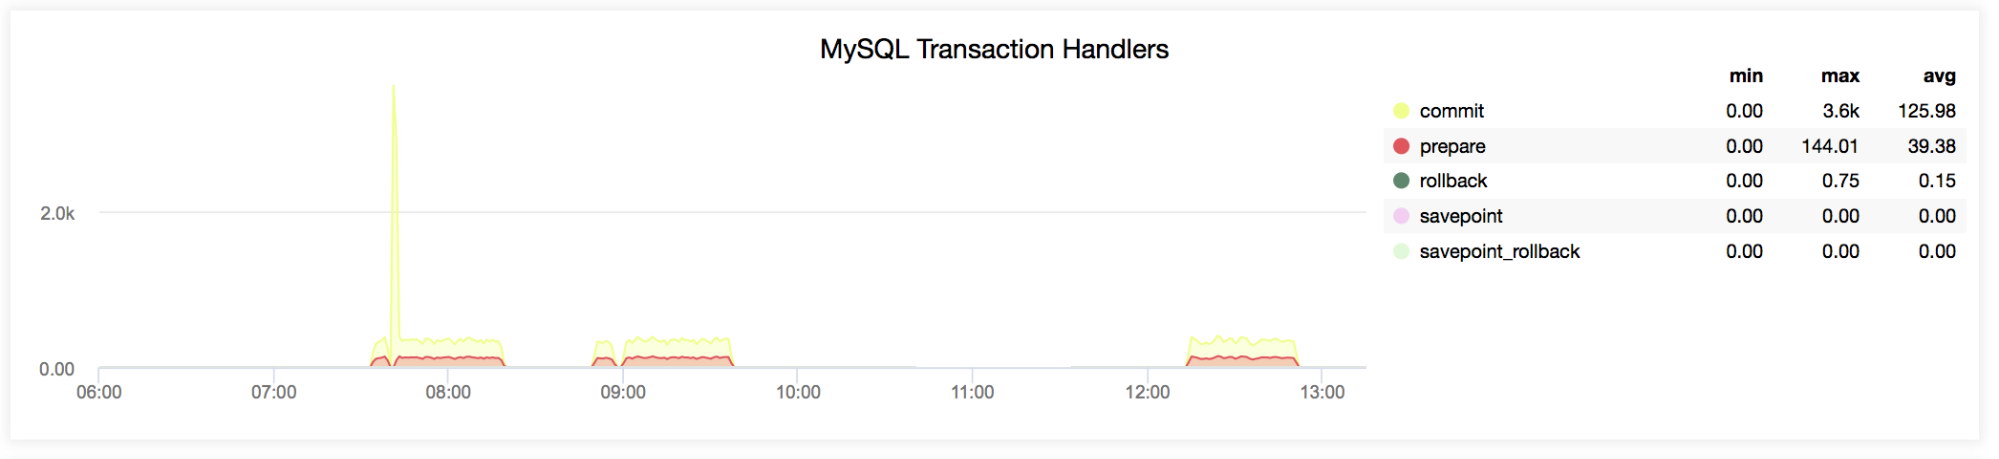
Oftentimes, a DBA would go over these handlers and check how the queries are performing in your MySQL server. Basically, this graph covers the counters from the Handler API of MySQL. Most common handler counters for a DBA for the storage API in MySQL are Handler_read_first, Handler_read_key, Handler_read_last, Handler_read_next, Handler_read_prev, Handler_read_rnd, and Handler_read_rnd_next. There are lots of MySQL Handlers to check upon. You can read about them in the documentation here. - MySQL Transaction Handlers
If your MySQL server is using XA transactions, SAVEPOINT, ROLLBACK TO SAVEPOINT statements. Then this graph is a good reference to look at. You can also use this graph to monitor all your server’s internal commits. Take note that the counter for Handler_commit does increment even for SELECT statements but differs against insert/update/delete statements which goes to the binary log during a call to COMMIT statement.
The next graph will show trends about process states and their hourly usage. There are lots of key points here in the bar graph legend that a DBA would check. Encountering disk space issues, connection issues and see if your connection pool is working as expected, high disk I/O, network issues, etc.
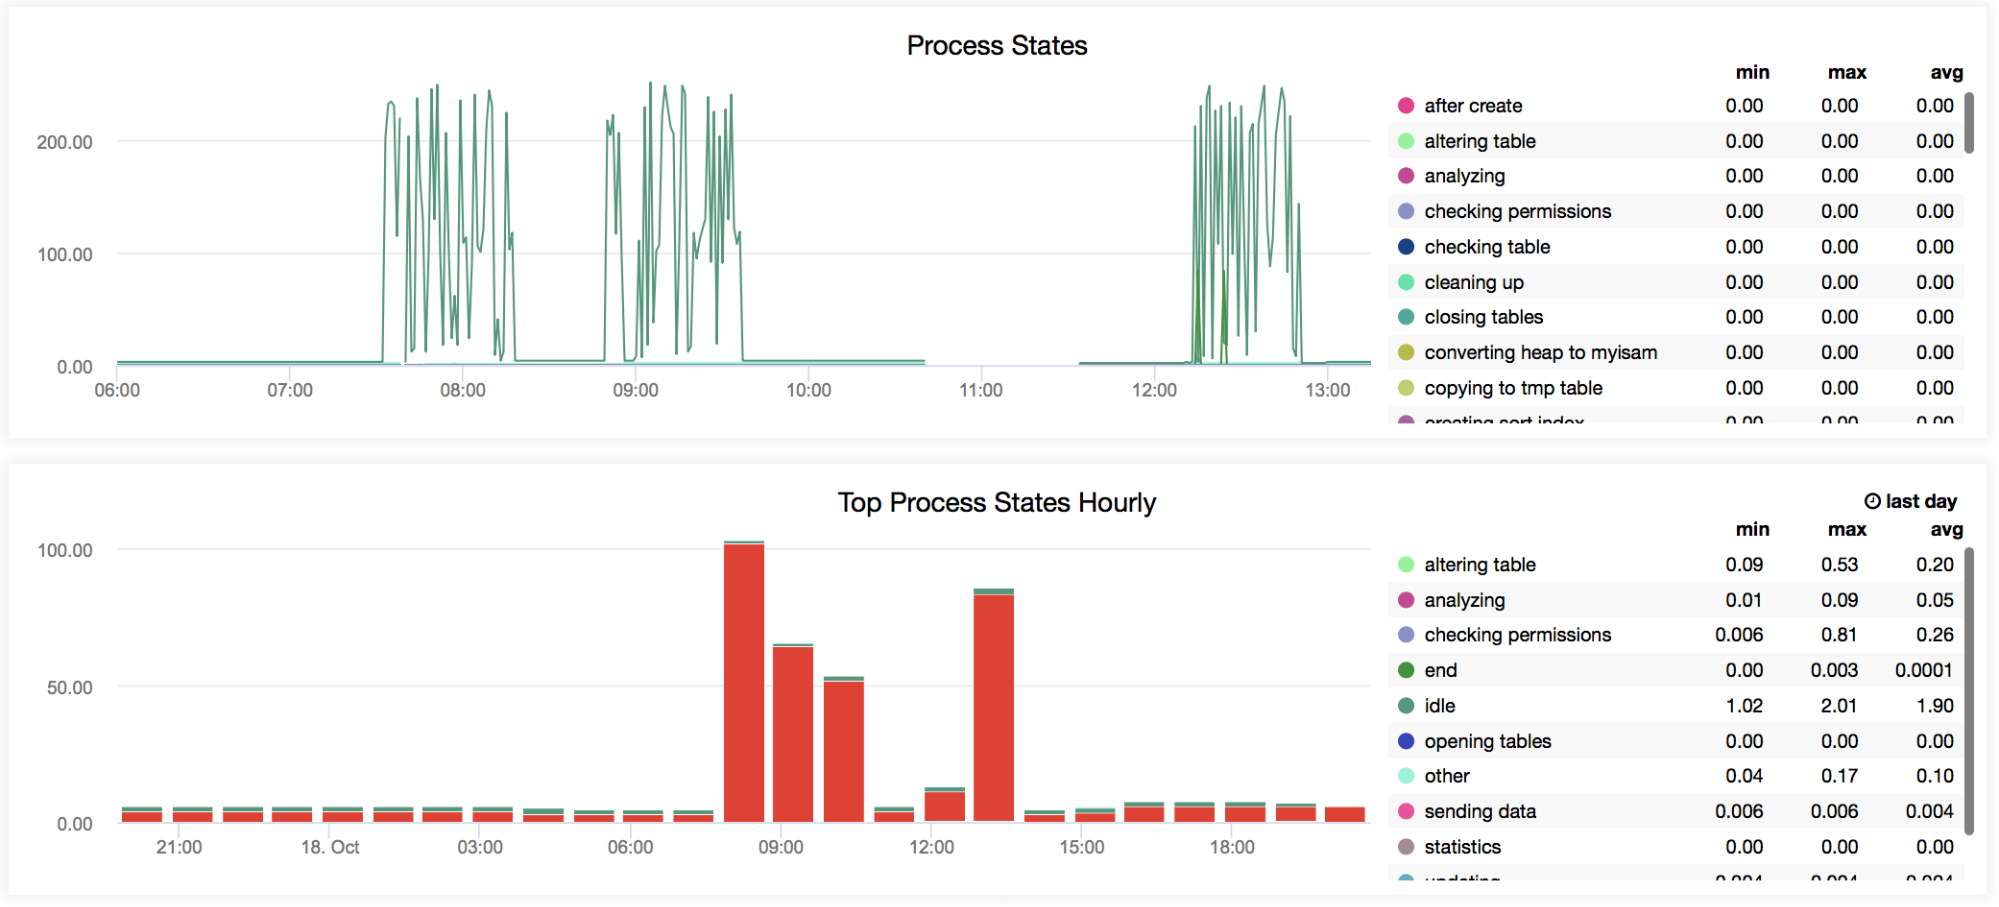
- Process States/Top Process States Hourly
This graph is where you can monitor the top thread states of your queries running in the processlist. This is very informative and helpful for such DBA tasks where you can examine here any outstanding statuses that need resolution. For example, opening tables state is very high and its minimum value is almost near to the maximum value. This could indicate that you need to adjust the table_open_cache. If the statistics is high and you’re noticing a slow down of your server, this could indicate that your server is disk-bound and you might need to consider increasing your buffer pool. If you have a high number of creating tmp table then you might have to check your slow log and optimize the offending queries. You can checkout the manual for the complete list of MySQL thread states here.
The next graph we’ll be checking is about query cache, MySQL table definition cache, how often MySQL opens system files.
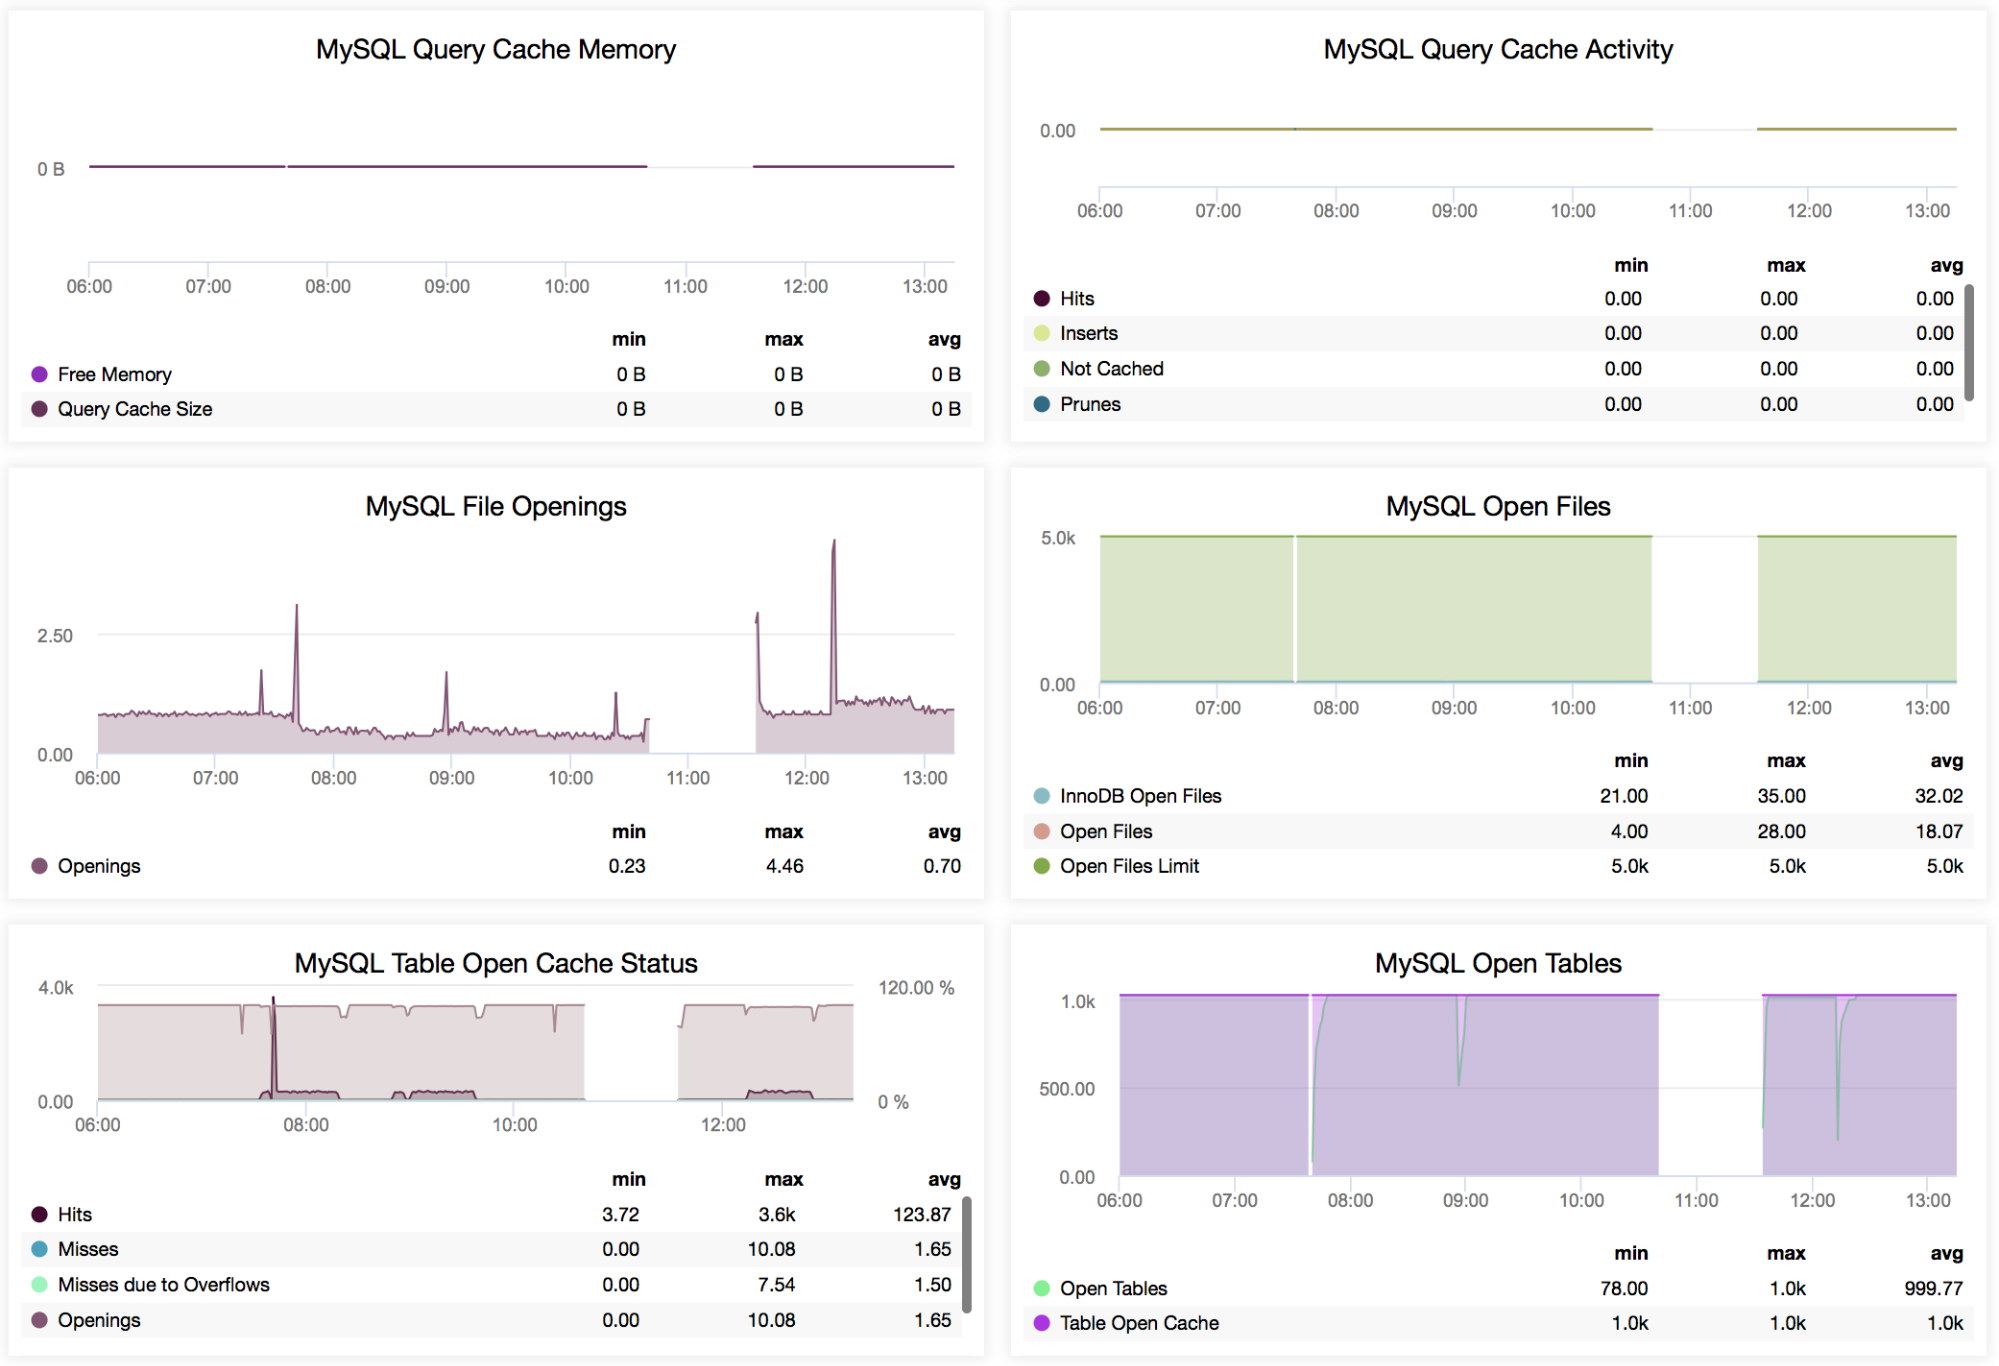
- MySQL Query Cache Memory/Activity
These graphs are related to each other. If you have query_cache_size <> 0 and query_cache_type <> 0, then this graph can be of help. However, in the newer versions of MySQL, the query cache has been marked as deprecated as the MySQL query cache is known to cause performance issues. You might not need this in the future. The most recent version of MySQL 8.0 has drastic improvements; it tends to increase performance as it comes with several strategies to handle cache information in the memory buffers. - MySQL File Openings
This graph shows the trend for the opened files since the MySQL server’s uptime but it excludes files such as sockets or pipes. It does also not include files that are opened by the storage engine since they have their own counter that is Innodb_num_open_files. - MySQL Open Files
This graph is where you want to check your InnoDB files currently held open, the current MySQL open files, and your open_files_limit variable. - MySQL Table Open Cache Status
If you have very low table_open_cache set here, this graph will tell you about those tables that fail the cache (newly opened tables) or miss due to overflow. If you encounter a high number or too much “Opening tables” status in your processlist, this graph will serve as your reference to determine this. This will tell you if there’s a need to increase your table_open_cache variable. - MySQL Open Tables
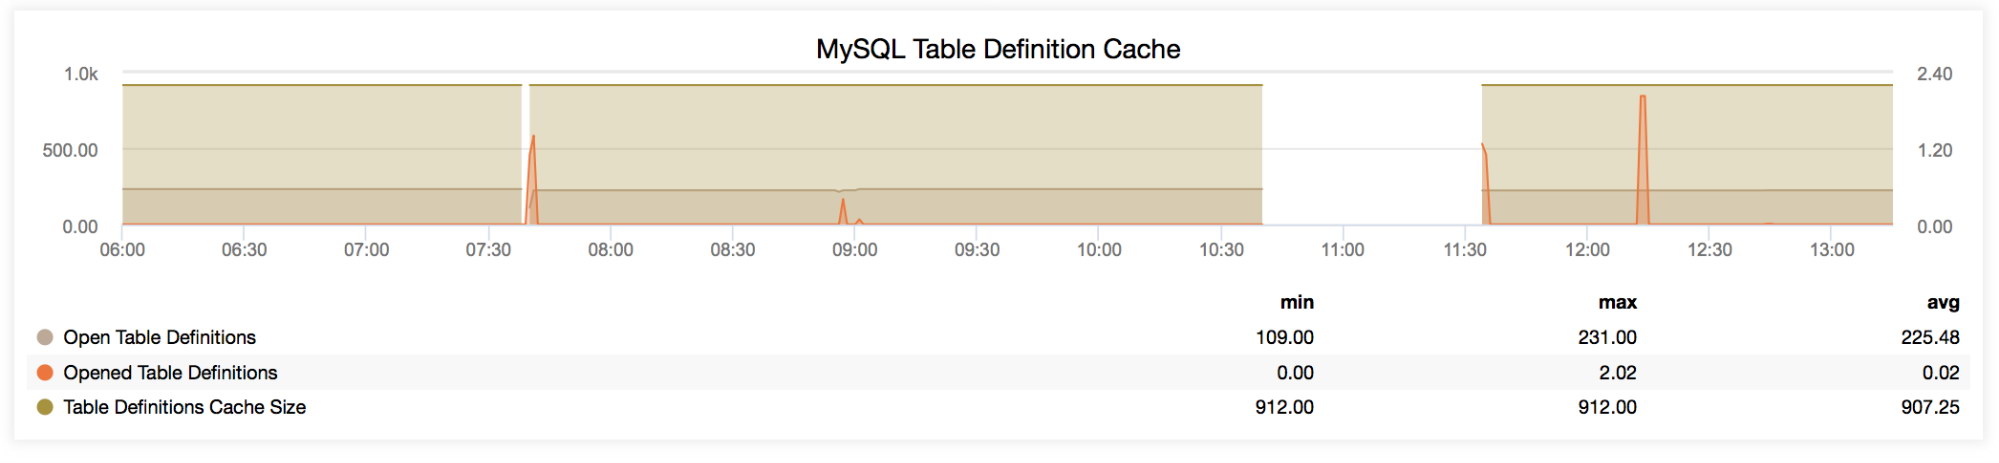
Relative to MySQL Table Open Cache Status, this graph is useful in certain occasions like you want to identify if there’s a need to increase of your table_open_cache or lower it down if you notice a high increase of open tables or Open_tables status variable. Note that table_open_cache could take a large amount of memory space so you have to set this with care especially in production systems. - MySQL Table Definition Cache
If you want to check the number of your Open_table_definitions and Opened_table_definitions status variables, then this graph is what you need. For newer versions of MySQL (>=5.6.8), you might not need to change the value of this variable and use the default value since it has autoresizing feature.
Conclusion
The SCUMM addition in the latest version of ClusterControl 1.7.0 provides significant new benefits for a number of key DBA tasks. The new graphs can help easily pinpoint the cause of issues that DBAs or sysadmins would typically have to deal with and help find appropriate solutions faster.
We would love to hear your experience and thoughts on using ClusterControl 1.7.0 with SCUMM (which you can download for free – ClusterControl Community).
In part 2 of this blog, I will discuss Effective Monitoring of MySQL Replication with SCUMM Dashboards.