blog
Best Practices for Enabling Database Alarms & Notifications

Database Alarms and Notifications are one of the best ways to notify us of what’s going on with our monitored database servers. This does not limit alone to the database systems but the whole picture of the operational architecture including its operating system used and the hardware health state.
In some cases, Database Alarms and Notifications does not mean it has to be always reactive for all changes that triggers or stimulates certain warnings once a certain threshold is met. For example, a preemptive or preventive maintenance which has to occur on a scheduled basis such as daily, weekly, monthly, and yearly. Some might have quarterly basis as well. It really depends on certain requirements and also there is ad-hoc maintenance that you might have to deal with especially if it requires an urgent action. In this case, it is better to silence alarms and notifications in order to avoid false alarms and only allow or trigger those valid once. In this case, everyone pays attention only to those that require actions and to monitor valid alarms during a maintenance window. How to do this? Let’s discuss in this blog.
Common Database Alarms
Database Alarms do not relate only to specific database (i.e. data stored) related information. It shall cover the whole relationship that a database can perform to its level of expectations. This shall cover the hardware, operating system, network, security, backups, high availability, recovery, and those relative to the topology underneath of your database architecture. It depends on what type of database server you are deploying or monitoring in your environment. Most database servers though share the same concept and approaches especially when monitoring. The purpose of monitoring is to determine the state and health of your database especially on its reactive process during such certain changes. Now, let’s dig in and determine what are these types of alarms that we have to be notified of.
Database Service Availability
This is an obvious take here. After installing your database, obviously you have to try logging in or check if the process or daemon service is running. Now check if the port is open and you are able to connect locally. Most importantly, you have to determine if the server is allowed to run such that permissions are correct, the number of processes in a particular operating system user is allowed by the OS kernel, or the package is correctly configured and installed.
Network Availability
We’re literally talking of distributed databases here which literally means of socket-aware, port-aware, and network-aware database service. Most monitoring software does check the database availability over the network and that does mean that the host of your database server has its firewall and ports properly opened and configured in order to monitor it. For example, ClusterControl is a type of database management and monitoring software for which one of the methods to monitor a node is over the network such as SSH to collect data and health information. Then, it notifies you if the server is disconnected or server is back online.
Cluster Health
A healthy database cluster means that it can process the expected transactional events. This means that it can process both read and write requests. If either of the two can cause a problem, then this means that there is a particular fatal problem. In such a case, a fatal problem means that it can lead to data corruption or data inconsistency which deals with a lot of time and effort to fix the problem. Hence, there are certain occurrences that it was set by a DBA incorrectly such as forgot to set the read_only variable in MySQL in the /etc/my.cnf configuration file, or a PostgreSQL server has still its recovery and standby files.
Database Health
The database health includes not only the state of being online or availability. It has a lot of things covered. For example, in MySQL/PostgreSQL/MongoDB, this involves replication lag, lock contention, data inconsistency, duplicate indexes, etc.. Such that the health state is also covered how the performance of your database and wrong configurations that can affect the health and performance of your database. It also covers security and intrusion alarms that shall detect either a misconfiguration or requires upgrade to the latest patch or database version.
Operating System and Host Health
The Operating System and Host Health covers those CPU and memory usage or contention as one of the common areas covered. Alarms also covers the misconfiguration of kernel parameters that can affect the performance of the database. For example, vm.swappiness, fs.file-max, kernel.pid_max, kernel.threads-max, vm.max_map_count, or HugePages parameters.
Hardware Health
All parts of hardware that comprises the database server’s performance and health. You would not miss those health status such as your underlying data storage hardware (such as SSD, RAID, NVMe, or flash storage devices), memory health, or CPU health.
Backup State
Backups are taken on a specified period based on required or desired schedule. Backup policies not only cover the ability to run the backup with success or failure, it also covers other important things. These are compression, security, storage target, schedule to run, and backup performance.
Cluster or Node Recovery State
High availability in most setups and database environments are very common or usually a desired setup especially for production grade environments. Enterprise related technologies rely heavily on this setup so alarms and notifications have to be triggered. This allows the DBA’s or administrators to determine if there’s an urgency of actions required in case if it fails or succeeds.
Alarms and Notifications Management
Now that we have determined those alarms and notification health states. This has to be managed because it does not always require the technical people involved in the notification list. Usually, the people involved to be notified are those that have the skill to fix the problem and also people that have to determine the state of the overall technology stack of their database environment. With that said, you would not want your managers or EMT (Executive Management Team) to send false alarms.
False alarms are covered in case the predetermined state of your database cluster or servers are known. For example, preventive or preemptive maintenance is about to happen. Let say a scheduled script or tool is about to harvest collected tables that are heavily fragmented and these tables have to be defragmented on a per-scheduled basis. With that said, a fragmented table can compromise database performance issues such that it affects read and write ability. Worse, if the table is too big and is a hot table. When performing a database or table optimization, take note that it blocks transactions to that specific table under operation. In that case, maintenance for this case has to be signaled off or silence and it has to be filtered granularly. Remember that false alerts can also lead to catastrophic situations especially if you thought it is valid and a certain action has already been done.
Granular Alarm Filtration
As we determined the alarms earlier, it is best that a specific alarm has to be particular only on a specific type of issue. For example, in case a database is not reachable via tcp while socket is reachable, it doesn’t mean that database is offline or down. It can be due to a firewall or port not being opened either blocked or tcp issues are encountered (network is split or network is cut). This allows more targets specific on what action has to be taken since it’s not good to keep your monitoring software or tool to generally keep all silence. If all alarms are silent, then you are not able to determine what else has failed because your team or DBAs forgot to consider a specific area that it has to be monitored or it has to be taken care with high attention, in case such an issue occurs. If an issue occurs and is left unnoticeable, it can lead to a huge problem or demands time specific investigation and solution.
In most cases, maintenance has to be pre-determined which means it has been done, tested and has been carefully planned ahead of time before such maintenance is planned and set. Again, as said earlier, the most important thing with alarms and notifications is that it is best to avoid false alarms either being sent or unsent because of wrong setup such that being set disabled or enabled. So what’s the problem with that? Wrong actions taken can be made that can lead to a disaster or catastrophe. Worse case scenario, if the action taken is hard to be reverted and requires large downtime which can cause money and stressful hard work solution.
Using Management and Database Monitoring Solutions
ClusterControl is there to help you with ease and efficiency on handling maintenance and avoid catastrophe ahead of time. This software solution for database management and monitoring provides pre-emptive database maintenance which allows you to handle alarms efficiently and proficiently. Of course, you have to learn how to manage the software itself. In case of certain issues or problems occurs, Severalnines have provided community help forums for you to address the problems or even file a Zendesk ticket which would gladly provide you recommendations on what are the things to be done before deciding a preemptive maintenance set using ClusterControl.
With ClusterControl, the following types of alarms are covered:
- Cluster
- Cluster recovery
- Database health
- Database performance
- Host
- Node
- Network
- Backup
These alarms are sent as notifications when configured or setup via ClusterControl UI. See below,
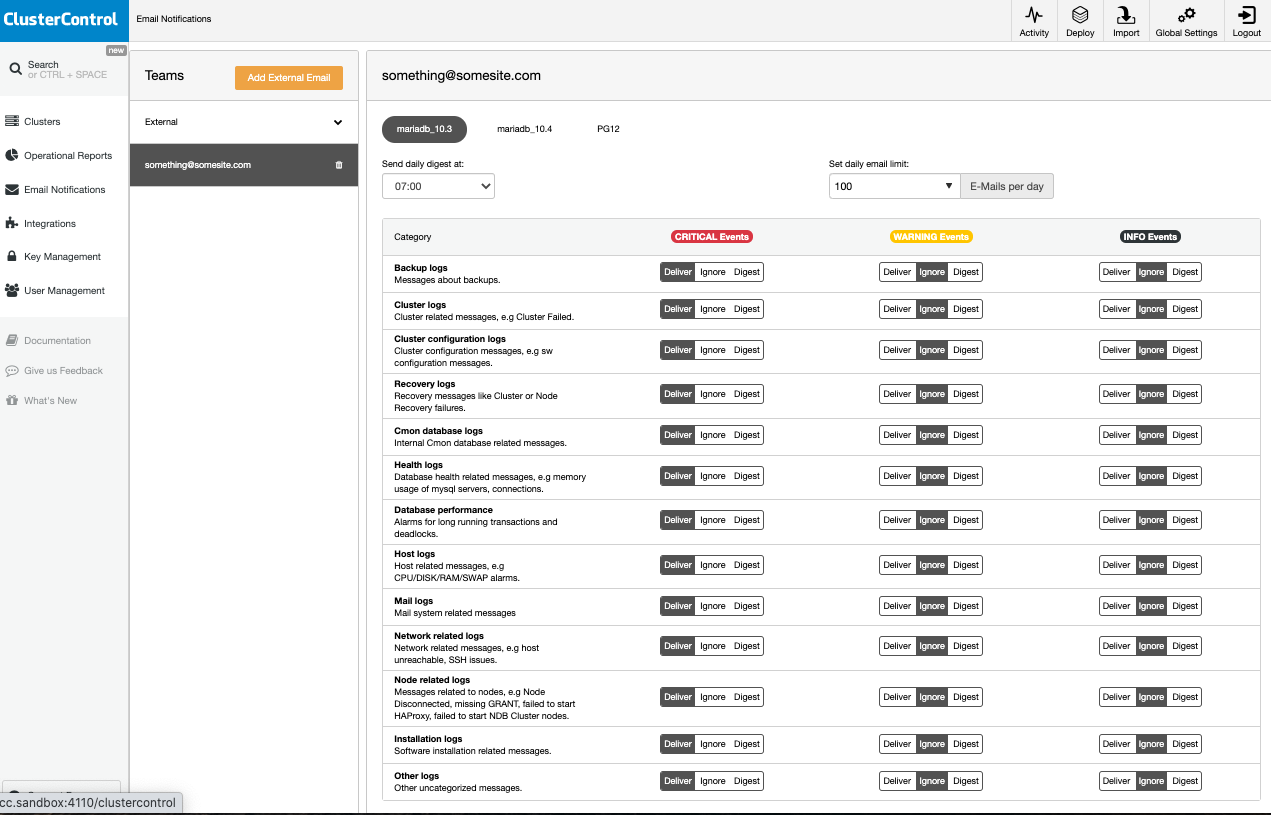
The categories are in fact set granularly. So for example, the first five categories shows about backups, clusters, recovery, and about cmon database logs. These notifications can be set per events either deliver, ignore, or digest. These categories comprises distinct alarms which will be sent or triggered proactively based on thresholds set. For example, ClusterControl will send an alarm for a backup failure or a backup success state. It will also send notifications for backup set in the schedule depending on what events are set as shown in the screenshot above. For cluster related logs, it will send granularly such that if a cluster recovery is running, a cluster goes degraded due to a master or primary node was set to read-only, or secondary node was set offline.
Also, the notifications can be set per cluster as you can see above.
There’s also the third party notifications, if any you have set or integrated through ClusterControl. So what does this mean? It allows you to silence alerts by setting it active or not. You can selectively specify which alarms will be allowed to be set. For example, see below:
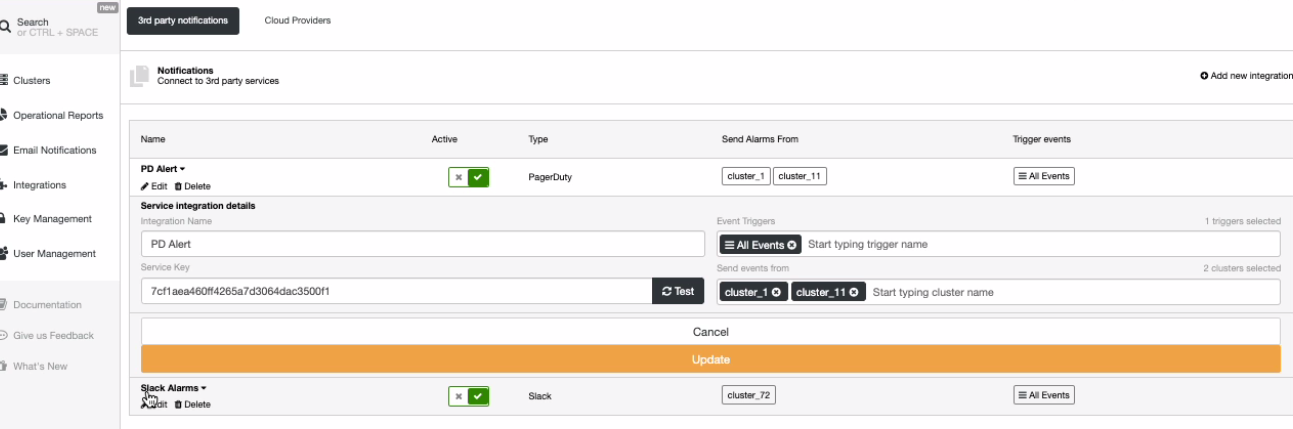
which also allows you to set the events for specific cluster like below,
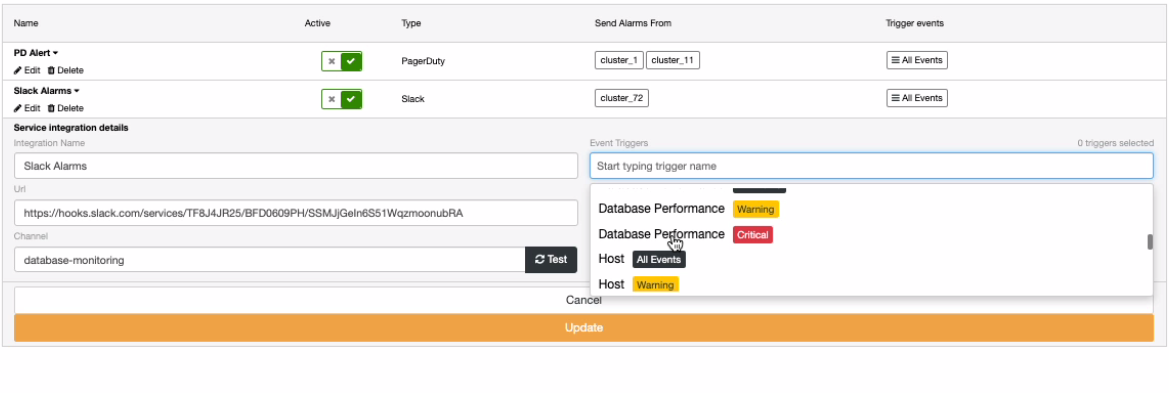
The two screenshots show different approaches. For example, in PagerDuty, you can set all events or for Slack, you can select what type has to be triggered.
Alarms can be ignored when sent as well, see below:
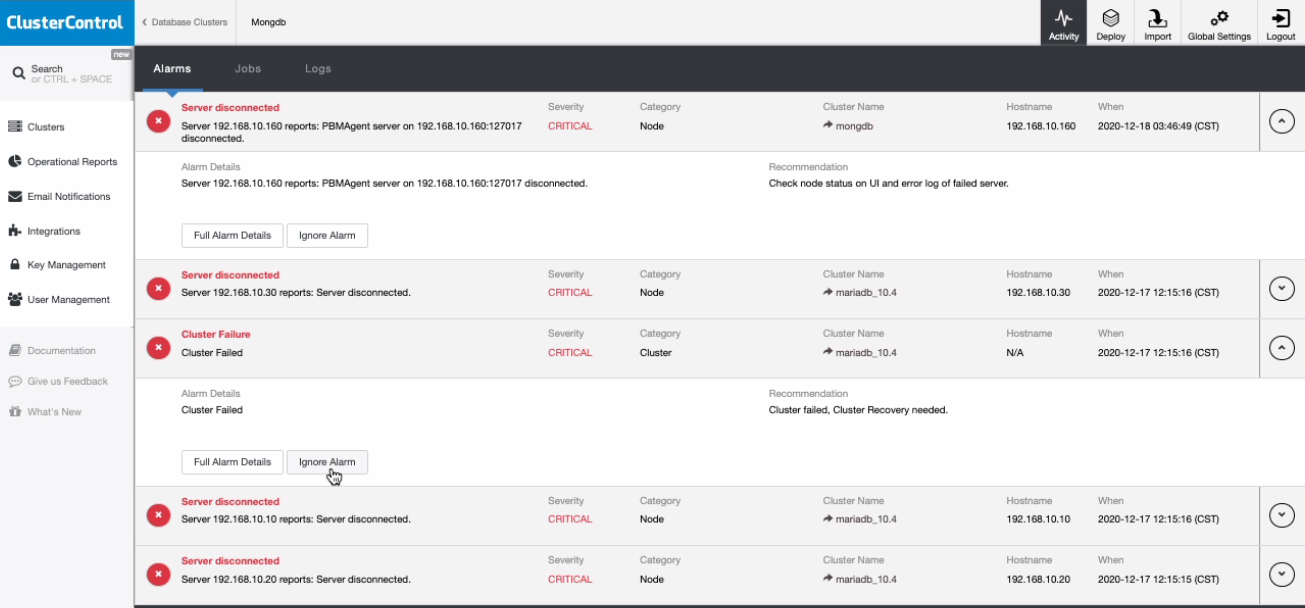
If you noticed, clicking the Ignore Alarm button will send the alarms to be hidden or ignored. This can be viewed in the cluster as well under the Cluster → Alarms tab as shown below:
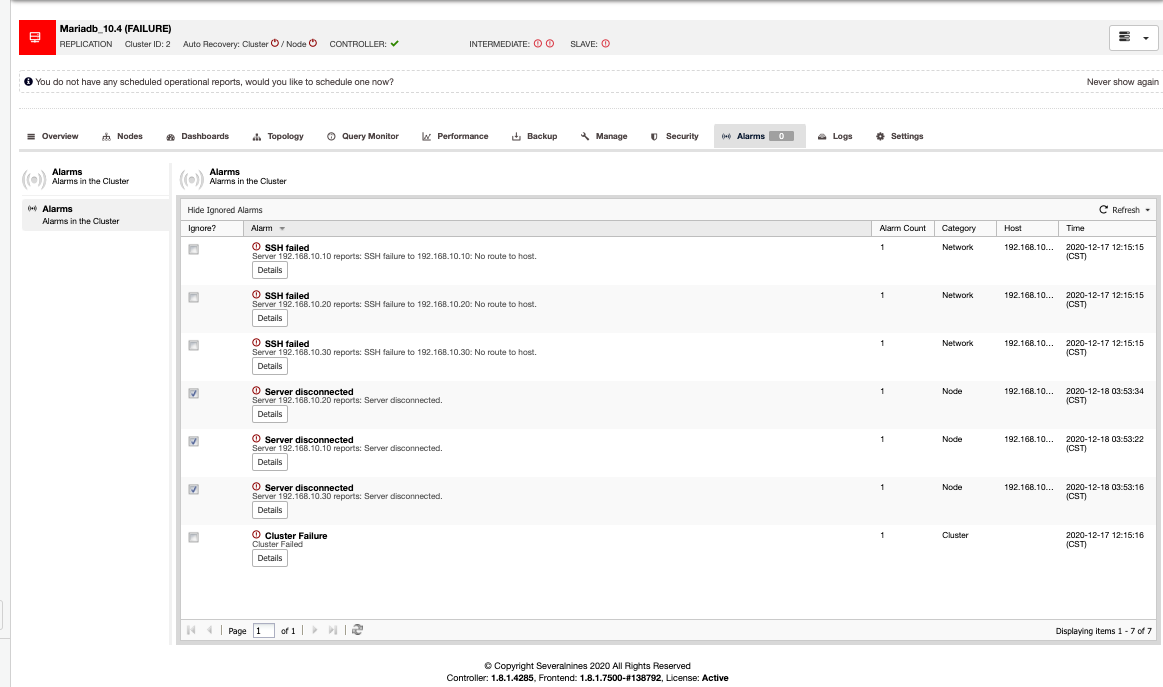
If you noticed closely, the ignored alarms are marked with “checked” or enabled checkboxes. It does notify you as well how many alarms count when the specific alarm has been triggered, what category, what host, and the time it was triggered.
Using The Command Line Interface (CLI)
ClusterControl has the s9s CLI which features a lot of advanced features you can do to manage your database such as backups, recovery, deployment to the cloud, and a lot more. But it also allows you to manage the alarms. It can view the list of alarms or ignore the alarms. You can hook it up using your favorite shell terminal and invoke using the following command below,
$ s9s alarms --cluster-id=2 --list

ID CID SEVERITY COMPONENT TYPE           HOSTNAME      TITLE

19   2 CRITICAL Network   HostSshFailed  192.168.10.10 SSH failed

20   2 CRITICAL Network   HostSshFailed  192.168.10.20 SSH failed

21   2 CRITICAL Network   HostSshFailed  192.168.10.30 SSH failed

25   2 CRITICAL Cluster   ClusterFailure -             Cluster Failure

Total: 7 alarm(s)
To view more options, you can run
$ s9s alarm --helpConclusion
The most important thing when enabling database alarms is to avoid false positives and avoid alarms that can cause extra work that leads to catastrophic results. If using software solutions, make sure that alarms sent can be granular and also allows you to silence feasibly and efficiently without any extra work and avoid false alarms.