blog
The Command Line Interface to ClusterControl

s9s is our official command line tool to interact with ClusterControl. We’re pretty excited about this, as we believe its ease of use and script-ability will make our users even more productive. Let’s have a look at how to use it. In this blog, we’ll show you how to use s9s to deploy and manage your database clusters.
ClusterControl v1.4.1 comes with an optional package called s9s-tools, which contains a binary called “s9s”. As most of you already know, ClusterControl provides a graphical user interface from where you can deploy, monitor and manage your databases. The GUI interacts with the ClusterControl Controller (cmon) via an RPC interface. The new CLI client is another way to interact with the RPC interface, by using a collection of command line options and arguments. At the time of writing, the CLI has support for a big chunk of the ClusterControl functionality and the plan is to continue to build it out. Please refer to ClusterControl CLI documentation page for more details. It is worth mentioning that the CLI is open source, so it is possible for anybody to add functionality to it.
As a side note, s9s is the backbone that drives the automatic deployment when running ClusterControl and Galera Cluster on Docker Swarm as shown in this blog post. You should take note that this tool is relatively new and comes with some limitations like different user management module and no support for Role Based Access Control.
Setting up the Client
Starting from version 1.4.1, the installer script will automatically install this package on the ClusterControl node. You can also install it on another computer or workstation to manage the database cluster remotely. All communication is encrypted and secure through SSH.
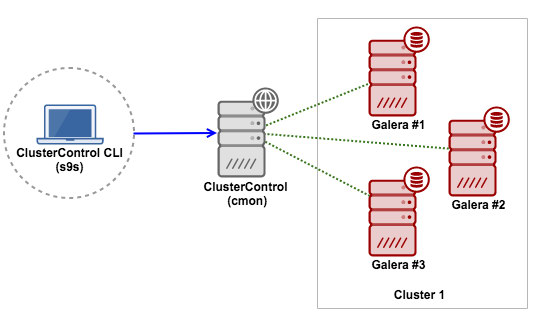
In this example, the client will be installed on another workstation running on Ubuntu. We are going to connect to the ClusterControl server remotely. Here is the diagram to illustrate this:
We have covered the installation and configuration steps in the documentation. Ensure you perform the following steps:
- On the ClusterControl host, ensure it runs on ClusterControl Controller 1.4.1 and later.
- On the ClusterControl host, ensure CMON RPC interface (port 9500 and 9501) is listening to an IP address that is routable to external network. Follow these steps.
- Install s9s-tools package on the workstation. Follow these installation steps.
- Configure the Remote Access. Follow these steps.
Take note that it is also possible to build the s9s command line client on other Linux distribution and Mac OS/X as described here. The command line client installs manual pages and can be viewed by entering the command:
$ man s9sDeploy Everything Through CLI
In this example, we are going to perform the following operations with the CLI:
- Deploy a three-node Galera Cluster
- Monitor state and process
- Create schema and user
- Take backups
- Cluster and node operations
- Scaling up/down
Deploy a three-node Galera Cluster
First, on the ClusterControl host, ensure we have setup passwordless SSH to all the target hosts:
(root@clustercontrol)$ ssh-copy-id 10.0.0.3
(root@clustercontrol)$ ssh-copy-id 10.0.0.4
(root@clustercontrol)$ ssh-copy-id 10.0.0.5
Then, from the client workstation:
(client)$ s9s cluster --create --cluster-type=galera --nodes="10.0.0.3;10.0.0.4;10.0.0.5" --vendor=percona --provider-version=5.7 --db-admin-passwd="mySecr3t" --os-user=root --cluster-name="PXC_Cluster_57" --waitWe defined “–wait” which means the job will run in the foreground and wait for the job to complete. It will return 0 for a successful job or non-zero if the job fails. To let this process run as a background job, just omit this flag.
Then, you should see the progress bar:
Create Galera Cluster
 Job  1 RUNNING    [▊       ]  26% Installing MySQL on 10.0.0.3
The same progress can be monitored under Activity (top menu) of the ClusterControl UI:
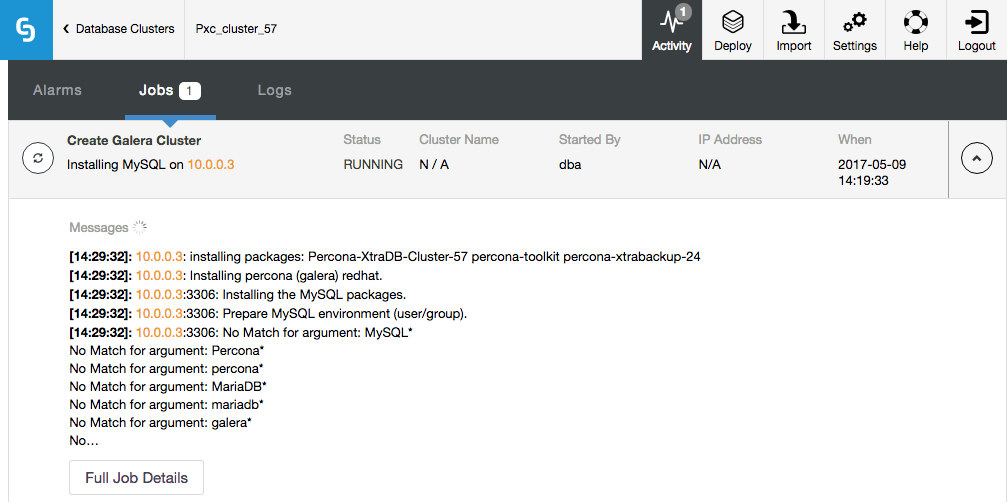
Notice that the job was initiated by user ‘dba’, which is our command line remote user.
Monitor state and process
There are several ways to look for the cluster. You can simply list out the cluster with –list:
$ s9s cluster --list --long
ID STATE   TYPE   OWNER GROUP NAME           COMMENT
 1 STARTED galera dba   users PXC_Cluster_57 All nodes are operational.
Total: 1
Also, there is another flag called –stat for a more detailed summary:
$ s9s cluster --stat
    Name: PXC_Cluster_57                      Owner: dba/users
      ID: 1                                   State: STARTED
    Type: GALERA                             Vendor: percona 5.7
  Status: All nodes are operational.
  Alarms:  0 crit   1 warn
    Jobs:  0 abort  0 defnd  0 dequd  0 faild  2 finsd  0 runng
  Config: '/etc/cmon.d/cmon_1.cnf'
Take note that you can use cluster ID or name value as the identifier when manipulating our Galera Cluster. More examples further down.
To get an overview of all nodes, we can simply use the “node” command option:
$ s9s node --list --long
ST  VERSION         CID CLUSTER        HOST      PORT COMMENT
go- 5.7.17-13-57      1 PXC_Cluster_57 10.0.0.3  3306 Up and running
go- 5.7.17-13-57      1 PXC_Cluster_57 10.0.0.4  3306 Up and running
go- 5.7.17-13-57      1 PXC_Cluster_57 10.0.0.5  3306 Up and running
co- 1.4.1.1834        1 PXC_Cluster_57 10.0.0.7  9500 Up and running
go- 10.1.23-MariaDB   2 MariaDB_10.1   10.0.0.10 3306 Up and running
go- 10.1.23-MariaDB   2 MariaDB_10.1   10.0.0.11 3306 Up and running
co- 1.4.1.1834        2 MariaDB_10.1   10.0.0.7  9500 Up and running
gr- 10.1.23-MariaDB   2 MariaDB_10.1   10.0.0.9  3306 Failed
Total: 8
s9s allows you to have an aggregated view of all processes running on all nodes. It can be represented in a real-time format (similar to ‘top’ output) or one-time format (similar to ‘ps’ output). To monitor live processes, you can do:
$ s9s process --top --cluster-id=1
PXC_Cluster_57 - 04:27:12                                           All nodes are operational.
4 hosts, 16 cores,  6.3 us,  0.7 sy, 93.0 id,  0.0 wa,  0.0 st,
GiB Mem : 14.8 total, 2.9 free, 4.6 used, 0.0 buffers, 7.2 cached
GiB Swap: 7 total, 0 used, 7 free,

PID   USER   HOST     PR  VIRT      RES    S   %CPU   %MEM COMMAND
 4623 dba    10.0.0.5 20  5700352   434852 S  20.27  11.24 mysqld
 4772 dba    10.0.0.4 20  5634564   430864 S  19.99  11.14 mysqld
 2061 dba    10.0.0.3 20  5780688   459160 S  19.91  11.87 mysqld
  602 root   10.0.0.7 20  2331624    38636 S   8.26   1.00 cmon
  509 mysql  10.0.0.7 20  2613836   163124 S   0.66   4.22 mysqld
...
Similar to top command, you can get a real-time summary for all nodes under this cluster. The first line tells us the cluster name, current time and the cluster state. The second, third and fourth lines are accumulated resources of all nodes in the cluster combined. In this example, we used 4 hosts (1 ClusterControl + 3 Galera), each has 4 cores, ~4 GB RAM and around 2GB swap.
To list out processes (similar to ps output) of all nodes for cluster ID 1, you can do:
$ s9s process --list --cluster-id=1
PID   USER   HOST     PR  VIRT      RES    S   %CPU   %MEM COMMAND
 2061 dba    10.0.0.3 20  5780688   459160 S  25.03  11.87 mysqld
 4623 dba    10.0.0.5 20  5700352   434852 S  23.87  11.24 mysqld
 4772 dba    10.0.0.4 20  5634564   430864 S  20.86  11.14 mysqld
  602 root   10.0.0.7 20  2331624    42436 S   8.73   1.10 cmon
  509 mysql  10.0.0.7 20  2613836   173688 S   0.66   4.49 mysqld
...
You can see there is another column called “HOST”, which represents the host where the process is running. This centralized view approach will surely save you time, so you do not have to get individual outputs for each node and then compare them.
Create database schema and user
Now we know our cluster is ready and healthy. We can then create a database schema:
$ s9s cluster --create-database --cluster-name='PXC_Cluster_57' --db-name=db1
Database 'db1' created.
The command below does the same thing but using the cluster ID as the cluster identifier instead:
$ s9s cluster --create-database --cluster-id=1 --db-name=db2
Database 'db2' created.
Then, create a database user associated with this database together with proper privileges:
$ s9s cluster --create-account --cluster-name='PXC_Cluster_57' --account='userdb1:[email protected].%' --privileges='db1.*:SELECT,INSERT,UPDATE,DELETE,INDEX,CREATE'
Account 'userdb1' created.
Grant processed: GRANT SELECT, INSERT, UPDATE, DELETE, INDEX, CREATE ON db1.* TO 'userdb1'@'10.0.0.%'
You can now import or start to work with the database.
Take backups with mysqldump and Xtrabackup
Creating a backup is simple. You just need to decide which node to backup and the backup method. The storage location by default will be located on the controller node, unless you specify the –on-node flag. If the backup destination directory does not exist, ClusterControl will create it for you.
Backup completion time varies depending on the database size. It’s good to let the backup job run in the background:
$ s9s backup --create --backup-method=mysqldump --cluster-id=1 --nodes=10.0.0.5:3306 --backup-directory=/storage/backups
Job with ID 4 registered.
The ID for the backup job is 4. We can list all jobs by simply listing them out:
$ s9s job --list
ID CID STATE    OWNER  GROUP  CREATED  RDY  COMMENT
 1   0 FINISHED dba    users  06:19:33 100% Create Galera Cluster
 2   1 FINISHED system admins 06:33:48 100% Galera Node Recovery
 3   1 FINISHED system admins 06:36:04 100% Galera Node Recovery
 4   1 RUNNING3 dba    users  07:21:30   0% Create Backup
Total: 4
The job list tells us that there is a running job with state RUNNING3 (job is running on thread #3). You can then attach to this job if you would like to monitor the progress:
$ s9s job --wait --job-id=4
Create Backup
 Job  4 RUNNING3   [    █     ] ---% Job is running
Or, inspect the job messages using the –log flag:
$ s9s job --log --job-id=4
10.0.0.5:3306: Preparing for backup - host state (MYSQL_OK) is acceptable.
10.0.0.7: creating backup dir: /storage/backups/BACKUP-1
10.0.0.5:3306: detected version 5.7.17-13-57.
Extra-arguments be passed to mysqldump:  --set-gtid-purged=OFF
10.0.0.7: Starting nc -dl 9999 > /storage/backups/BACKUP-1/mysqldump_2017-05-09_072135_mysqldb.sql.gz 2>/tmp/netcat.log.
10.0.0.7: nc started, error log: 10.0.0.7:/tmp/netcat.log.
Backup (mysqldump, storage controller): '10.0.0.5: /usr/bin/mysqldump --defaults-file=/etc/my.cnf --flush-privileges --hex-blob --opt   --set-gtid-purged=OFF  --single-transaction --skip-comments --skip-lock-tables --skip-add-locks --databases mysql |gzip  - | nc 10.0.0.7 9999'.
10.0.0.5: MySQL >= 5.7.6 detected, enabling 'show_compatibility_56'
A progress message will be written every 1 minutes
...
The same applies to xtrabackup. Just change the backup method accordingly. The supported values are xtrabackupfull (full backup) and xtrabackupincr (incremental backup):
$ s9s backup --create --backup-method=xtrabackupfull --cluster-id=1 --nodes=10.0.0.5:3306 --backup-directory=/storage/backups
Job with ID 6 registered.
Take note that an incremental backup requires that there is already a full backup made of the same databases (all or individually specified), else the incremental backup will be upgraded to a full backup.
You can then list out the backups created for this cluster:
$ s9s backup --list --cluster-id=1 --long --human-readable
ID CID STATE     OWNER HOSTNAME CREATED  SIZE FILENAME
 1   1 COMPLETED dba   10.0.0.5 07:21:39 252K mysqldump_2017-05-09_072135_mysqldb.sql.gz
 1   1 COMPLETED dba   10.0.0.5 07:21:43 1014 mysqldump_2017-05-09_072135_schema.sql.gz
 1   1 COMPLETED dba   10.0.0.5 07:22:03 109M mysqldump_2017-05-09_072135_data.sql.gz
 1   1 COMPLETED dba   10.0.0.5 07:22:07  679 mysqldump_2017-05-09_072135_triggerseventsroutines.sql.gz
 2   1 COMPLETED dba   10.0.0.5 07:30:20 252K mysqldump_2017-05-09_073016_mysqldb.sql.gz
 2   1 COMPLETED dba   10.0.0.5 07:30:24 1014 mysqldump_2017-05-09_073016_schema.sql.gz
 2   1 COMPLETED dba   10.0.0.5 07:30:44 109M mysqldump_2017-05-09_073016_data.sql.gz
 2   1 COMPLETED dba   10.0.0.5 07:30:49  679 mysqldump_2017-05-09_073016_triggerseventsroutines.sql.gz
Omit the “–cluster-id=1” option and to see the backup records for all your clusters.
Cluster and node operations
Performing a rolling restart (one node at a time) can be done with a single command line:
$ s9s cluster --rolling-restart --cluster-id=1 --wait
Rolling Restart
| Job  9 RUNNING    [███       ]  31% Stopping 10.0.0.4
For configuration management, we can get a list of configuration options defined inside a node’s my.cnf, and pipe the stdout to grep for filtering:
$ s9s node --list-config --nodes=10.0.0.3 | grep max_
MYSQLD      max_heap_table_size                    64M
MYSQLD      max_allowed_packet                     512M
MYSQLD      max_connections                        500
MYSQLD      wsrep_max_ws_rows                      131072
MYSQLD      wsrep_max_ws_size                      1073741824
mysqldump   max_allowed_packet                     512M
Let’s say we would like to reduce the max_connections. Then, we can use the “node” command option to perform the configuration update as shown in the following example:
$ s9s node --change-config --nodes=10.0.0.3 --opt-group=mysqld --opt-name=max_connections --opt-value=200
Variable 'max_connections' set to '200' and effective immediately.
Persisted change to configuration file /etc/my.cnf.
$ s9s node --change-config --nodes=10.0.0.4 --opt-group=mysqld --opt-name=max_connections --opt-value=200
Variable 'max_connections' set to '200' and effective immediately.
Persisted change to configuration file /etc/my.cnf.$ s9s node --change-config --nodes=10.0.0.5 --opt-group=mysqld --opt-name=max_connections --opt-value=200
Variable 'max_connections' set to '200' and effective immediately.
Persisted change to configuration file /etc/my.cnf.As stated in the job response, the changes are effective immediately. So it is not necessary to perform a node restart.
Scaling up and down
Adding a new database node is simple. First, setup a passwordless SSH to the new node:
(clustercontrol)$ ssh-copy-id 10.0.0.9Then, specify the node’s IP address or hostname together with the cluster identifier (assume we want to add the node into a cluster with ID=2):
(client)$ s9s cluster --add-node --nodes=10.0.0.9 --cluster-id=2 --wait
Add Node to Cluster
| Job  9 FINISHED   [██████████] 100% Job finished.
To remove a node, one would do:
$ s9s cluster --remove-node --nodes=10.0.0.9 --cluster-id=2
Job with ID 10 registered.
Summary
ClusterControl CLI can be nicely integrated with your infrastructure automation tools. It opens a new way to interact and manipulate your databases. It is completely open source and available on GitHub. Go check it out!