blog
Automating Security Audits for PostgreSQL

Security audits are a must in all companies to protect data and avoid any possible security breaches, but it is also a time-consuming task as you need to check a lot of things periodically. The result is that, in general, companies follow a security checklist and configure everything to cover it, but they don’t have security audits. You may say, “If everything is working fine, just keep it as it is”. Well, actually, you can’t trust that the security policies you are configuring now will be useful in the future, and that nothing will change to affect them. The solution for this could be automating these security audits or having a way to do it periodically in a user-friendly way.
In this blog, we will see how to perform different Security Audits for PostgreSQL and automate them using ClusterControl.
What do you need to do a security audit on PostgreSQL?
Let’s look at some of the most important things to audit for security purposes in a PostgreSQL database:
-
Communications: The communication in all your systems must be encrypted, and you must restrict traffic to that which comes only from known sources to reduce the risk of unauthorized access to your data.
-
Database Access: You need to restrict both physical and remote access to your databases. Remote access can be restricted by allowing connections only from known sources for each user, or even using SSH or VPN connections.
-
User Accounts: There are many ways to improve security for your user accounts in PostgreSQL, such as removing inactive users, granting only necessary privileges, etc.
-
Installation and Configuration: There are some changes to do to secure your PostgreSQL installation, such as installing only the necessary packages, changing the default credentials and configuration, etc.
-
Auditing and Logging: Logging statements can help you to detect security issues or avoid them if you catch them in time. You can use the standard PostgreSQL logging facility, but you can also use an extension like pgAudit to have more detailed logging.
-
Upgrades: Keep your OS and database as up-to-date as possible by applying patches and security upgrades.
-
Query Monitor: You should check the traffic to detect abnormal queries or DoS attacks.
-
Monitoring: To know the status of your systems, you will need to have a good monitoring system in place. This could be useful to find security issues or even to avoid them.
Now we know what to check, let’s look at an option to automate these tasks – ClusterControl.
Security Audits for PostgreSQL with ClusterControl
For PostgreSQL Security Audits, ClusterControl is a good option as it is a management and monitoring system that helps you to deploy, manage, monitor, and scale your databases from a user-friendly interface. It has support for the top open-source database technologies and you can automate many of the database tasks you have to perform regularly like adding and scaling new nodes, running backups and restores, and more.
Let’s look at how you can cover the previously mentioned security checks using ClusterControl.
Communications
In the security section (ClusterControl -> Select Cluster -> Security tab), you can enable SSL Encryption to encrypt the connections between the clients and the server.
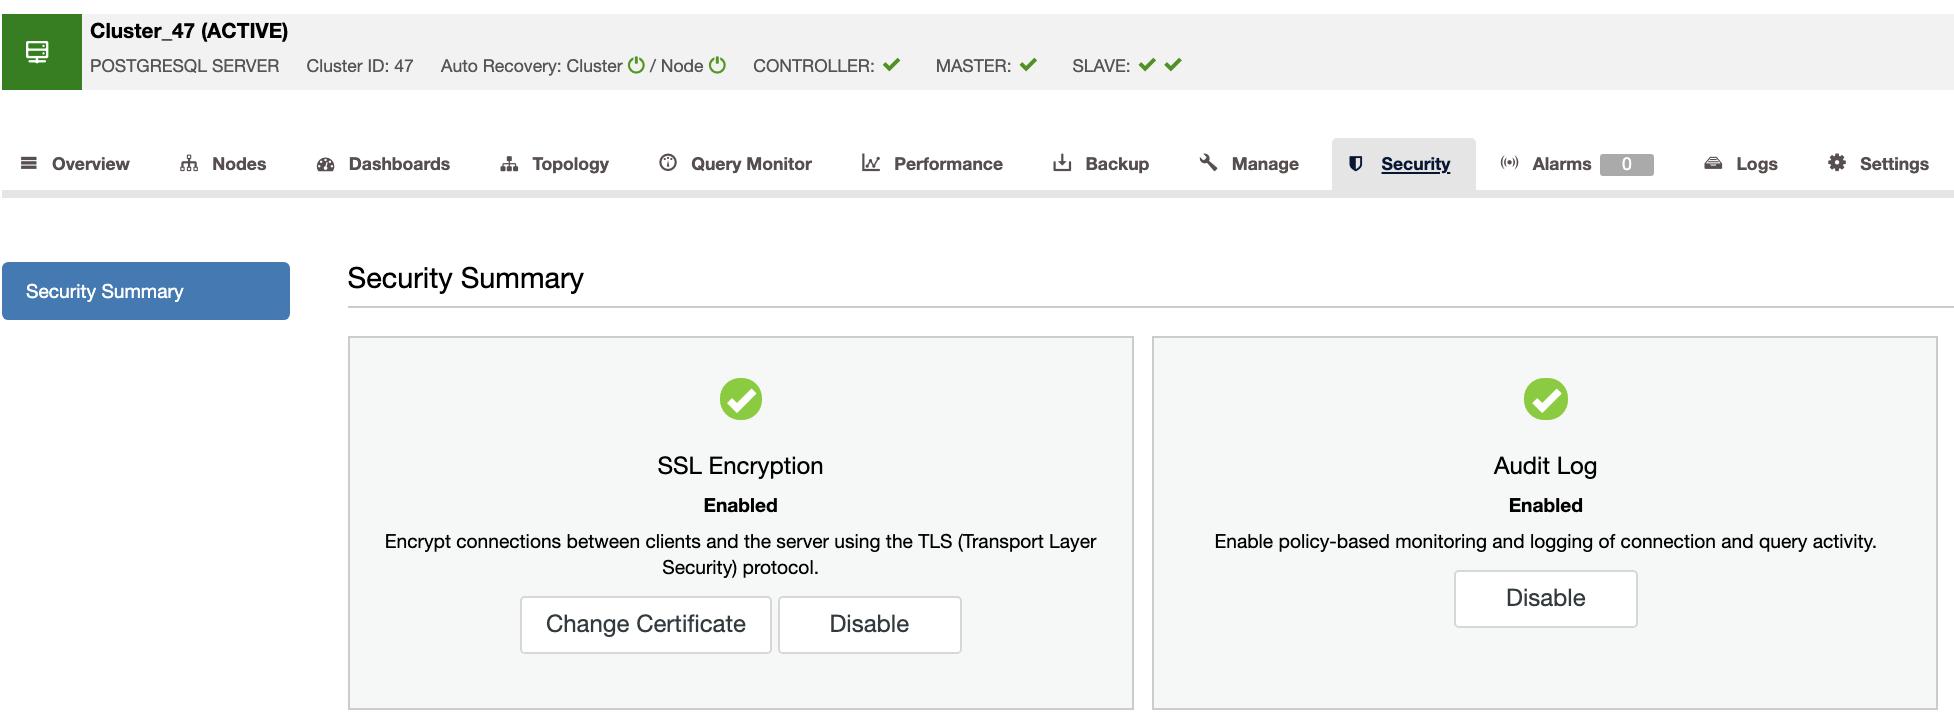
Access from ClusterControl to the nodes is also secured using passwordless SSH with a key pair.
Database Access
You can restrict access to your PostgreSQL database by modifying the pg_hba.conf configuration file from the ClusterControl UI (ClusterControl -> Select Cluster -> Manage -> Configurations). In this way, you can specify the following options:
-
Type: The most used options here are “local” for a Unix-domain socket, and “host” for a plain or SSL-encrypted TCP/IP socket, but there are other options like “hostssl”, and more.
-
Database: It can be “all”, “sameuser”, “samerole”, “replication”, a database name, or a comma-separated list of database names.
-
User: It can be “all”, a user name, a group name prefixed with “+”, or a comma-separated list thereof.
-
Address: Hostname, or an IP address and a CIDR mask.
-
Method: The most used here are “trust”, “reject”, “md5”, “ident”, and “peer”, but there are more options like “scram-sha-256” or “ldap”.
Example:
# TYPE  DATABASE        USER            ADDRESS                 METHOD
  host  all             admindb         10.10.10.121/32         md5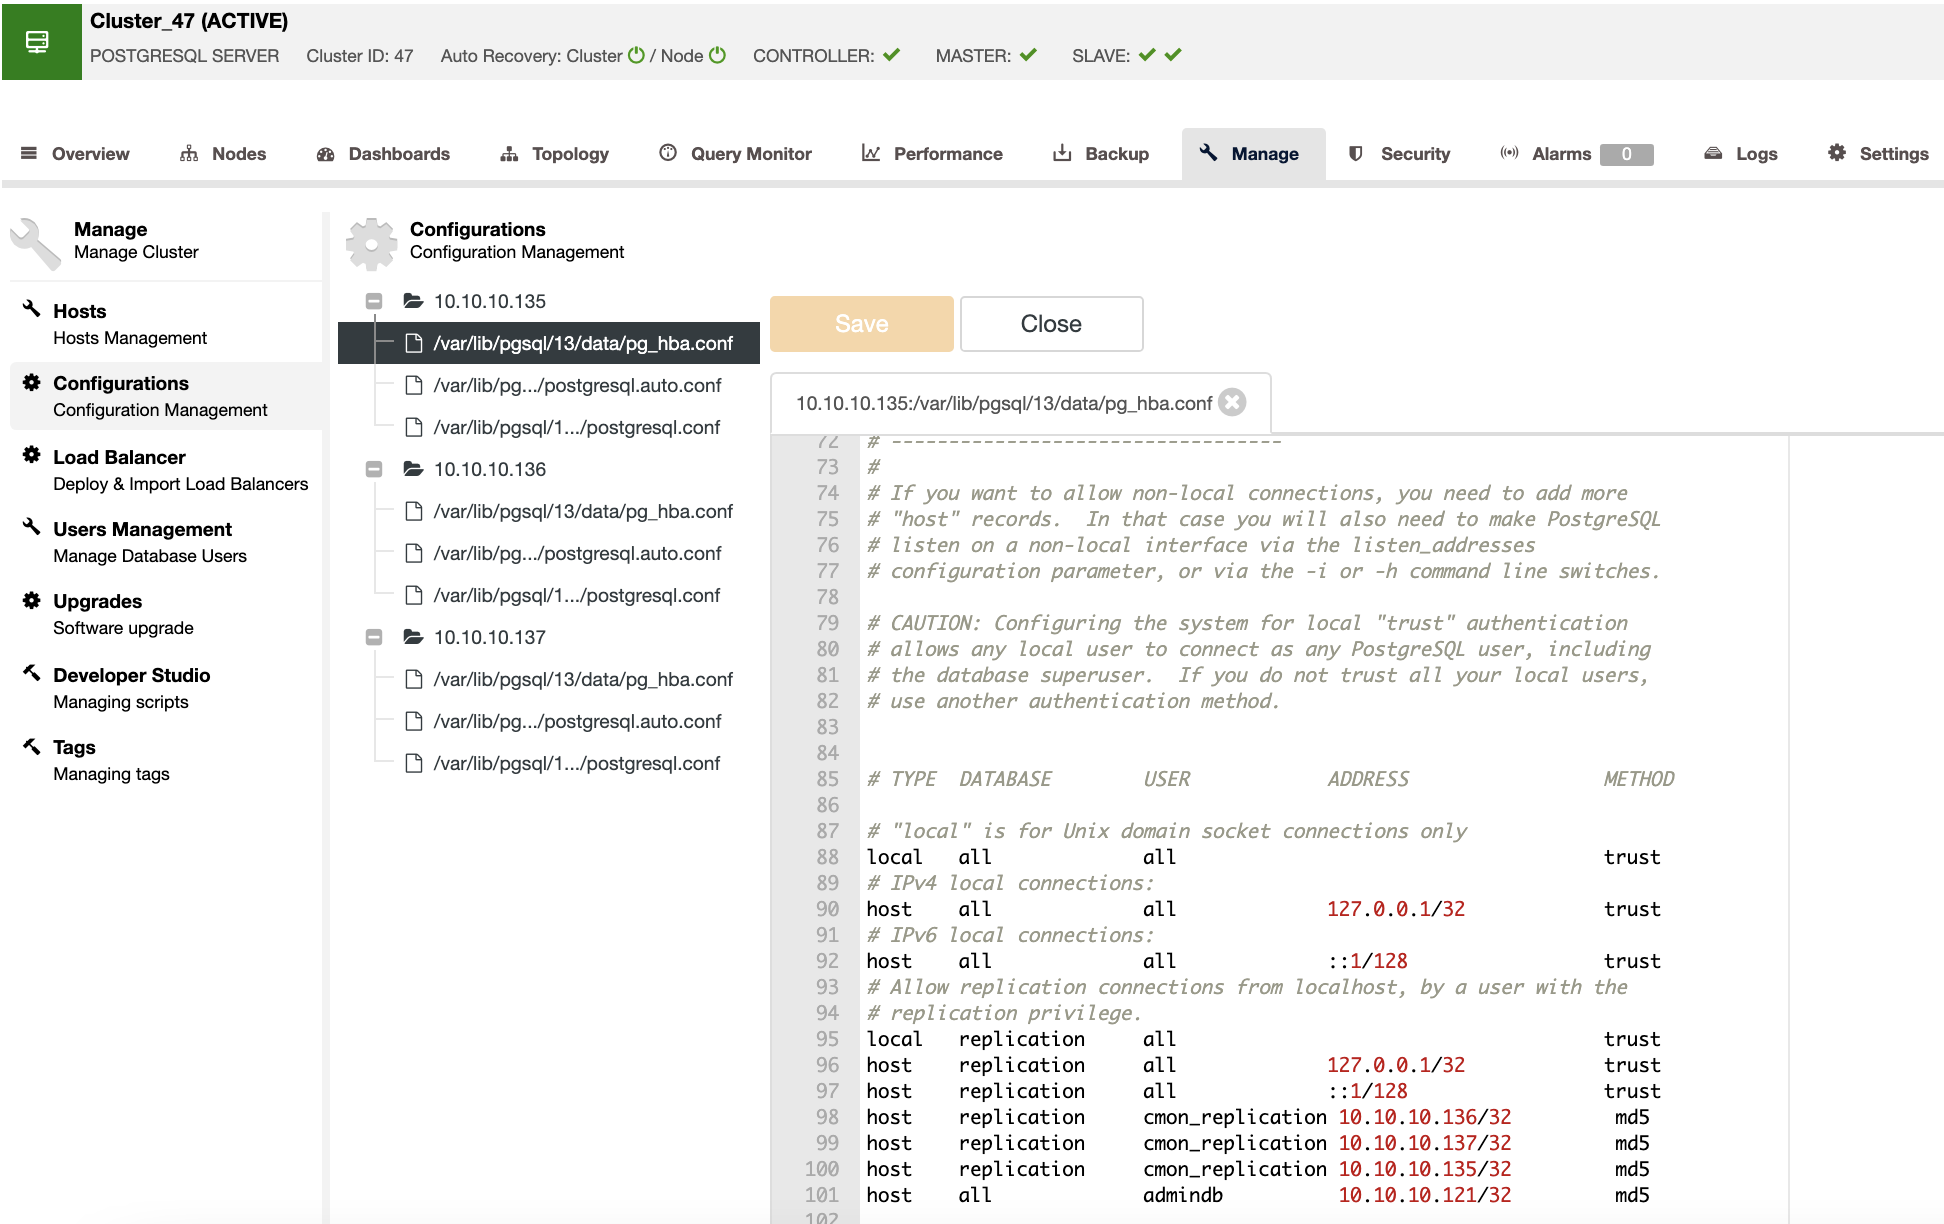
User Accounts
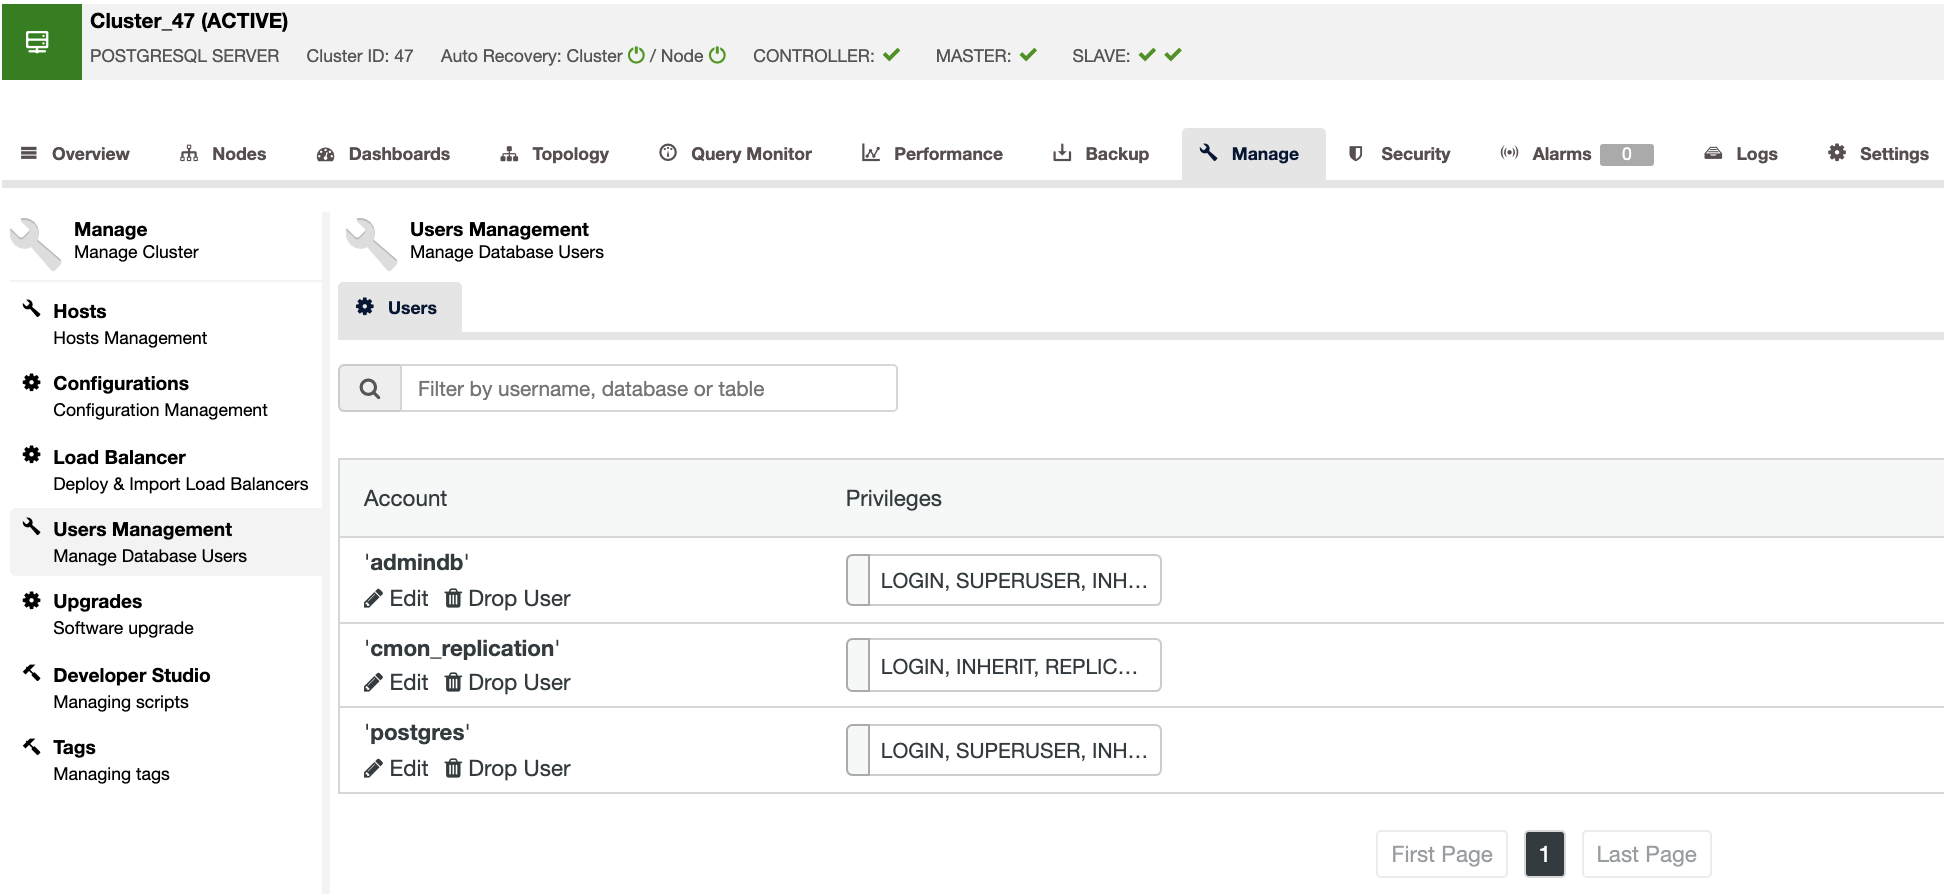
You can manage your database users from the ClusterControl UI (ClusterControl -> Select Cluster -> Manage -> User Management). You can create new users, or edit and delete existing ones, and assign the corresponding privileges to them.
Installation and Configuration
You can deploy a new PostgreSQL cluster or import an existing one. With your PostgreSQL cluster added into ClusterControl, you can manage the current configuration (ClusterControl -> Select Cluster -> Manage -> Configuration), or even add new nodes to the cluster.

During the deployment, you can modify the database configuration like database port or credentials, and then ClusterControl will install only the necessary packages to deploy your new cluster.
Auditing and Logging
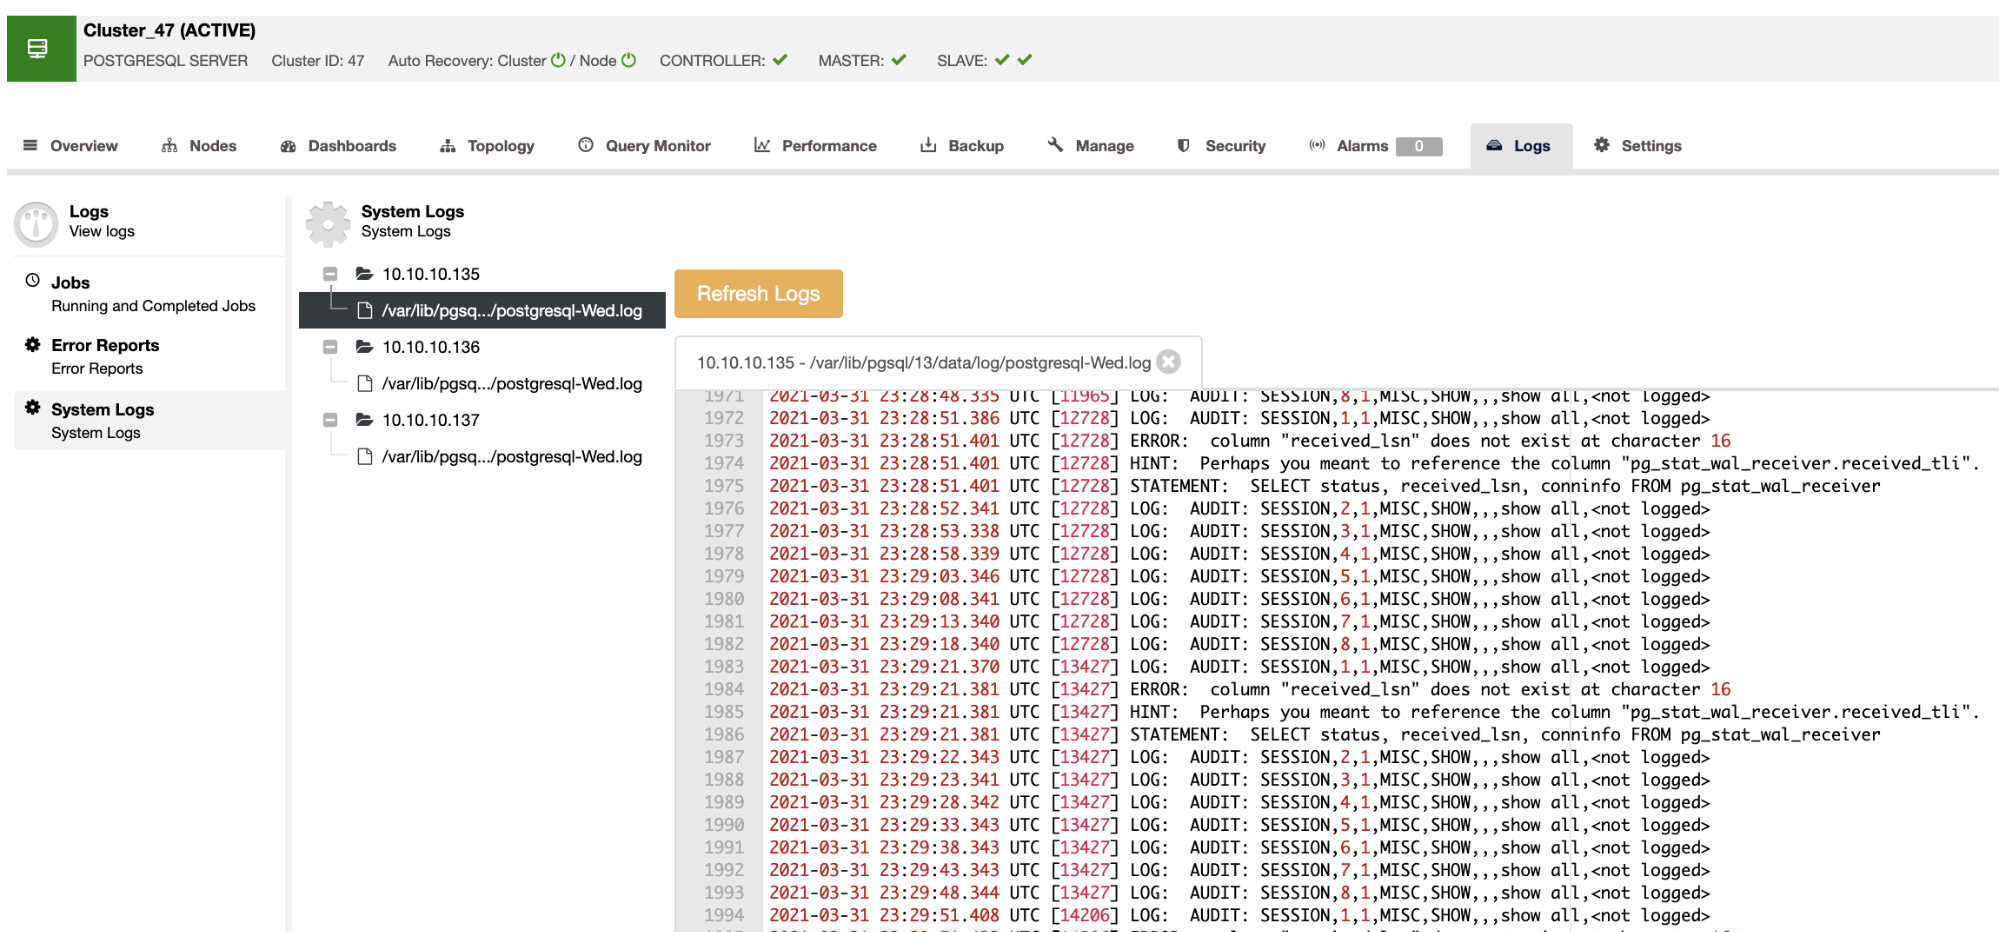
You can check the standard PostgreSQL logging in the ClusterControl UI (ClusterControl -> Select Cluster -> Logs -> System Logs) or even enable the pgAudit extension from ClusterControl and check the audit logging in the same place.
Upgrades
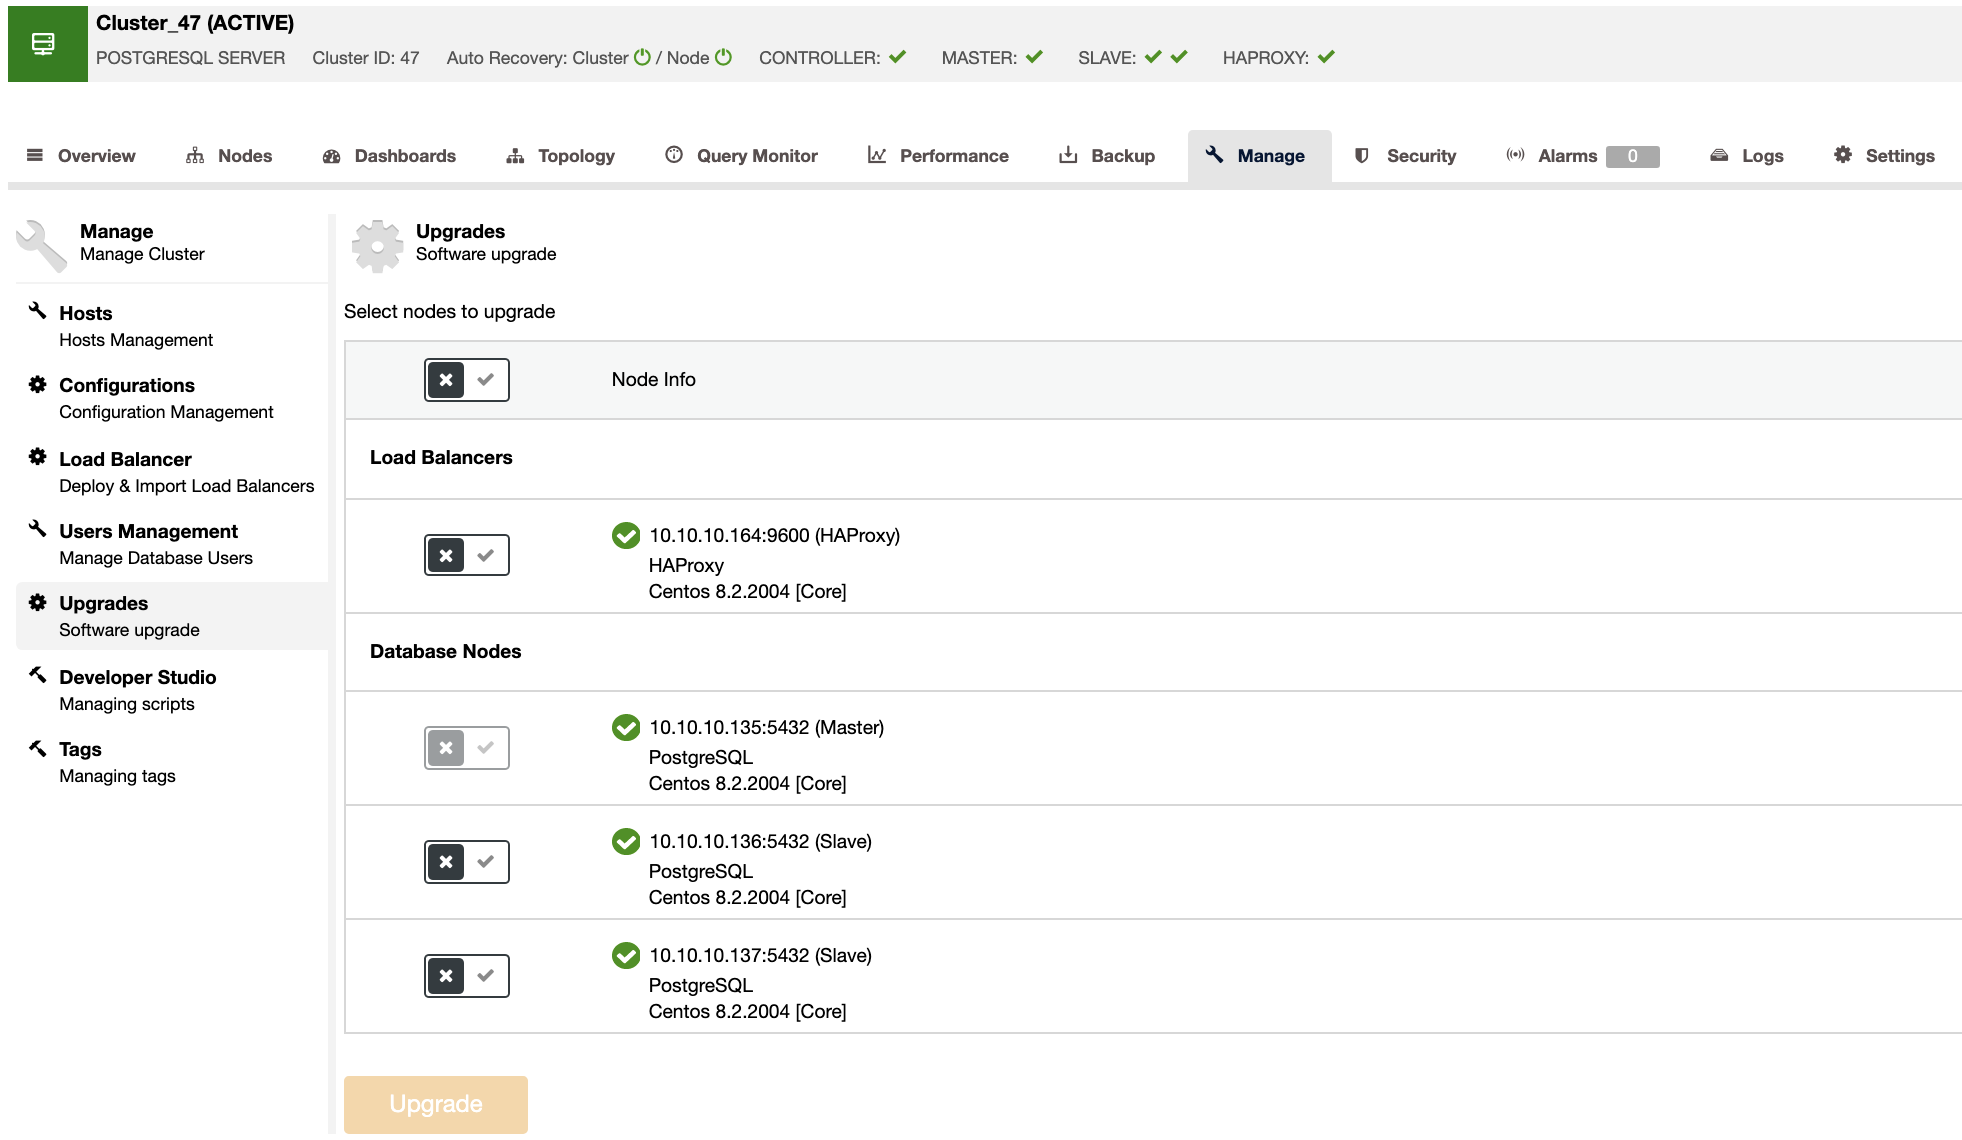
In the case of minor upgrades, you can use ClusterControl for this task. You can access the UI and run the upgrade (ClusterControl -> Select Cluster -> Manage -> Upgrades), or use the “Package Upgrades” ClusterControl Operational Report, to receive the available packages via email or check them in the ClusterControl UI.
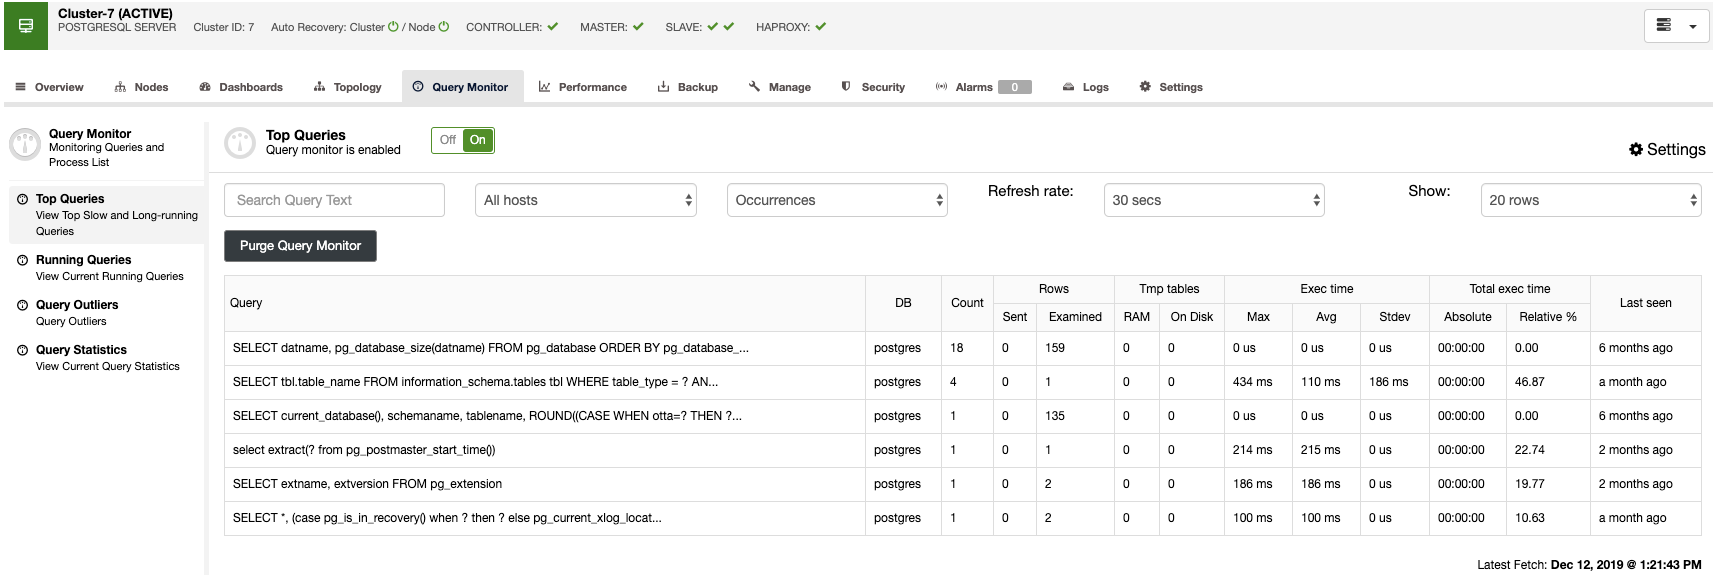
Query Monitor
In the query monitor section, you can find the top queries, running queries, query outliers, and query statistics to monitor your database traffic.
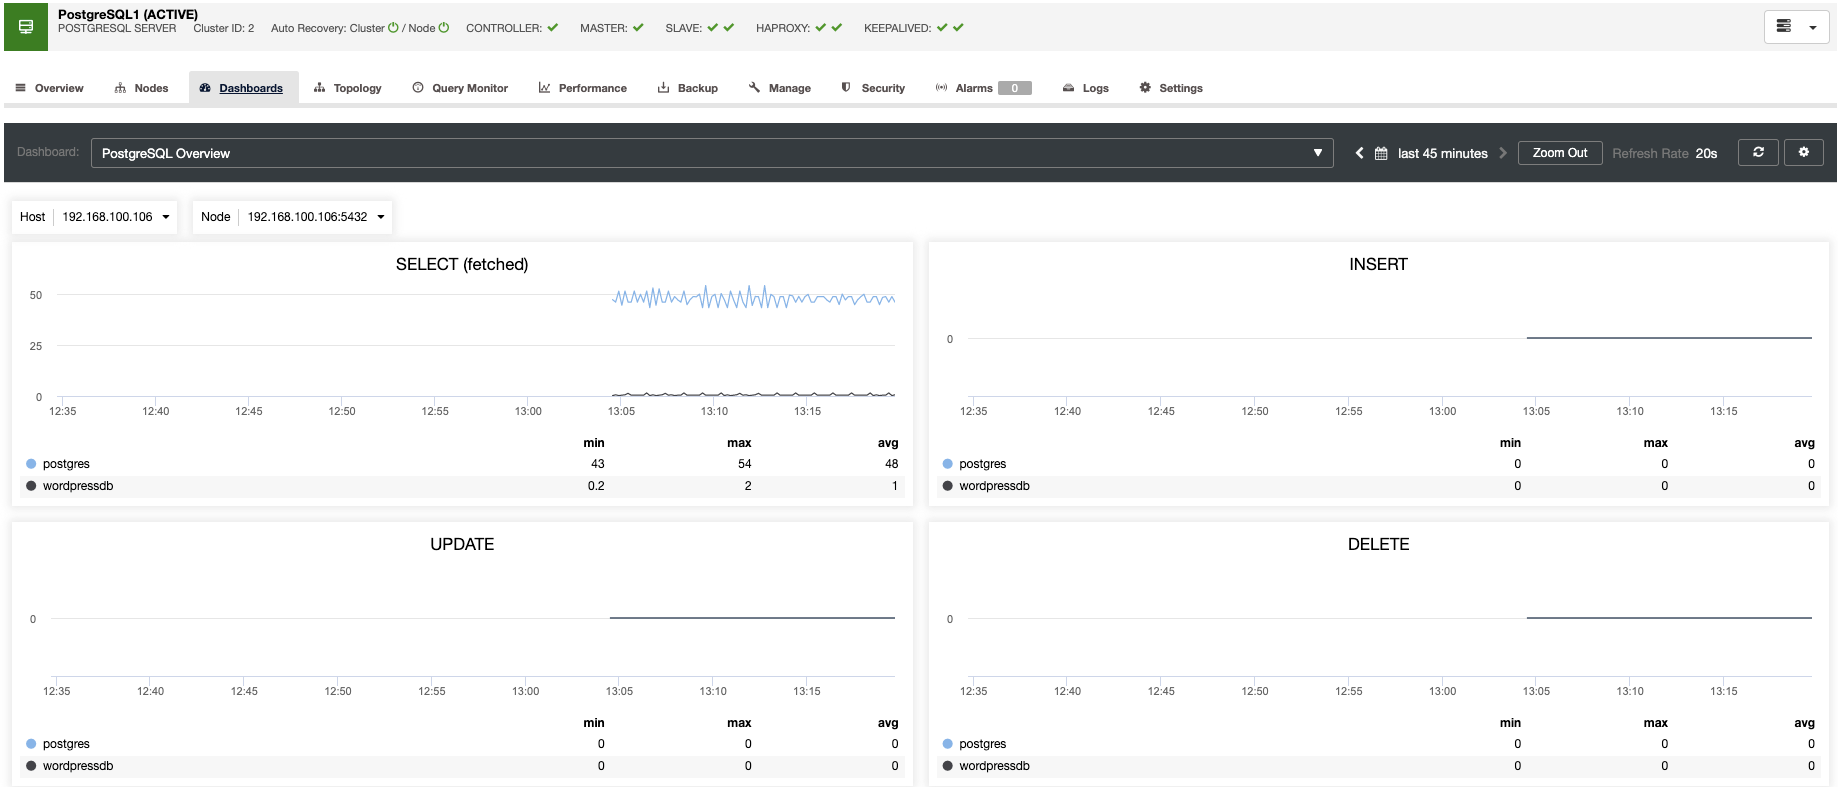
Monitoring
ClusterControl allows you to monitor your servers in real-time with a predefined set of dashboards to analyze some of the most common metrics.

ClusterControl allows you to customize the graphs available in the cluster, and you can enable the agent-based monitoring to generate more detailed dashboards.
You can also create alerts, which inform you of events in your cluster, or integrate with different services such as PagerDuty or Slack.

Operational Reports
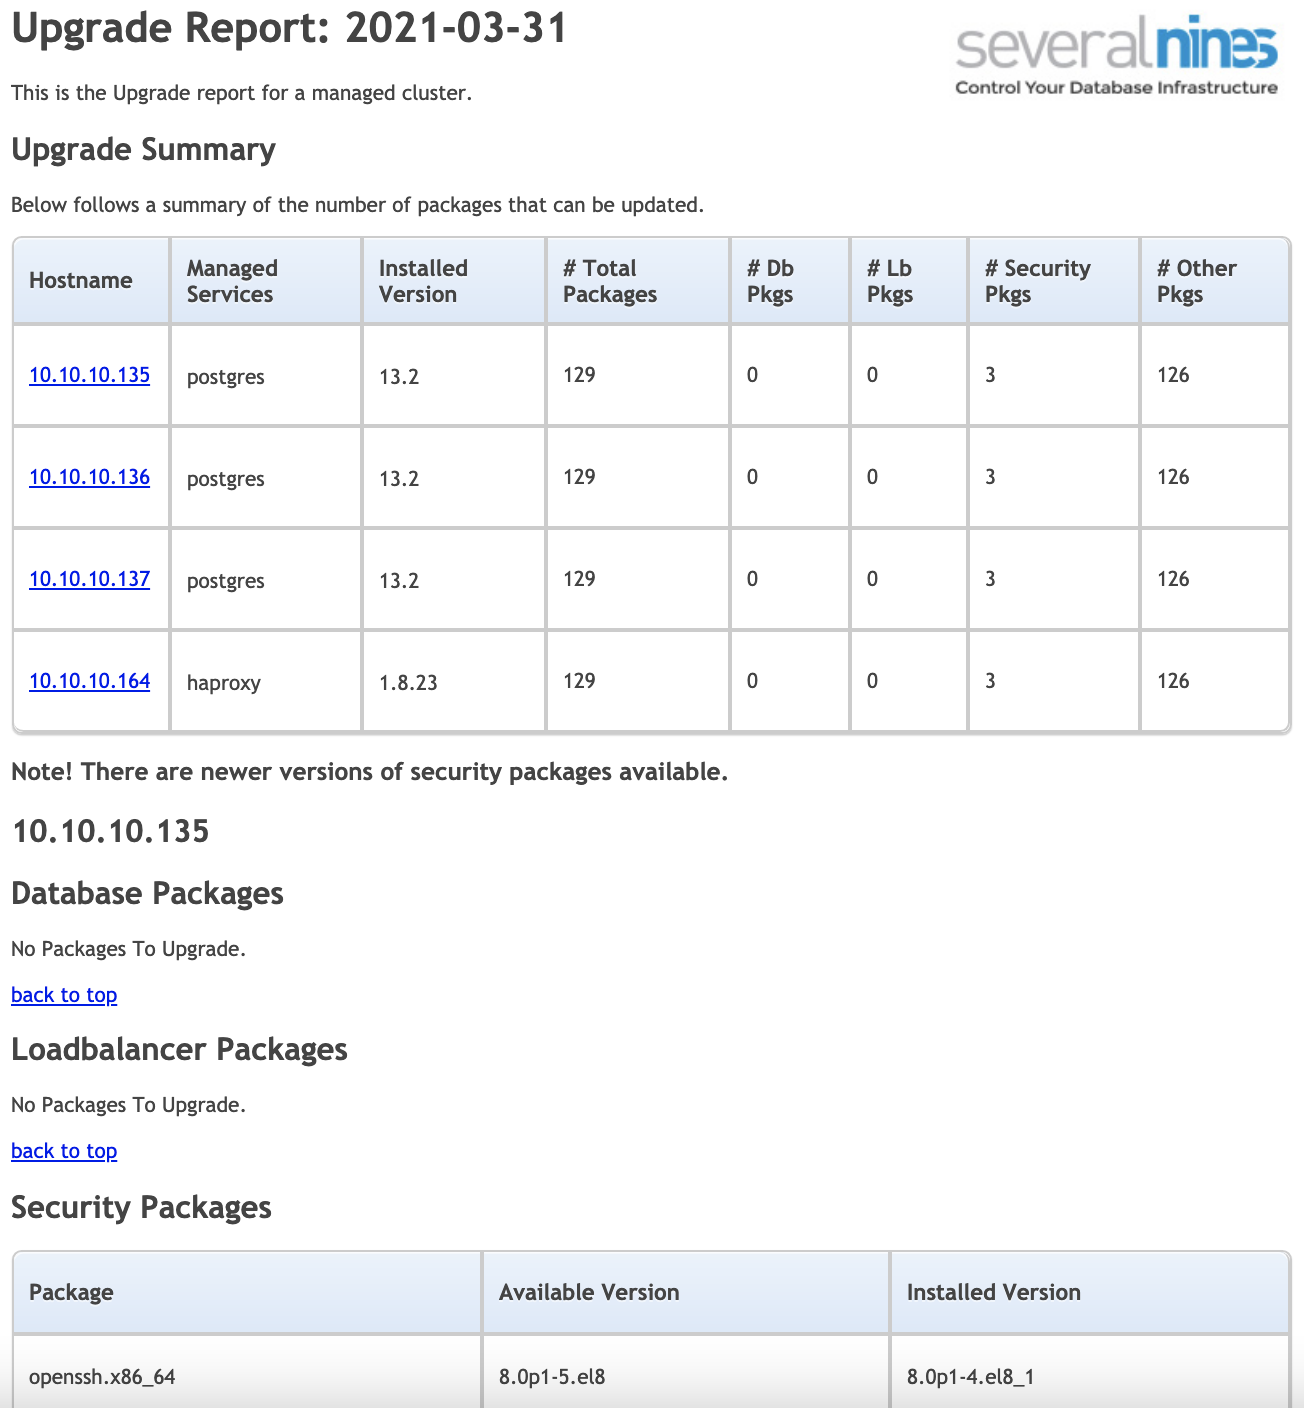
If you don’t want to access the ClusterControl UI to check the status of your clusters, you can create or schedule Operational Reports.
The Operational Reports give you information about your database status, which you can use to audit your environment. These reports consist of different checks and address various day-to-day DBA tasks. The idea behind ClusterControl Operational Reporting is to put all of the most relevant data into a single document that can be quickly analyzed in order to get a clear understanding of the status of the databases and their processes.
You can schedule reports like “Daily System Report,” “Package Upgrade Report,” “Schema Change Report”, “Backups”, and “Availability”, and you can receive them in more than one email address.
Using ClusterControl CLI for Automating Security Audits
ClusterControl CLI, also known as s9s, is a command-line tool introduced in ClusterControl version 1.4.1 to interact, control, and manage database clusters using the ClusterControl system. ClusterControl CLI opens a new door for cluster automation where you can easily integrate it with existing deployment automation tools like Ansible, Puppet, Chef, etc. The command-line tool is invoked by executing a binary called s9s added by default in the ClusterControl installation.
Let’s look at some examples of this powerful tool. For this, we will see how to perform the mentioned Security Audit tasks using the ClusterControl CLI.
Communications
You can enable SSL Encryption in your cluster using the following command:
$ s9s cluster --enable-ssl --cluster-id=IDWhere ID is the Cluster ID number: you can monitor the progress of this task (and the rest of the tasks) by listing the job process.
$ s9s job --listDatabase Access
You can check the database configuration to validate the allowed access:
$ s9s node --cluster-id=ID
--nodes="IP_ADDRESS:PORT"
--list-config

GROUP OPTION NAME                  VALUE
-     data_directory               '/var/lib/pgsql/13/data'
-     hba_file                     '/var/lib/pgsql/13/data/pg_hba.conf'
-     ident_file                   '/var/lib/pgsql/13/data/pg_ident.conf'
-     listen_addresses             '*'
-     port                         5432
-     max_connections              100
-     ssl                          on
-     ssl_ca_file                  '/etc/ssl/postgresql_single/cluster_47/server_ca.crt'
-     ssl_cert_file                '/etc/ssl/postgresql_single/cluster_47/server.crt'
...
Where ID is the Cluster ID number, IP_ADDRESS and PORT are your database IP Address and Port.
User Accounts
You can list the user accounts that are in the cluster:
$ s9s accounts --list --cluster-id=ID --long


NAME                            P CONN MAXC GRANTS
's9spostgresqlchk'@'%'          N    0    0 LOGIN,SUPERUSER,INHERIT,CREATEROLE,CREATEDB
'postgres'@'%'                  N    1    0 LOGIN,SUPERUSER,INHERIT,REPLICATION,CREATEROLE,CREATEDB
'pg_write_server_files'@'%'     N    0    0 INHERIT
...
'cmon_replication'@'%'          N    2    0 LOGIN,INHERIT,REPLICATION
'admindb'@'%'                   N    3    0 LOGIN,SUPERUSER,INHERIT,CREATEROLE,CREATEDB
Where ID is the Cluster ID number.
Installation and Configuration
You can create new clusters, add new database nodes, or even change the existing configurations in your cluster:
$ s9s cluster --create
--cluster-type=postgresql
--nodes="IP_ADDRESS1?master;IP_ADDRESS2?slave;IP_ADDRESS3?slave;"
--db-admin="DBUSER"
--db-admin-passwd="DBPASSWORD"
--cluster-name=PG1
--os-user=OSUSER
--os-key-file=/home/OSUSER/.ssh/id_rsa
--provider-version=13
--log
Where IP_ADDRESS is your database IP Address, and you need to replace DBUSER, DBPASSWORD , and OSUSER for your database credentials and operating system user respectively.
Auditing and Logging
You can enable audit logging from the command line using the following command:
$ s9s cluster --setup-audit-logging --cluster-id=IDWhere ID is the Cluster ID number: then, you can check the logs with the audit logging information.
Upgrades
You can create reports to see if you need to upgrade your databases or operating systems packages.
$ s9s report --cluster-id=ID --type=upgrade --createWhere ID is the Cluster ID number: based on this report, you can schedule maintenance windows to run the upgrades, and it can be done also from ClusterControl.
Query Monitor
You can check the process running on your nodes and filter them by the query, source, and more.
$ s9s process
--top-queries
--cluster-id=ID
--update-freq=1
'INSERT*'


$ s9s process
--list-queries
--cluster-id=ID
--client='IP_ADDRESS:*'
'INSERT*'
Monitoring
You have different options to monitor your systems from here. You can check the status for all the clusters, check one of them, or even check the alarms in real-time.
$  s9s cluster --list --long


ID STATE   TYPE              OWNER  GROUP  NAME         COMMENT
 1 STARTED postgresql_single system admins PostgreSQL Cluster All nodes are operational.
 2 FAILURE galera            system admins PXC57        Cluster failure.
 3 STARTED replication       system admins MariaDB104   All nodes are operational.
 4 STARTED mongodb           system admins MongoDB42    All nodes are operational.
Total: 4


$ s9s alarm --cluster-name="PostgreSQL Cluster" --list

ID  CID SEVERITY COMPONENT TYPE              HOSTNAME        TITLE
263   1 CRITICAL Network   HostSshFailed     haproxy1    SSH failed
264   1 CRITICAL Network   HostSshFailed     haproxy2    SSH failed
265   1 CRITICAL Network   HostSshFailed     postgresql2 SSH failed
266   1 CRITICAL Network   HostSshFailed     postgresql3 SSH failed
...
Operation Reports
You can create Operational Reports and check them from the command line. The same report is available in the ClusterControl UI.
$ s9s report --cluster-id=ID --type=default --createThese were just some basic examples to see the kind of things you can perform using the ClusterControl CLI. For more information about the tool, you can refer to the official documentation.
Conclusion
There is always a risk of being hacked, but you can close the vulnerability gap on your PostgreSQL cluster by checking the above-mentioned points. To make this task much easier, you can use the ClusterControl UI or even automate the checks with the ClusterControl CLI. It can also be integrated with external tools like Ansible, Puppet, and more.


