blog
What to Check if PostgreSQL Memory Utilization is High

Reading from memory will always be more performant than going to disk, so for all database technologies you would want to use as much memory as possible. If you are not sure about the configuration, or you have an error, this could generate high memory utilization or even an out-of-memory issue.
In this blog, we’ll look at how to check your PostgreSQL memory utilization and which parameter you should take into account to tune it. For this, let’s start by seeing an overview of PostgreSQL‘s architecture.
PostgreSQL Architecture
PostgreSQL‘s architecture is based on three fundamental parts: Processes, Memory, and Disk.
The memory can be classified into two categories:
- Local Memory: It is loaded by each backend process for its own use for queries processing. It is divided into sub-areas:
- Work mem: The work mem is used for sorting tuples by ORDER BY and DISTINCT operations, and for joining tables.
- Maintenance work mem: Some kinds of maintenance operations use this area. For example, VACUUM, if you’re not specifying autovacuum_work_mem.
- Temp buffers: It is used for store temporary tables.
- Shared Memory: It is allocated by the PostgreSQL server when it is started, and it is used by all the processes. It is divided into sub-areas:
- Shared buffer pool: Where PostgreSQL loads pages with tables and indexes from disk, to work directly from memory, reducing the disk access.
- WAL buffer: The WAL data is the transaction log in PostgreSQL and contains the changes in the database. WAL buffer is the area where the WAL data is stored temporarily before writing it to disk into the WAL files. This is done every some predefined time called checkpoint. This is very important to avoid the loss of information in the event of a server failure.
- Commit log: It saves the status of all transactions for concurrency control.
How to Know What is Happening
If you are having high memory utilization, first, you should confirm which process is generating the consumption.
Using the “Top” Linux Command
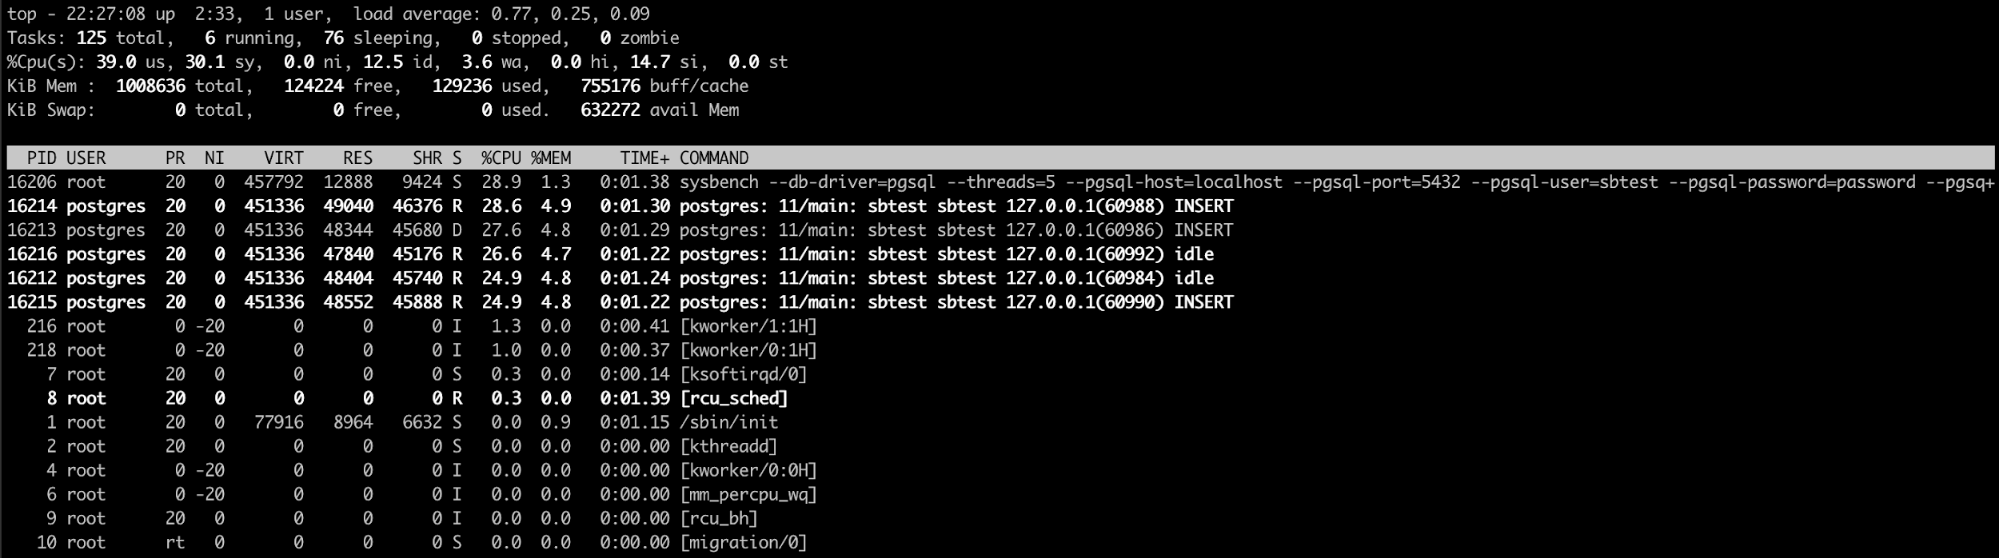
The top linux command is probably the best option here (or even a similar one like htop). With this command, you can see the process/processes that are consuming too much memory.
When you confirm that PostgreSQL is responsible for this issue, the next step is to check why.
Using the PostgreSQL Log
Checking both the PostgreSQL and systems logs is definitely a good way to have more information about what is happening in your database/system. You could see messages like:
Resource temporarily unavailable

Out of memory: Kill process 1161 (postgres) score 366 or sacrifice child
If you don’t have enough free memory.
Or even multiple database message errors like:
FATAL:  password authentication failed for user "username"

ERROR:  duplicate key value violates unique constraint "sbtest21_pkey"

ERROR:  deadlock detected
When you are having some unexpected behavior on the database side. So, the logs are useful to detect these kinds of issues and even more. You can automate this monitoring by parsing the log files looking for works like “FATAL”, “ERROR” or “Kill”, so you will receive an alert when it happens.
Using Pg_top
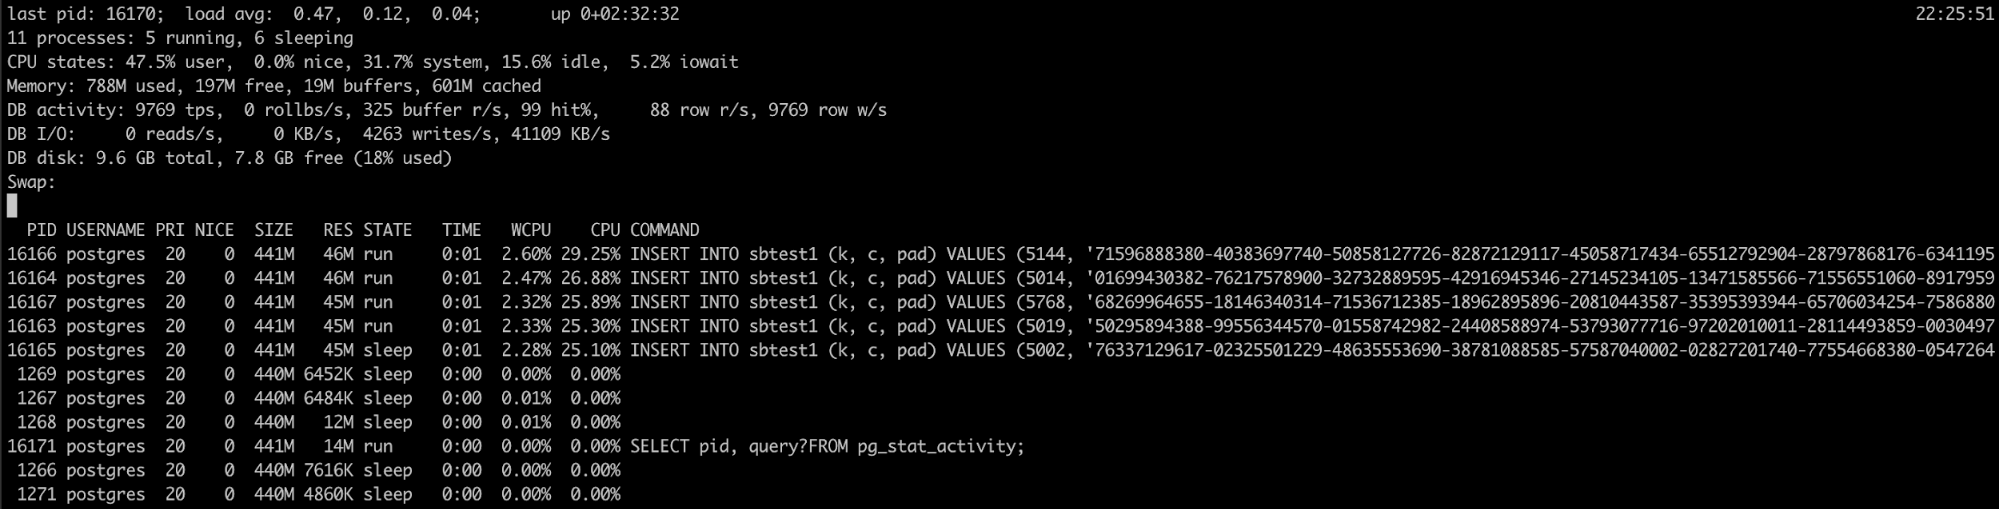
If you know that the PostgreSQL process is having a high memory utilization, but the logs didn’t help, you have another tool that can be useful here, pg_top.
This tool is similar to the top linux tool, but it’s specifically for PostgreSQL. So, using it, you will have more detailed information about what is running your database, and you can even kill queries, or run an explain job if you detect something wrong. You can find more information about this tool here.
But what happens if you can’t detect any error, and the database is still using a lot of RAM. So, you will probably need to check the database configuration.
Which Configuration Parameters to Take into Account
If everything looks fine but you still have the high utilization problem, you should check the configuration to confirm if it is correct. So, the following are parameters that you should take into account in this case.
shared_buffers
This is the amount of memory that the database server uses for shared memory buffers. If this value is too low, the database would use more disk, which would cause more slowness, but if it is too high, could generate high memory utilization. According to the documentation, if you have a dedicated database server with 1GB or more of RAM, a reasonable starting value for shared_buffers is 25% of the memory in your system.
work_mem
It specifies the amount of memory that will be used by the ORDER BY, DISTINCT and JOIN before writing to the temporary files on disk. As with the shared_buffers, if we configure this parameter too low, we can have more operations going into disk, but too high is dangerous for the memory usage. The default value is 4 MB.
max_connections
Work_mem also goes hand to hand with the max_connections value, as each connection will be executing these operations at the same time, and each operation will be allowed to use as much memory as specified by this value before it starts to write data in temporary files. This parameter determines the maximum number of simultaneous connections to our database, if we configure a high number of connections, and don’t take this into account, you can start having resource issues. The default value is 100.
temp_buffers
The temporary buffers are used to store the temporary tables used in each session. This parameter sets the maximum amount of memory for this task. The default value is 8 MB.
maintenance_work_mem
This is the max memory that an operation like Vacuuming, adding indexes or foreign keys can consume. The good thing is that only one operation of this type can be run in a session, and is not the most common thing to be running several of these at the same time in the system. The default value is 64 MB.
autovacuum_work_mem
The vacuum uses the maintenance_work_mem by default, but we can separate it using this parameter. We can specify the maximum amount of memory to be used by each autovacuum worker here.
wal_buffers
The amount of shared memory used for WAL data that has not yet been written to disk. The default setting is 3% of shared_buffers, but not less than 64kB nor more than the size of one WAL segment, typically 16MB.
Conclusion
There are different reasons to have a high memory utilization, and detecting the root issue could be a time-consuming task. In this blog, we mentioned different ways to check your PostgreSQL memory utilization and which parameter should you take into account to tune it, to avoid excessive memory usage.