blog
Dynamic Monitoring of PostgreSQL Instances Using pg_top

Monitoring PostgreSQL can, at times, be like trying to wrangle cattle in a thunderstorm. Applications connect and issue queries so quickly, it’s hard to see what’s going on or even get a good overview of the performance of the system other than the typical developer complaining ‘things are slow, help!’ kind of requests.
In previous articles, we’ve discussed how to Get to the Source when PostgreSQL is acting slow, but when the source is specifically queries, basic level monitoring may not be enough for assessing what’s going on in an active live environment.
Enter pg_top, a PostgreSQL specific program to monitor real time activity in a database, as well as view basic information for the database host itself. Much like the linux command ‘top’, running it brings the user into a live interactive display of database activity on the host, refreshing automatically in intervals.
Installation
Installing pg_top can be done in the generally expected ways: package managers and source install. The most recent version as of this article is 3.7.0.
Package Managers
Based on the distribution of linux in question, search for pgtop or pg_top in the package manager, it’s likely available in some aspect for the installed version of PostgreSQL on the system.
Red Hat based distros:
# sudo yum install pg_topGentoo based distros:
# sudo apt-get install pgtopSource
If desired, pg_top can be installed via source from the PostgreSQL git repository. This will provide any version desired, even newer builds that are not yet in the official releases.
Features
Once installed, pg_top works as a very accurate real time view into the database it is monitoring and using the command line to run ‘pg_top’ will launch the interactive PostgreSQL monitoring tool.
The tool itself can help shed light on all processes currently connected to the database.
Running pg_top
Launching pg_top is the same as the unix / linux style ‘top’ command itself, along with connection information to the database.
To run pg_top on a local database host:
pg_top -h localhost -p 5432 -d severalnines -U postgresTo run pg_top on a remote host, the flag -r or –remote-mode is required, and the pg_proctab extension installed on the host itself:
pg_top -r -h 192.168.1.20 -p 5432 -d severalnines -U postgresWhat’s on the screen
When launching pg_top, we see a display with quite a bit of information.
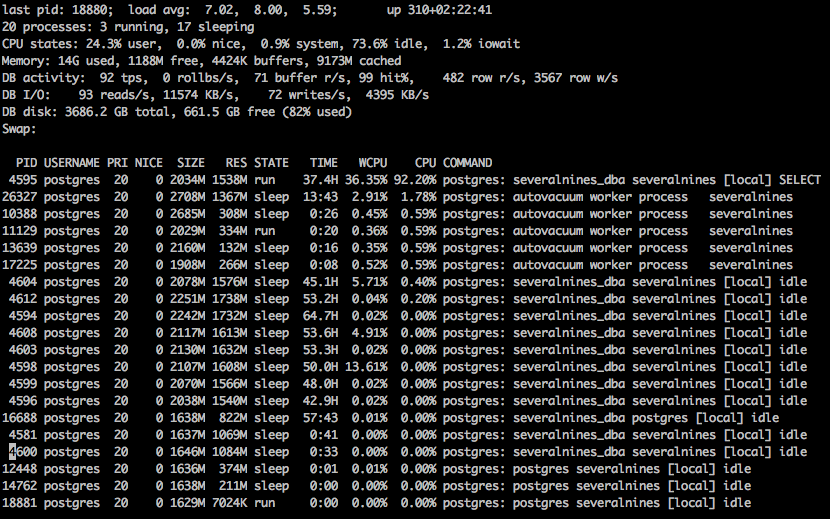
Load Average:
Like the standard top command, this load average for 1, 5, and 15 minutes intervals.
Uptime:
The total amount of time the system has been online since the latest reboot.
Processes:
The total number of database processes connected, with a number of how many are running and how many are sleeping.
CPU Stats:
The statistics of the CPU, showing the percentage load for user, system, and idle, nice information as well as iowait percentages.
Memory:
The total amount of memory used, free, in buffers and cached.
DB Activity:
The stats for database activity such as the transactions per second, number of rollbacks per second, buffers read per second, buffers hit per second, number of rows read per second, and rows written per second.
DB I/O Activity:
The activity for Input Output on the system, showing how many reads and writes per second, as well as the amount read and written per second.
DB Disk Stats:
The total size of the database disk, as well as how much free space.
Swap:
The information about swap space used, if any.
Processes:
A list of processes connected to the database, including any autovacuum type of internal processes. The list includes the pid, priority, the nice amount, resident memory used, the state of the connection, the number of cpu seconds used, cpu percentage, and the current command the process is running.
Useful Interactive Features
There are a handful of interactive features in pg_top that can be accessed while it is running. A full list can be found by entering a ?, which will bring up a help screen with all the different options available.
Planner Information
E – Execution Plan A – EXPLAIN ANALYZE (UPDATE/DELETE safe) Q – Show current query of a process I – Shows I/O statistics per process (Linux only) L – Shows locks held by a process R – Show user table statistics. X – Show user index statistics Sorting the display can be done through any of the following characters. The following are entries specified after pressing o, allowing sorting of the index, table, and i/o stat pages as well. k – kill processes specified r – renice a process (local database only, root only) Example: “renice 1 7004” The general use for pg_top is the interactive mode, allowing us to see what queries are running on a system that’s experiencing slowness issues, run explain plans on those queries, renice important queries to get them to complete quicker, or kill any queries causing major slowdowns. Generally, it allows the database administrator to do much of the same things that can be done manually on the system, but in a quicker and all in one option. While it’s not too common, pg_top can be run in ‘batch mode’, which will display the main information discussed to standard out, then exit. This can be scripted up to run at certain intervals, then sent to any custom process desired, parsed, and alerts generated based on what the administrator may want to be alerted on. For example, if the load of the system gets too high, if there is a higher than expected transactions per second value, anything a creative program can figure out. Generally, there are other tools to gather and report on this information, but having more options is always a good thing, and with having more tools available, the best options can be found. Much like the previous usage, proactive usage, we can script up pg_top in a batch mode to log snapshots of what the database looks like over time. This can be as simple as writing it to a text file with a timestamp, or parsing it and storing the date in a relational database to generate reports. This would allow for more information to be found after a major incident, such as a database crash at 4 AM. The more data available, the more likely issues can be found. Documentation for the project is fairly limited, and most information is available in the linux man page, found by running ‘man pg_top’. The PostgreSQL community can help with questions or issues through the PostgreSQL Mailing Lists, or the official IRC Chatroom found on freenode, channel name #postgresql.
Entering E will provide a prompt for a process ID for which to show an explain plan. This is equivalent to running “EXPLAIN
Entering A will provide a prompt for a process ID for which to show an EXPLAIN ANALYZE plan. This is equivalent to running “EXPLAIN ANALYZE Process Information
Entering Q will provide a prompt for a process ID for which to show the full query.
Entering I switches the process list to an I/O display, showing each process reads, writes, etc to disk.
Entering L will provide a prompt for a process ID for which to show held locks. This will include the database, the table, the type of lock, and whether or not the lock has been granted. Useful for when exploring long running or waiting processes.Relation Information
Entering R shows table stats including sequential scans, index scans, INSERTs, UPDATEs, and DELETEs, all relevant to the recent activity.
Entering X shows index stats including index scans, index reads, and index fetches, all relevant to the recent activity.Sorting
M – Sort by memory usage
N – Sort by pid
P – Sort by CPU usage
T – Sort by time
o – Specify sort order (cpu, size, res, time, command)
index stats (idx_scan, idx_tup_fetch, idx_tup_read)
table stats (seq_scan, seq_tup_read, idx_scan, idx_tup_fetch, n_tup_ins, n_tup_upd, n_tup_del)
i/o stats (pid, rchar, wchar, syscr, syscw, reads, writes, cwrites, command)Connection / Query Manipulation
Entering k will provide a prompt for a process, or list of database processes to kill.
Entering r will provide a prompt for a nice value, followed by a list of processes to set to that new nice value. This changes the priority of important processes in the system.Different Uses of pg_top
Reactive Usage of pg_top
Proactive Usage of pg_top
Historical Usage of pg_top
More Information