blog
Tips and Trick using Audit Logging for MariaDB

MariaDB’s Audit Plugin provides auditing functionality for not only MariaDB but MySQL as well (as of, version 5.5.34 and 10.0.7) and Percona Server. MariaDB started including by default the Audit Plugin from versions 10.0.10 and 5.5.37, and it can be installed in any version from MariaDB 5.5.20.
The purpose of the MariaDB Audit Plugin is to log the server’s activity. For each client session, it records who connected to the server (i.e., user name and host), what queries were executed, and which tables were accessed and server variables that were changed. This information is stored in a rotating log file or it may be sent to the local syslogd.
In this blog post, we are going to show you some best-practice tunings and tips on how to configure audit logging for a MariaDB server. The writing is based on MariaDB 10.5.9, with the latest version of MariaDB Audit Plugin 1.4.4.
Installation Tuning
The recommended way to enable audit logging is by setting the following lines inside the MariaDB configuration file:
[mariadb]
plugin_load_add = server_audit # load plugin
server_audit=FORCE_PLUS_PERMANENT  # do not allow users to uninstall plugin
server_audit_file_path=/var/log/mysql/mariadb-audit.log # path to the audit log
server_audit_logging=ON  # enable audit logging
Do not forget to set “server_audit=FORCE_PLUS_PERMANENT” to enforce the audit log and disallow it to be uninstalled by other users using the UNINSTALL SONAME statement. By default, the logging destination is a log file in the MariaDB data directory. We should put the audit log outside of this directory because there is a chance that the datadir will be wiped out (SST for Galera Cluster), or being replaced for a physical restore like datadir swapping when restoring a backup taken from MariaDB Backup.
Further tuning is necessary, as shown in the following sections.
Audit Events Filtering
MariaDB Audit plugin utilizes several log settings that depending on the plugin version. The following audit events are available on the latest plugin version 1.4.4:
|
Type |
Description |
|
CONNECT |
Connects, disconnects and failed connects, including the error code |
|
QUERY |
Queries executed and their results in plain text, including failed queries due to syntax or permission errors |
|
TABLE |
Tables affected by query execution |
|
QUERY_DDL |
Similar to QUERY, but filters only DDL-type queries (CREATE, ALTER, DROP, RENAME and TRUNCATE statements – except CREATE/DROP [PROCEDURE / FUNCTION / USER] and RENAME USER (they’re not DDL) |
|
QUERY_DML |
Similar to QUERY, but filters only DML-type queries (DO, CALL, LOAD DATA/XML, DELETE, INSERT, SELECT, UPDATE, HANDLER and REPLACE statements) |
|
QUERY_DML_NO_SELECT |
Similar to QUERY_DML, but doesn’t log SELECT queries. (since version 1.4.4) (DO, CALL, LOAD DATA/XML, DELETE, INSERT, UPDATE, HANDLER and REPLACE statements) |
|
QUERY_DCL |
Similar to QUERY, but filters only DCL-type queries (CREATE USER, DROP USER, RENAME USER, GRANT, REVOKE and SET PASSWORD statements) |
By default, it will track everything since the server_audit_events variable will be set to empty by default. Note that older versions have less support for the above operation type, as shown here. So make sure you are running on the latest version if you want to do specific filtering.
If the query cache is enabled, and a query is returned from the query cache, no TABLE records will appear in the log since the server didn’t open or access any tables and instead relied on the cached results. So you may want to disable query caching.
To filter out specific events, set the following line inside the MariaDB configuration file (requires restart):
server_audit_events = 'CONNECT,QUERY,TABLE'Or set it dynamically in the runtime using SET GLOBAL (requires no restart, but not persistent):
MariaDB> SET GLOBAL server_audit_events = 'CONNECT,QUERY,TABLE';This is the example of one audit event:
20210325 02:02:08,ip-172-31-0-44,cmon,172.31.1.119,7,226,QUERY,information_schema,'SHOW GLOBAL VARIABLES',0An entry of this log consists of a bunch of information separated by a comma containing the following information:
-
Timestamp
-
The MySQL host (identical with the value of SELECT @@hostname)
-
The database user
-
Host where the user was connecting
-
Connection ID
-
Thread ID
-
Operation
-
Database
-
SQL statement/command
-
Return code. 0 means the operation returns a success response (even empty), while a non-zero value means an error executing the operation like a failed query due to syntax or permission errors.
When filtering the entries, one would do a simple grep and look for a specific pattern:
$ grep -i global /var/lib/mysql/server_audit.log
20210325 04:19:17,ip-172-31-0-44,root,localhost,14,37080,QUERY,,'set global server_audit_file_rotate_now = 1',0
20210326 00:46:48,ip-172-31-0-44,root,localhost,35,329003,QUERY,,'set global server_audit_output_type = 'syslog'',0
By default, all passwords value will be masked with asterisks:
20210326 05:39:41,ip-172-31-0-44,root,localhost,52,398793,QUERY,mysql,'GRANT ALL PRIVILEGES ON sbtest.* TO [email protected] IDENTIFIED BY *****',0Audit User Filtering
If you track everything, you probably will be flooded with the monitoring user for its sampling responsibility, as shown in the example below:
20210325 02:02:08,ip-172-31-0-44,cmon,172.31.1.119,7,226,QUERY,information_schema,'SHOW GLOBAL VARIABLES',0
20210325 02:02:08,ip-172-31-0-44,cmon,172.31.1.119,7,227,QUERY,information_schema,'select @@global.wsrep_provider_options',0
20210325 02:02:08,ip-172-31-0-44,cmon,172.31.1.119,7,228,QUERY,information_schema,'SHOW SLAVE STATUS',0
20210325 02:02:08,ip-172-31-0-44,cmon,172.31.1.119,7,229,QUERY,information_schema,'SHOW MASTER STATUS',0
20210325 02:02:08,ip-172-31-0-44,cmon,172.31.1.119,7,230,QUERY,information_schema,'SHOW SLAVE HOSTS',0
20210325 02:02:08,ip-172-31-0-44,cmon,172.31.1.119,7,231,QUERY,information_schema,'SHOW GLOBAL VARIABLES',0
20210325 02:02:08,ip-172-31-0-44,cmon,172.31.1.119,7,232,QUERY,information_schema,'select @@global.wsrep_provider_options',0
20210325 02:02:08,ip-172-31-0-44,cmon,172.31.1.119,7,233,QUERY,information_schema,'SHOW SLAVE STATUS',0
20210325 02:02:08,ip-172-31-0-44,cmon,172.31.1.119,7,234,QUERY,information_schema,'SHOW MASTER STATUS',0
20210325 02:02:08,ip-172-31-0-44,cmon,172.31.1.119,7,235,QUERY,information_schema,'SHOW SLAVE HOSTS',0
20210325 02:02:08,ip-172-31-0-44,cmon,172.31.1.119,5,236,QUERY,information_schema,'SET GLOBAL SLOW_QUERY_LOG=0',0
20210325 02:02:08,ip-172-31-0-44,cmon,172.31.1.119,5,237,QUERY,information_schema,'FLUSH /*!50500 SLOW */ LOGS',0
20210325 02:02:08,ip-172-31-0-44,cmon,172.31.1.119,6,238,QUERY,information_schema,'SHOW GLOBAL STATUS',0
In the span of one second, we can see 14 QUERY events recorded by the audit plugin for our monitoring user called “cmon”. In our test workload, the logging rate is around 32 KB per minute, which will accumulate up to 46 MB per day. Depending on the storage size and IO capacity, this could be excessive in some workloads. So it would be better to filter out the monitoring user from the audit logging, so we could have a cleaner output and is much easier to audit and analyze.
Depending on the security and auditing policies, we could filter out the unwanted user like the monitoring user by using the following variable inside the MariaDB configuration file (requires restart):
server_audit_excl_users='cmon'Or set it dynamically in the runtime using SET GLOBAL (requires no restart, but not persistent):
MariaDB> SET GLOBAL server_audit_excl_users = 'cmon'You can add multiple database users, separated by comma. After adding the above, we got a cleaner audit logs, as below (nothing from the ‘cmon’ user anymore):
$ tail -f /var/log/mysql/mysql-audit.log
20210325 04:16:06,ip-172-31-0-44,cmon,172.31.1.119,6,36218,QUERY,information_schema,'SHOW GLOBAL STATUS',0
20210325 04:16:06,ip-172-31-0-44,root,localhost,13,36219,QUERY,,'set global server_audit_excl_users = 'cmon'',0
20210325 04:16:09,ip-172-31-0-44,root,localhost,13,36237,QUERY,,'show global variables like '%server_audit%'',0
20210325 04:16:12,ip-172-31-0-44,root,localhost,13,0,DISCONNECT,,,0
Log Rotation Management
Since the audit log is going to capture a huge number of events, it is recommended to configure a proper log rotation for it. Otherwise, we would end up with an enormous size of logfile which makes it very difficult to analyze. While the server is running, and server_audit_output_type=file, we can force the logfile rotation by using the following statement:
MariaDB> SET GLOBAL server_audit_file_rotate_now = 1;For automatic log rotation, we should set the following variables inside the MariaDB configuration file:
server_audit_file_rotate_size=1000000 # in bytes
server_audit_file_rotations=30
Or set it dynamically in the runtime using SET GLOBAL (require no restart):
MariaDB> SET GLOBAL server_audit_file_rotate_size=1000000;
MariaDB> SET GLOBAL server_audit_file_rotations=30;
To disable audit log rotation, simply set the server_audit_file_rotations to 0. The default value is 9. The log rotation will happen automatically after it reaches the specified threshold and will keep the last 30 logs, which means the last 30 days’ worth of audit logging.
Auditing using Syslog or Rsyslog Facility
Using the syslog or rsyslog facility will make log management easier because it permits the logging from different types of systems in a central repository. Instead of maintaining another logging component, we can instruct the MariaDB Audit to log to syslog. This is handy if you have a log collector/streamer for log analyzer services like Splunk, LogStash, Loggly or Amazon CloudWatch.
To do this, set the following lines inside the MariaDB configuration file (requires restart):
server_audit_logging = 'syslog'
server_audit_syslog_ident = 'mariadb-audit'
Or if you want to change in the runtime (requires no restart, but not persistent):
MariaDB> SET GLOBAL server_audit_logging = 'syslog';
MariaDB> SET GLOBAL server_audit_syslog_ident = 'mariadb-audit';
The entries will be similar to the Syslog format:
$ grep mariadb-audit /var/log/syslog
Mar 26 00:48:49 ip-172-31-0-44 mariadb-audit:  ip-172-31-0-44,root,localhost,36,329540,QUERY,,'SET GLOBAL server_audit_syslog_ident = 'mariadb-audit'',0
Mar 26 00:48:54 ip-172-31-0-44 mariadb-audit:  ip-172-31-0-44,root,localhost,36,0,DISCONNECT,,,0
If you want to set up a remote logging service for a centralized logging repository, we can use rsyslog. The trick is to use the variable server_audit_syslog_facility where we can create a filter to facilitate logging, similar to below:
MariaDB> SET GLOBAL server_audit_logging = 'syslog';
MariaDB> SET GLOBAL server_audit_syslog_ident = 'mariadb-audit';
MariaDB> SET GLOBAL server_audit_syslog_facility = 'LOG_LOCAL6';
However, there are some prerequisite steps beforehand. Consider the following MariaDB master-slave replication architecture with a centralized rsyslog server:
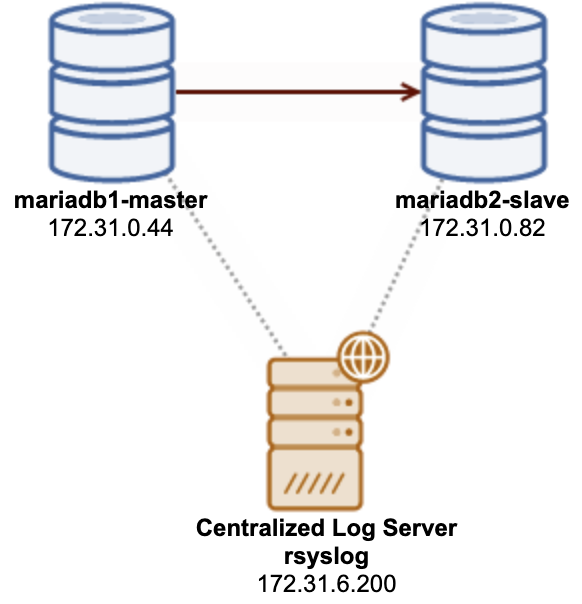
In this example, all servers are running on Ubuntu 20.04. On the rsyslog destination server, we need to set the following inside /etc/rsyslog.conf:
module(load="imtcp")
input(type="imtcp" port="514")
$ModLoad imtcp
$InputTCPServerRun 514
if $fromhost-ip=='172.31.0.44' then /var/log/mariadb-centralized-audit.log
& ~
if $fromhost-ip=='172.31.0.82' then /var/log/mariadb-centralized-audit.log
& ~
Note that the “& ~” part is important and don’t miss that out. It basically tells the logging facility to log into /var/log/mariadb-centralized-audit.log and stop further processing right after that.
Next, create the destination log file with the correct file ownership and permission:
$ touch /var/log/mariadb-centralized-audit.log
$ chown syslog:adm /var/log/mariadb-centralized-audit.log
$ chmod 640 /var/log/mariadb-centralized-audit.log
Restart rsyslog:
$ systemctl restart rsyslogMake sure it listens on all accessible IP addresses on TCP port 514:
$ netstat -tulpn | grep rsyslog
tcp        0      0 0.0.0.0:514             0.0.0.0:*               LISTEN      3143247/rsyslogd
tcp6       0      0 :::514                  :::*                    LISTEN      3143247/rsyslogd
We have completed configuring the destination rsyslog server. Now we are ready to configure the source part. On the MariaDB server, create a new separate rsyslog configuration file at /etc/rsyslog.d/50-mariadb-audit.conf and add the following lines:
$WorkDirectory /var/lib/rsyslog # where to place spool files
$ActionQueueFileName queue1     # unique name prefix for spool files
$ActionQueueMaxDiskSpace 1g     # 1GB space limit (use as much as possible)
$ActionQueueSaveOnShutdown on   # save messages to disk on shutdown
$ActionQueueType LinkedList     # run asynchronously
$ActionResumeRetryCount -1      # infinite retries if rsyslog host is down
local6.* action(type="omfwd" target="172.31.6.200" port="514" protocol="tcp")
The settings in the first section are about creating an on-disk queue, which is recommended to not get any log entry lost. The last line is important. We changed the variable server_audit_syslog_facility to LOG_LOCAL6 for the audit plugin. Here, we specified “local6.*” as a filter to only forward Syslog entries using facility local6 to rsyslog running on the rsyslog server 172.31.6.200, on port 514 via TCP protocol.
To activate the changes for rsyslog, the last step is to restart the rsyslog on the MariaDB server to activate the changes:
$ systemctl restart rsyslogNow, rsyslog is correctly configured on the source node. We can test out by accessing the MariaDB server and perform some activities to generate audit events. You should see the audit log entries are forwarded here:
$ tail -f /var/log/mariadb-centralized-audit.log
Mar 26 12:56:18 ip-172-31-0-44 mariadb-audit:  ip-172-31-0-44,root,localhost,69,0,CONNECT,,,0
Mar 26 12:56:18 ip-172-31-0-44 mariadb-audit:  ip-172-31-0-44,root,localhost,69,489413,QUERY,,'select @@version_comment limit 1',0
Mar 26 12:56:19 ip-172-31-0-44 mariadb-audit:  ip-172-31-0-44,root,localhost,69,489414,QUERY,,'show databases',0
Mar 26 12:56:37 ip-172-31-0-44 mariadb-audit:  ip-172-31-0-44,root,localhost,69,0,DISCONNECT,,,0
Final Thoughts
MariaDB Audit Plugin can be configured in many ways to suit your security and auditing policies. Auditing information can help you troubleshoot performance or application issues, and lets you see exactly what SQL queries are being processed.