blog
Setting Up Alerts & Notifications to Monitor Your Moodle Database

Monitoring is a basic requirement when running a system in production, and especially important if you are running a highly available database for Moodle. Monitoring helps you understand the current state of your database, the workload and resource utilization. There are some tips from my colleague on how to monitor your Moodle database.
Alerting plays an important role as you would want to know asap if there is an issue. For example, if suddenly the number of connections reaches the maximum threshold and your application can no longer connect to the database. You will want to immediately get notified about the problem and start working on it. In this blog, we will discuss how to set up Alerts and Notifications for your Moodle database.
Monitoring Before Alerting
Enabling Alerts and Notifications is the next step after you have monitoring in place for your Moodle database. You must collect all the metrics, start from database, operating system, network, disk. So, you will know the workload of your moodle database, the pattern of your queries, connection used, database cache that used, rows operations executed, or even you know the queries per seconds (QPS) of the traffic. One of the monitoring systems commonly used is Grafana. You can configure Grafana and Prometheus to monitor your database and operating system. Below is the architecture of monitoring in Moodle database system:
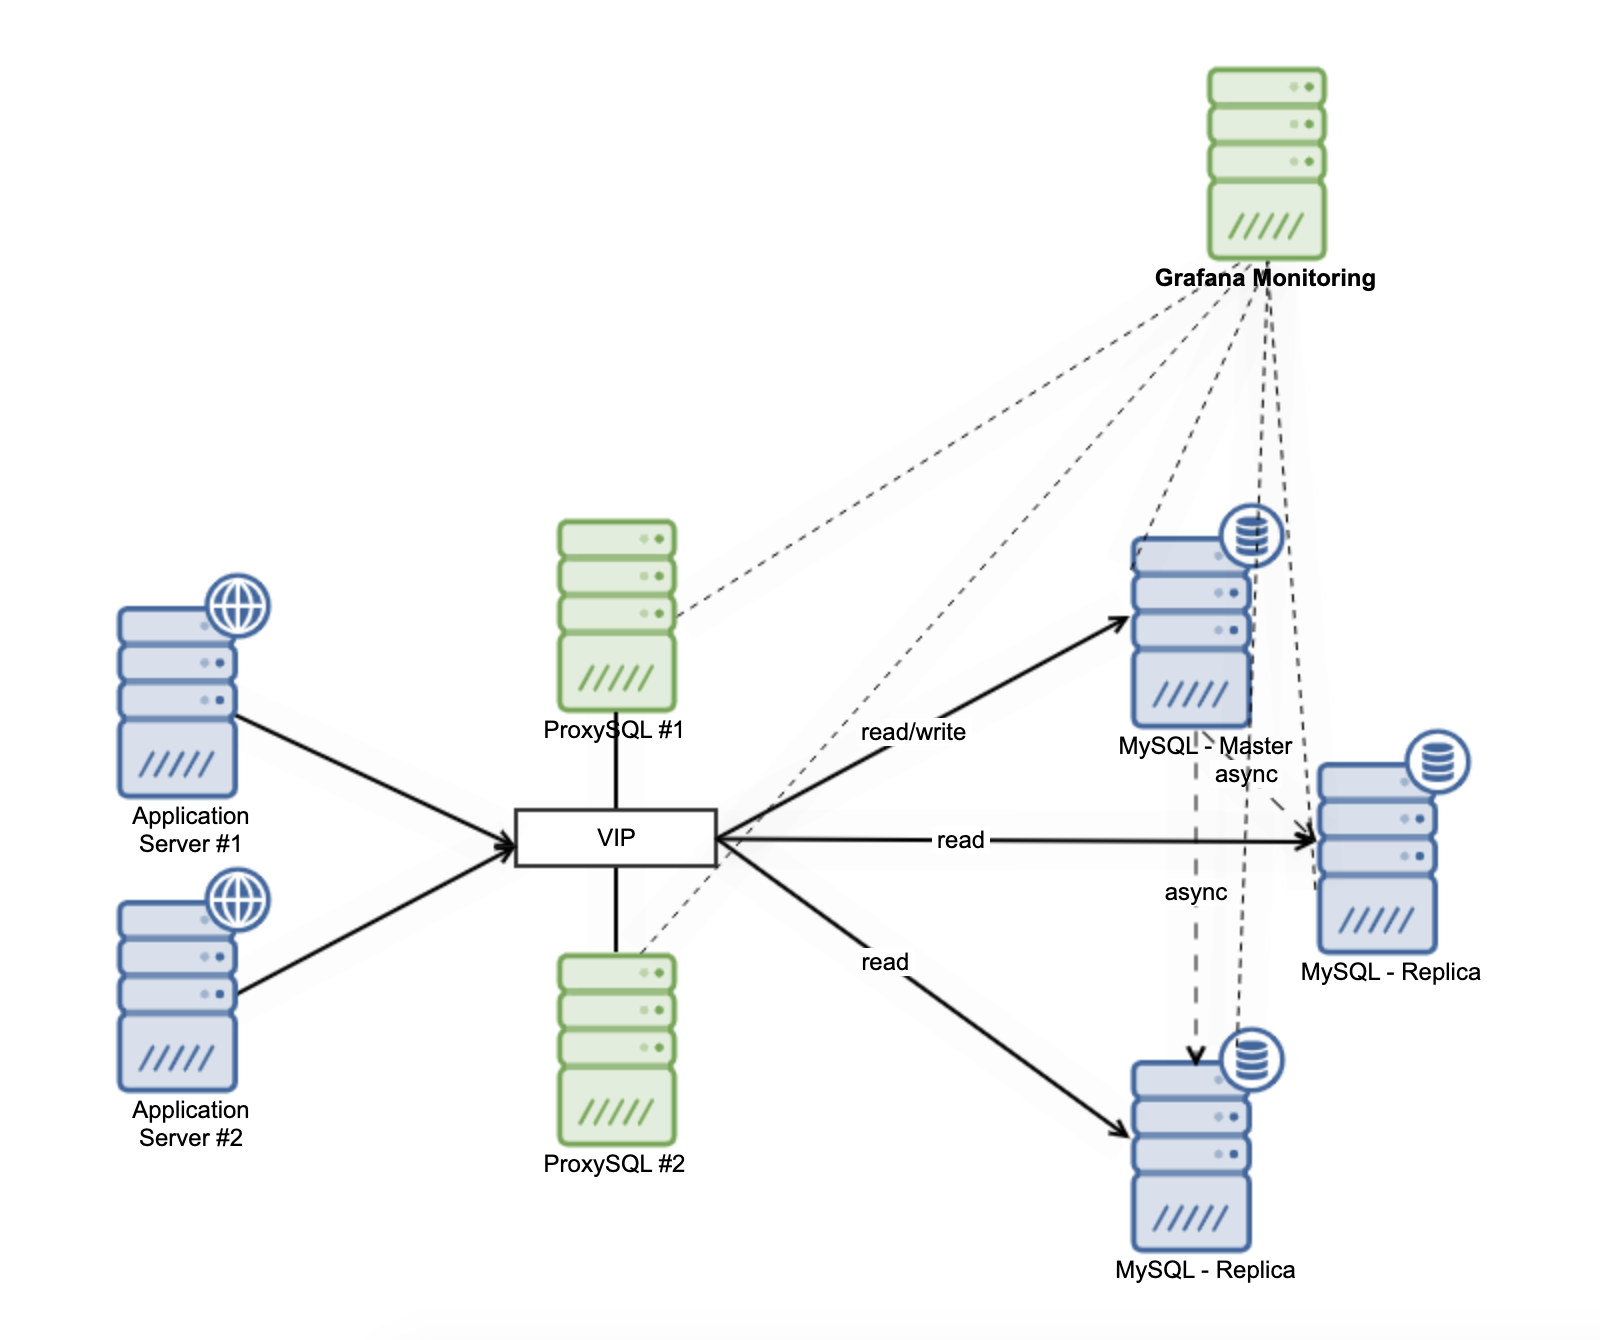
You also need to configure node_exporter, mysql_exporter, and proxysql_exporter on each node. So, you need to configure all of those things to build a monitoring database for Moodle. This just only monitoring, it does not even get in touch with alerting.
Setting up Alerting in Grafana
Configure alerting in Grafana, you can go to the icon bell on the left. There is menu for setting up alerting and the rules as shown below:
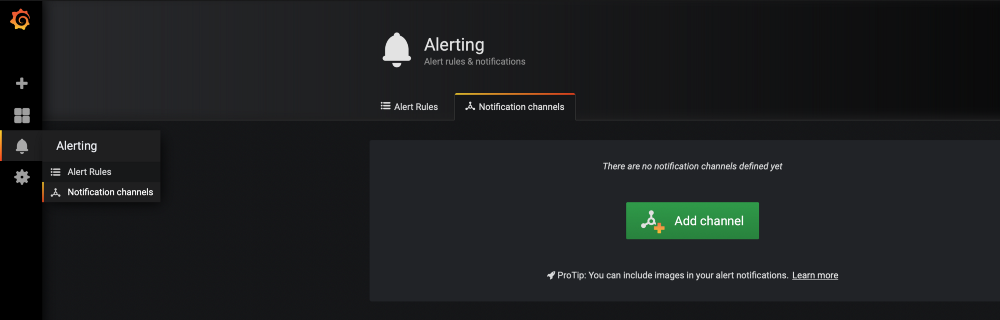
You need to configure Notification channels before creating the Alert Rules. There are some options for communication channels that are supported by Grafana. You can choose slack channel.
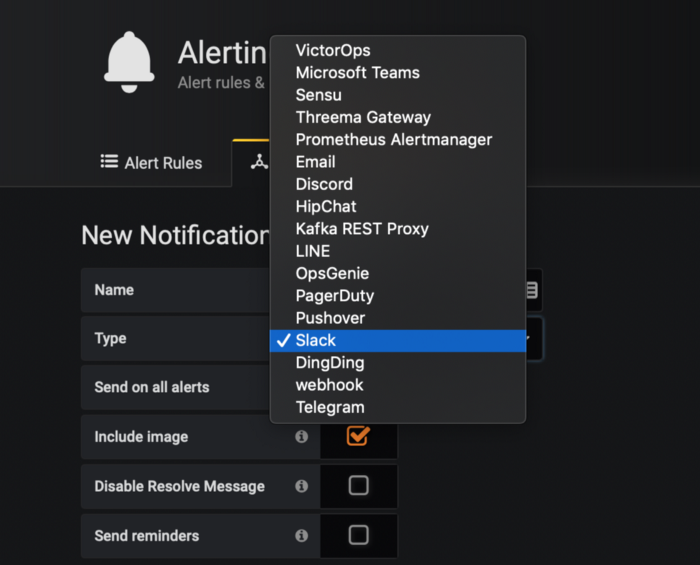
And then, fill the Name for your alerting channel, choose Slack as type. In the Slack setting, you can fill the slack webhook in the URL. And then save.
The next step is configure the Alert Rules. Every metrics in grafana already have Alert tab, you just need to go to the Alert tab and then Create Alert as shown below:
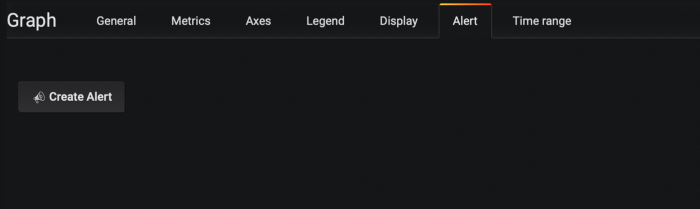
There are some rules based which you can define for the alert. For example, CPU Alert, you can evaluate every minute for 5 minutes. If the CPU utilization is above 90%, you can trigger an alert to the slack channel.
How ClusterControl Monitoring and Alerting
ClusterControl is database management software that helps you to deploy, monitor, and manage your open source database. The “monitor” part is one of the benefits you can take. Not only monitor, you can also configure Alerts in ClusterControl. Below collaboration and messaging platform which is supported by ClusterControl:
You can also create your own Webhook for other monitoring services. ClusterControl will push notifications to the webhook and send to the consumers.
Configure the alerting is really easy and straightforward, you just need to go to Integrations, it will appear the page as below:
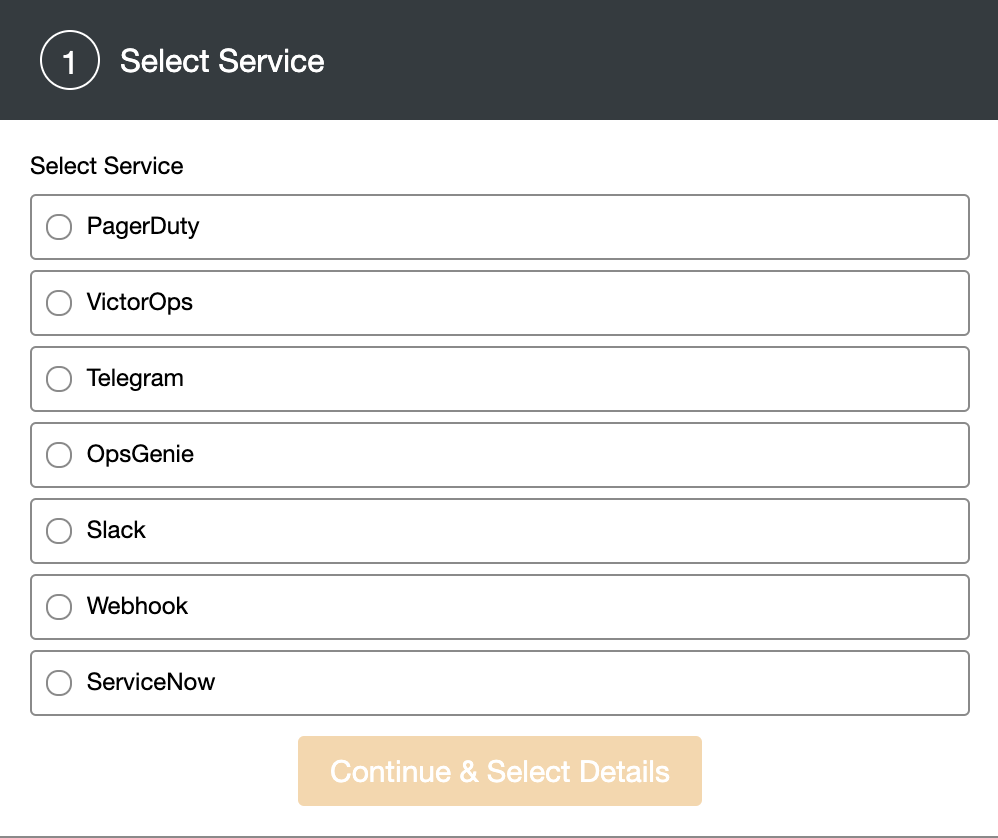
You just need to click the Add new integration link, and it will show a dialogue to choose the channel of the messaging platform, in this case we will use Slack as a messaging channel for alerting.
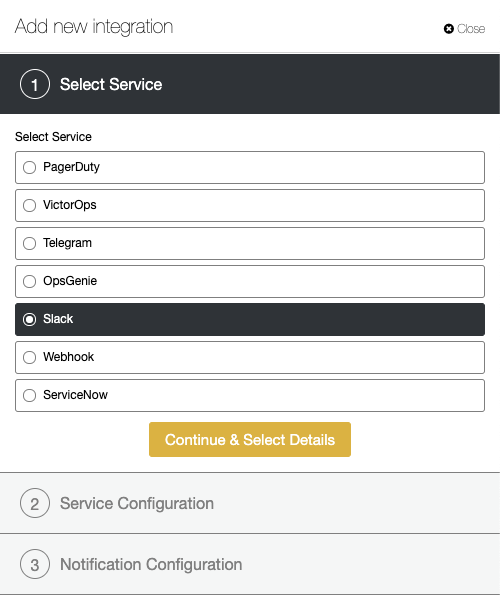
Currently ClusterControl supports PagerDuty, VictorOps, Telegram, OpsGenie, Slack, and ServiceNow.
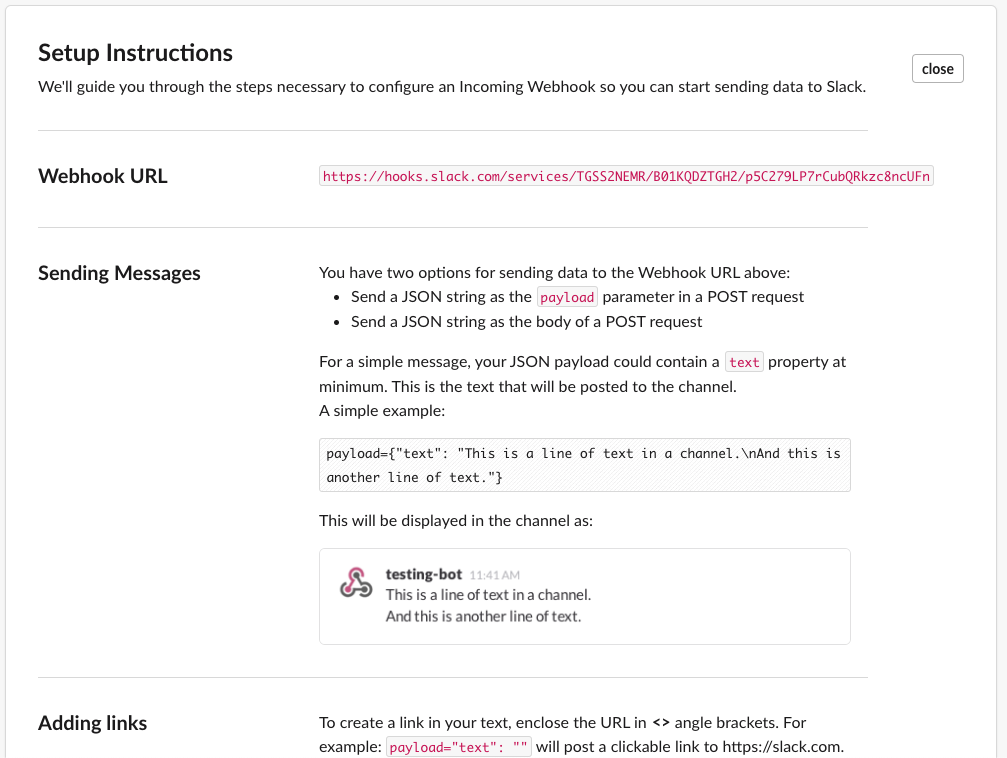
On the Slack channel, you can add the Incoming WebHooks for custom integration, and then select the channel you want to post the alert:
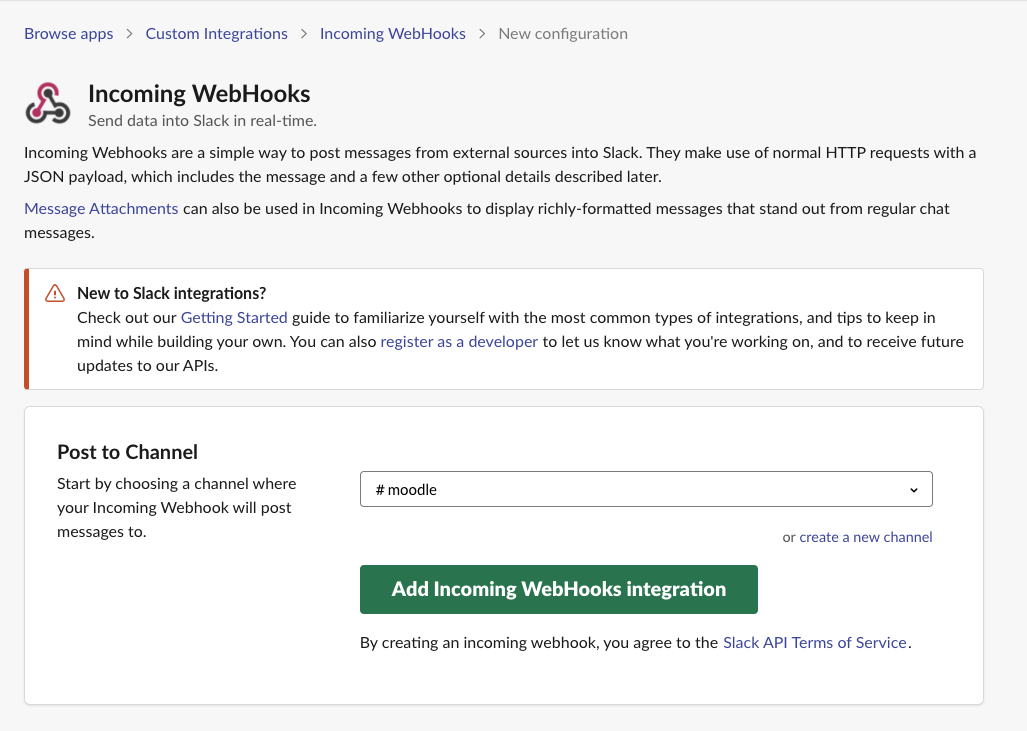
After it is finished, it will appear in the page, the webhook URL which you need to configure in the ClusterControl.
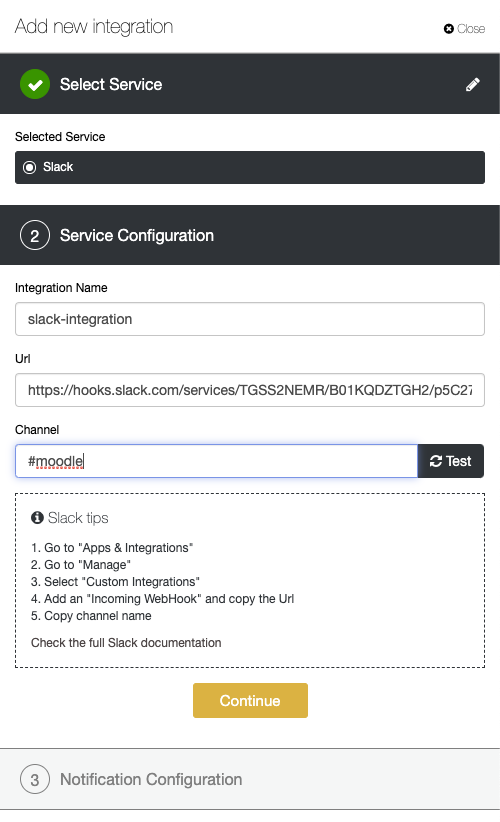
Back to the ClusterControl, fill the integration name, URL from the Slack integration and the last thing is the channel name to send the alert as shown below:
Select the database cluster you want to monitor and send the alert, and choose the events. For example, in my case i want to alert for all critical and warning events as shown below:
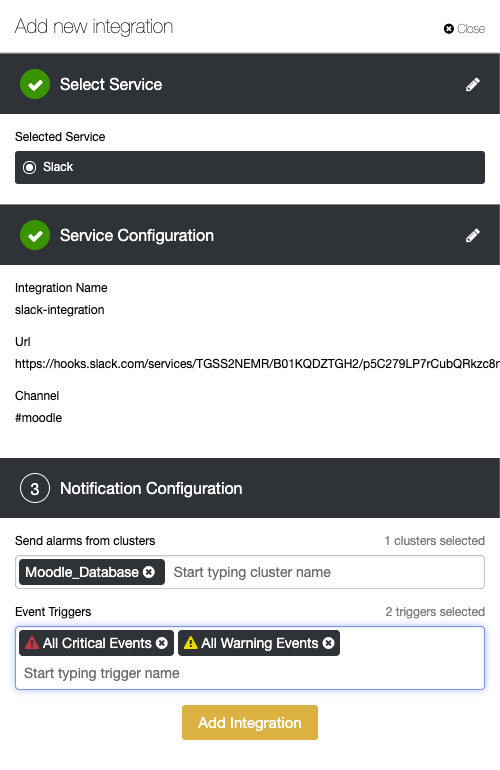
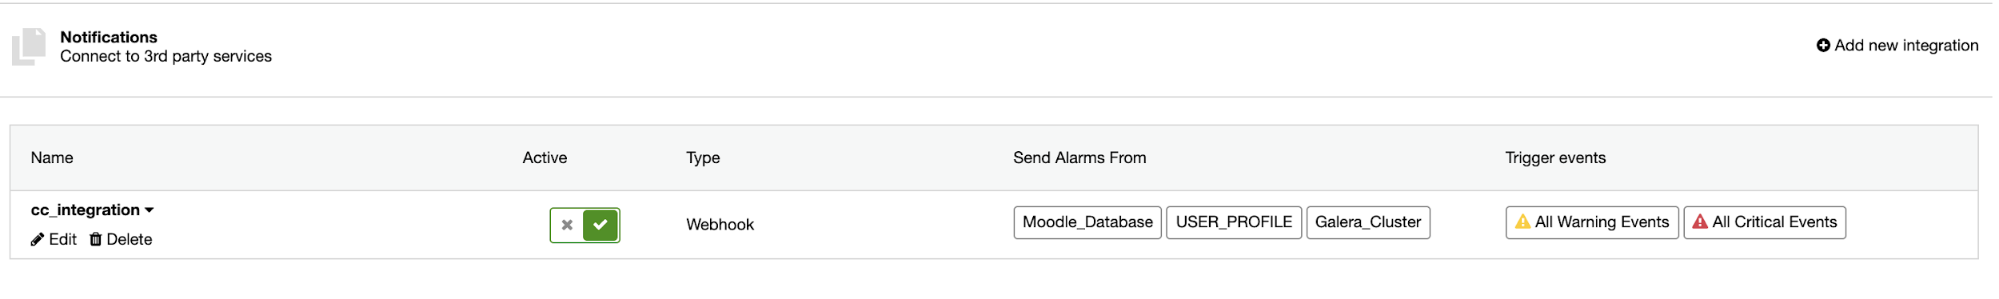
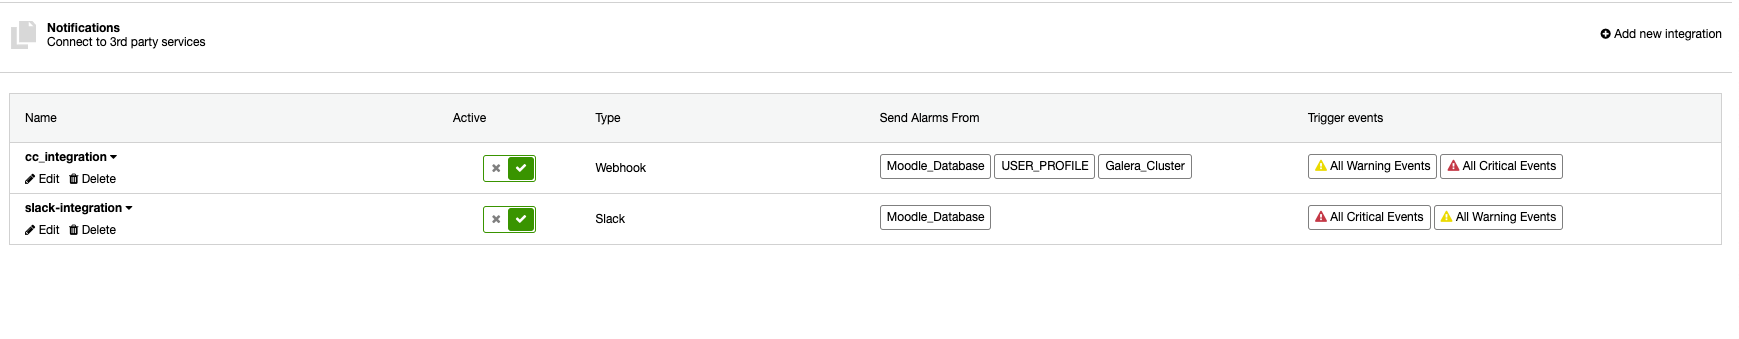
And then just click the Add Integration. It will appear the new integration for Slack. You will see, the type of integration is Slack, alarm will send from Moodle_Database cluster, and the trigger events is All Critical Events and All Warning Events as shown below :
After alerting already in place. Let’s try to simulate by triggering some events, in this case we try to kill the mysqld process in the slave nodes as shown below:
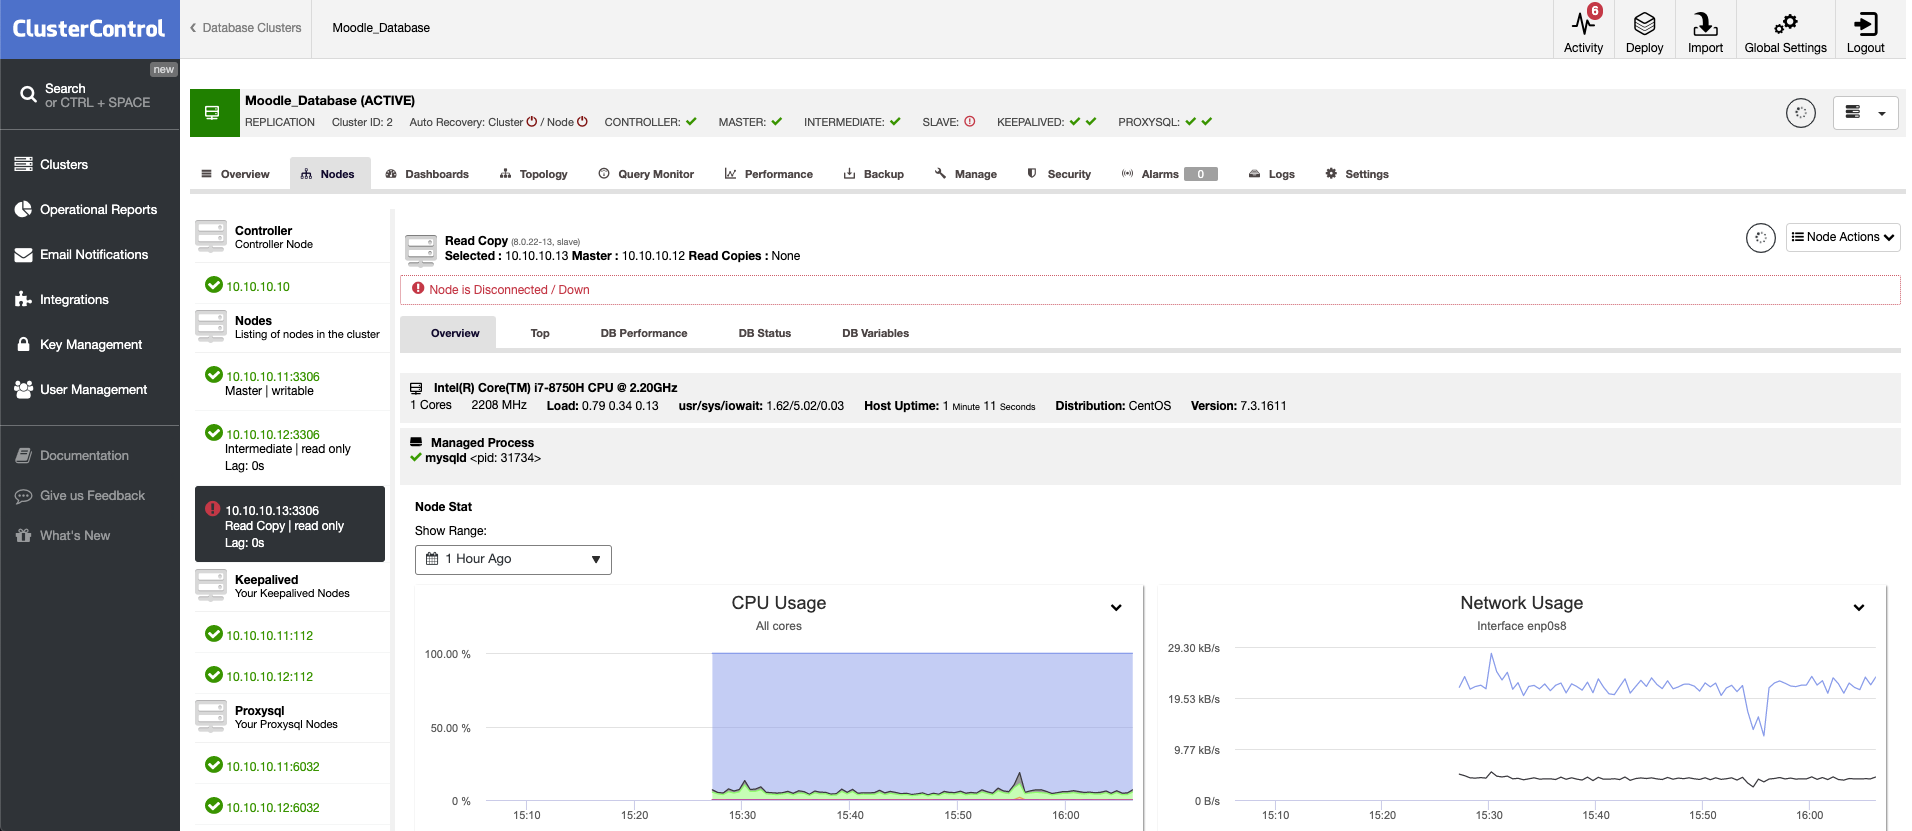
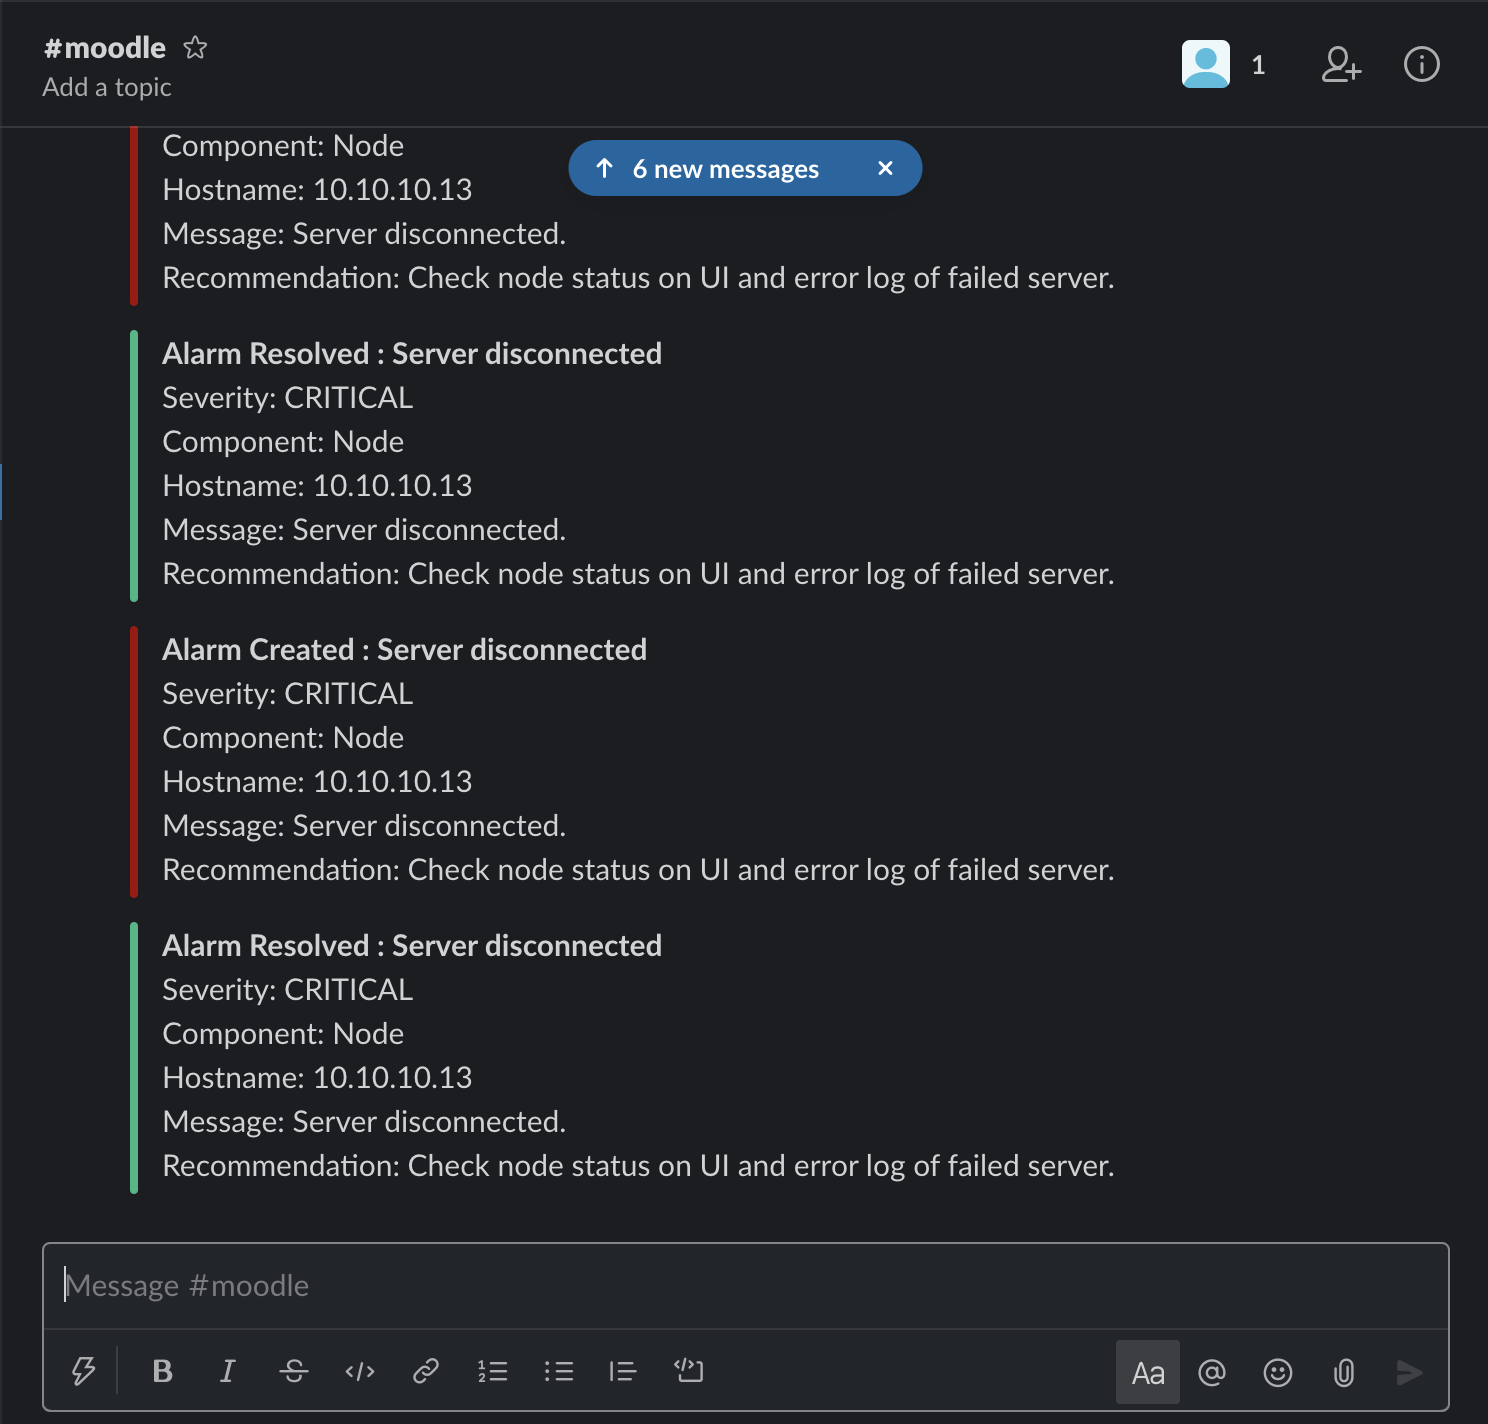
It will trigger an alert from ClusterControl send to the Slack #moodle, the alarm is related to the slave node disconnected as shown below:
It is simple and easy setting up Alerts for your Moodle Database. It gives you clear and transparent database service, if it is down you can take action immediately.


