blog
Proactive Galera Monitoring (Developer Studio/Advisors angle)

Monitoring is one of the vital parts for many organizations. In fact, there is a role specifically for monitoring purposes. This proves that with proactive monitoring, a lot of things could be achieved including driving the improvement of the systems, mitigating risks, making sure the system is healthy and is constantly in a solid-state etc.
There are a lot of tools for monitoring purposes both free as paid. For example, SolarWinds Database Performance Analyzer for SQL Server, ManageEngine Applications Manager, Datadog Database Monitoring etc. Of course, all of them have their own pros and cons.
ClusterControl on the other hand also offers a lot of cool features that you could use. Aside from a seamless process to deploy any database cluster, ClusterControl also provides monitoring that you could customize the way you would like to. In this blog post, we will go over Developer Studio and Advisors as well as how you could utilize these features to monitor your Galera cluster.
ClusterControl Developer Studio
Developer Studio uses ClusterControl DSL syntax and provides the ability to create Advisors, Auto Tuners, or Mini Programs right within your web browser-based. The DSL syntax is based on JavaScript and also allows you to execute SQL statements, run shell commands/programs across all your cluster hosts, and retrieve results to be processed for advisors/alerts or any other actions.
In short, within Developer Studio, you could create, edit, compile, run, test, debug and schedule your JavaScript programs. Did you have the opportunity to try this cool feature already? What are your thoughts on that? Well, no worries if you haven’t yet, today we will show you how to use it. Let’s get started!
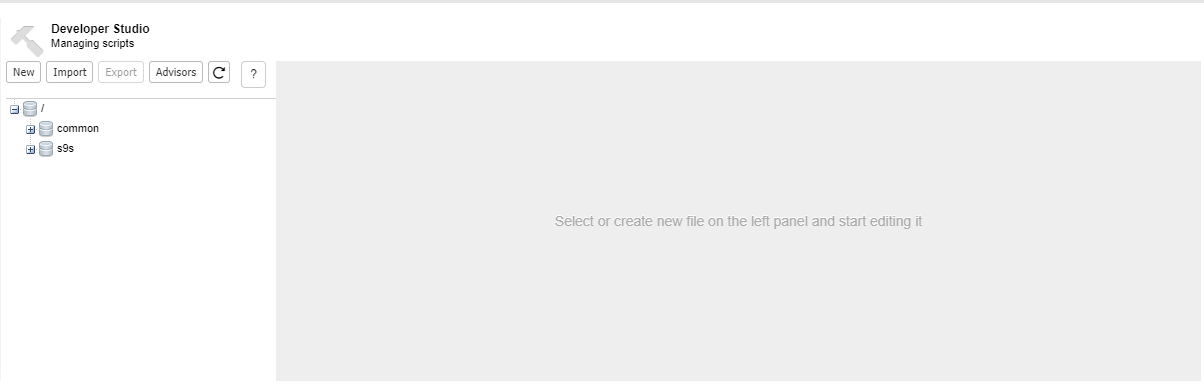
To access Developer Studio, you may go choose your Cluster -> Manage -> Developer Studio. You should see the following screen:
Now, let’s create our first simple script that will check the Galera node status. You may click on the New button and will see the following:
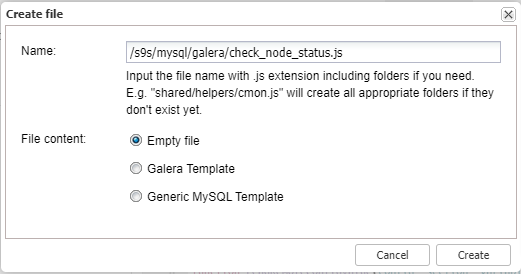
As you could see, there are two parameters that you need to set, the first one is “Name” and the second one is the “File content”. For “File content” you have three options to choose from: for our example, we will choose the “Empty file” option. If you choose the other two, your new script will be pre-filled with the codes. Make sure to give it a try to see the differences!
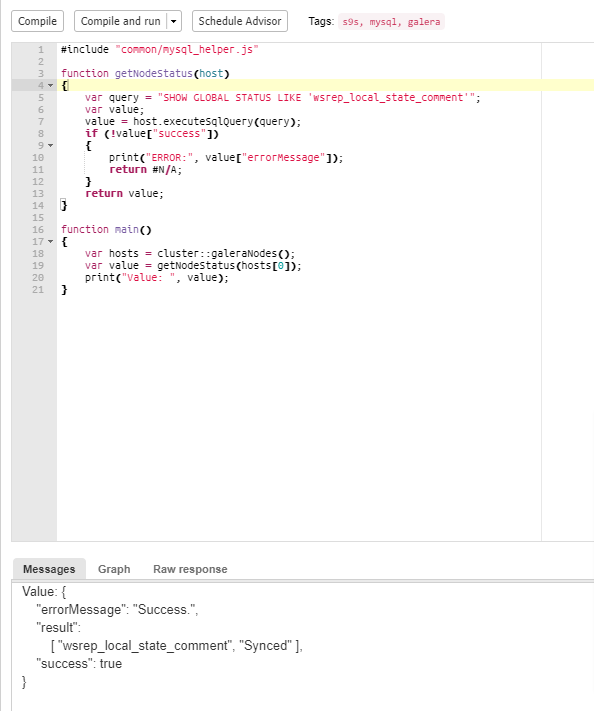
Our simple script should be like the following:
#include "common/mysql_helper.js"

function getNodeStatus(host)
{
    var query = "SHOW GLOBAL STATUS LIKE 'wsrep_local_state_comment'";
    var value;
    value = host.executeSqlQuery(query);
    if (!value["success"])
    {
        print("ERROR:", value["errorMessage"]);
        return #N/A;
    }
    return value;
}

function main()
{
    var hosts = cluster::galeraNodes();
    var value = getNodeStatus(hosts[0]);
    print("Value: ", value);
}
After the code is edited, we may click on the “Compile and run” button on the page. You should see the result at the bottom as per the screenshot below:
Let’s take a look at another example, this time we will create a script to check wsrep_local_send_queue_avg. As taken from the Galera website, this script could monitor the replication health. A value greater than 0 indicates replication throttling or network throughput problems. It could be the physical network cards and cables, or the operating system’s configuration. So, how could we translate this into the script? Take a look below:
#include "common/mysql_helper.js"


var DESCRIPTION="This advisor reads the value of wsrep_local_send_queue_avg in runtime and"

" compares the value with the warning threshold and notifies you";

var WARNING_THRESHOLD=0;


function main()

{
    var hosts     = cluster::galeraNodes();
    var advisorMap = {};

    for (idx = 0; idx < hosts.size(); idx++)
    {
        host        = hosts[idx];
        map         = host.toMap();
        gStatus     = map["galera"]["galerastatus"];

        print("   ");
        print(host);
        print("==========================");

        if (gStatus!="Primary")
        {
            print("Is not Primary, continuing.");
            continue;
        }

        var msg = "";
        var justification = "";
        var advice = new CmonAdvice();
        advice.setTitle("Galera Replication health check");
        advice.setHost(host);
        var value = host.sqlSystemVariable("WSREP_LOCAL_SEND_QUEUE_AVG");
        if (value.isError())
        {

            msg = "Not enough data to calculate";
            advice.setSeverity(Ok);
            advice.setJustification(msg);
            advice.setAdvice(msg);
            advisorMap[idx]= advice;
            continue;
        }
After the script is compiled, click on the “Schedule Advisor” button and you should see the following screen:
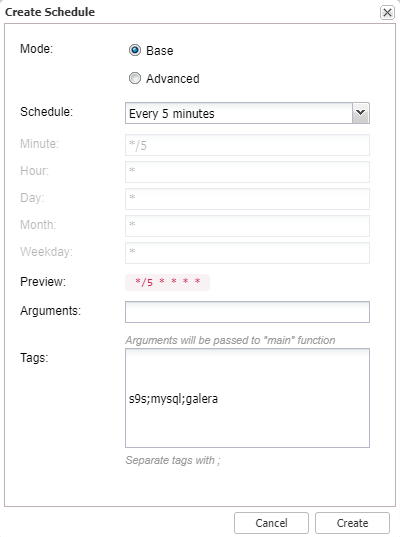
For our testing purposes, we choose to run every 5 minutes interval. This scheduler is basically a cron job where you could choose the pre-defined schedule or you could tweak it based on your own preferences.
ClusterControl Advisor
Every single script that you create in the Developer Studio and schedule will be listed on the Advisors page. Advisors in ClusterControl are powerful as they provide specific guidance on how to address issues in areas such as performance, security, log management, configuration, storage space, etc. Advisors could be anything from simple configuration advice, warning on thresholds or more complex rules for predictions, or even cluster-wide automation tasks based on the state of your servers or databases.
To access Advisors, simply choose the Cluster -> Performance -> Advisors. You should see the default Advisors that have been enabled here as well as the new script that you just created in the Developer Studio.
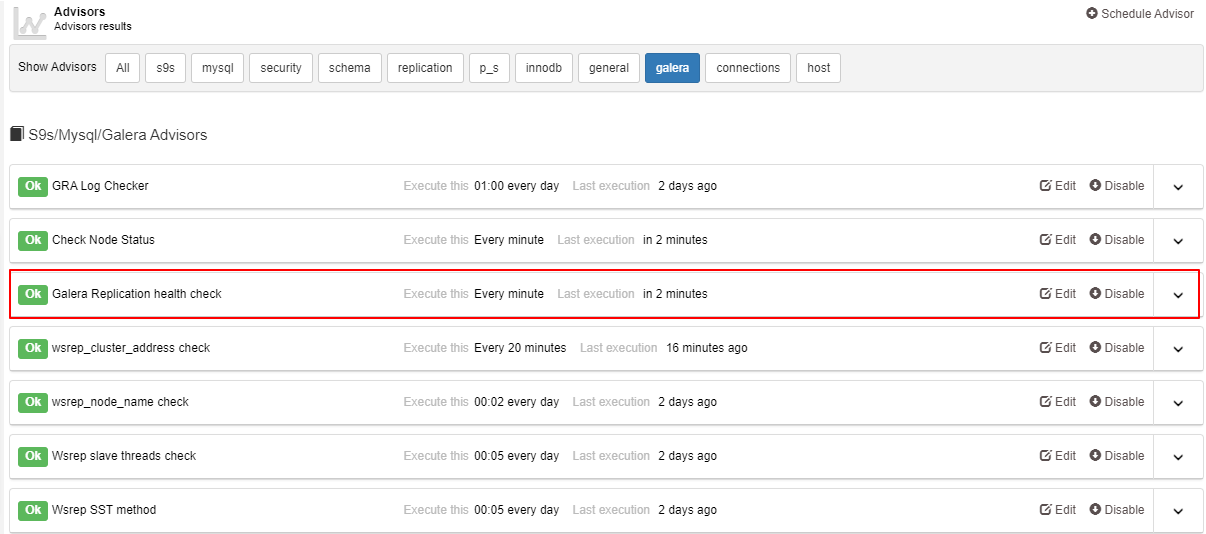
As you could see in the screenshot above, the one that we highlighted in red is the script that we created just now. On this page, you could edit and also disable any advisors that you would like to. For example, if you click on edit, it will bring you to the Developer Studio page again so that you could modify the script. Any disabled advisor will be placed at the bottom of the page like below:

You could easily enable it back once if you click on the “Enable” button. If you notice, we filter the advisor’s list for Galera only. And if you would like to see the full list, simply click on the “All” button.
Conclusion
Monitoring without second thoughts is vital for most business applications today. There are a lot of tools that are available for a free and paid version. ClusterControl also provides one of the best monitoring tools for your database. The default monitoring already works fine but we also provide the ability to tweak it so that it suits your environment better.
Both Developer Studio and Advisors could be utilized in case you would like to add a new script for monitoring purposes. That’s all for today folks, see you next time!


