blog
pgAdmin Alternatives – PostgreSQL Database Management GUI ClusterControl

There are many tools used in Database Administration that help simplify the management of open source databases. The advantage of using these types of applications is the availability menus from various objects in the database (such as tables, indexes, sequences, procedures, views, triggers) so that you do not have to use the command line when using a native database client. You just simply browse the menu, and it will immediately appear on the screen.
In this blog, we will review one of the third party Database Management applications for PostgreSQL called pgAdmin. It is an open source database management tool that is useful for database administration, ranging from creating tables, indexes, views, triggers, stored procedures. Besides that, pgAdmin can also monitor the database for information related to Sessions, Transactions per Seconds, and Locking.
pgAdmin Monitoring
There are some metrics in pgAdmin that can be valuable insight to understand the current state of the database. Here’s the display metrics on pgAdmin.
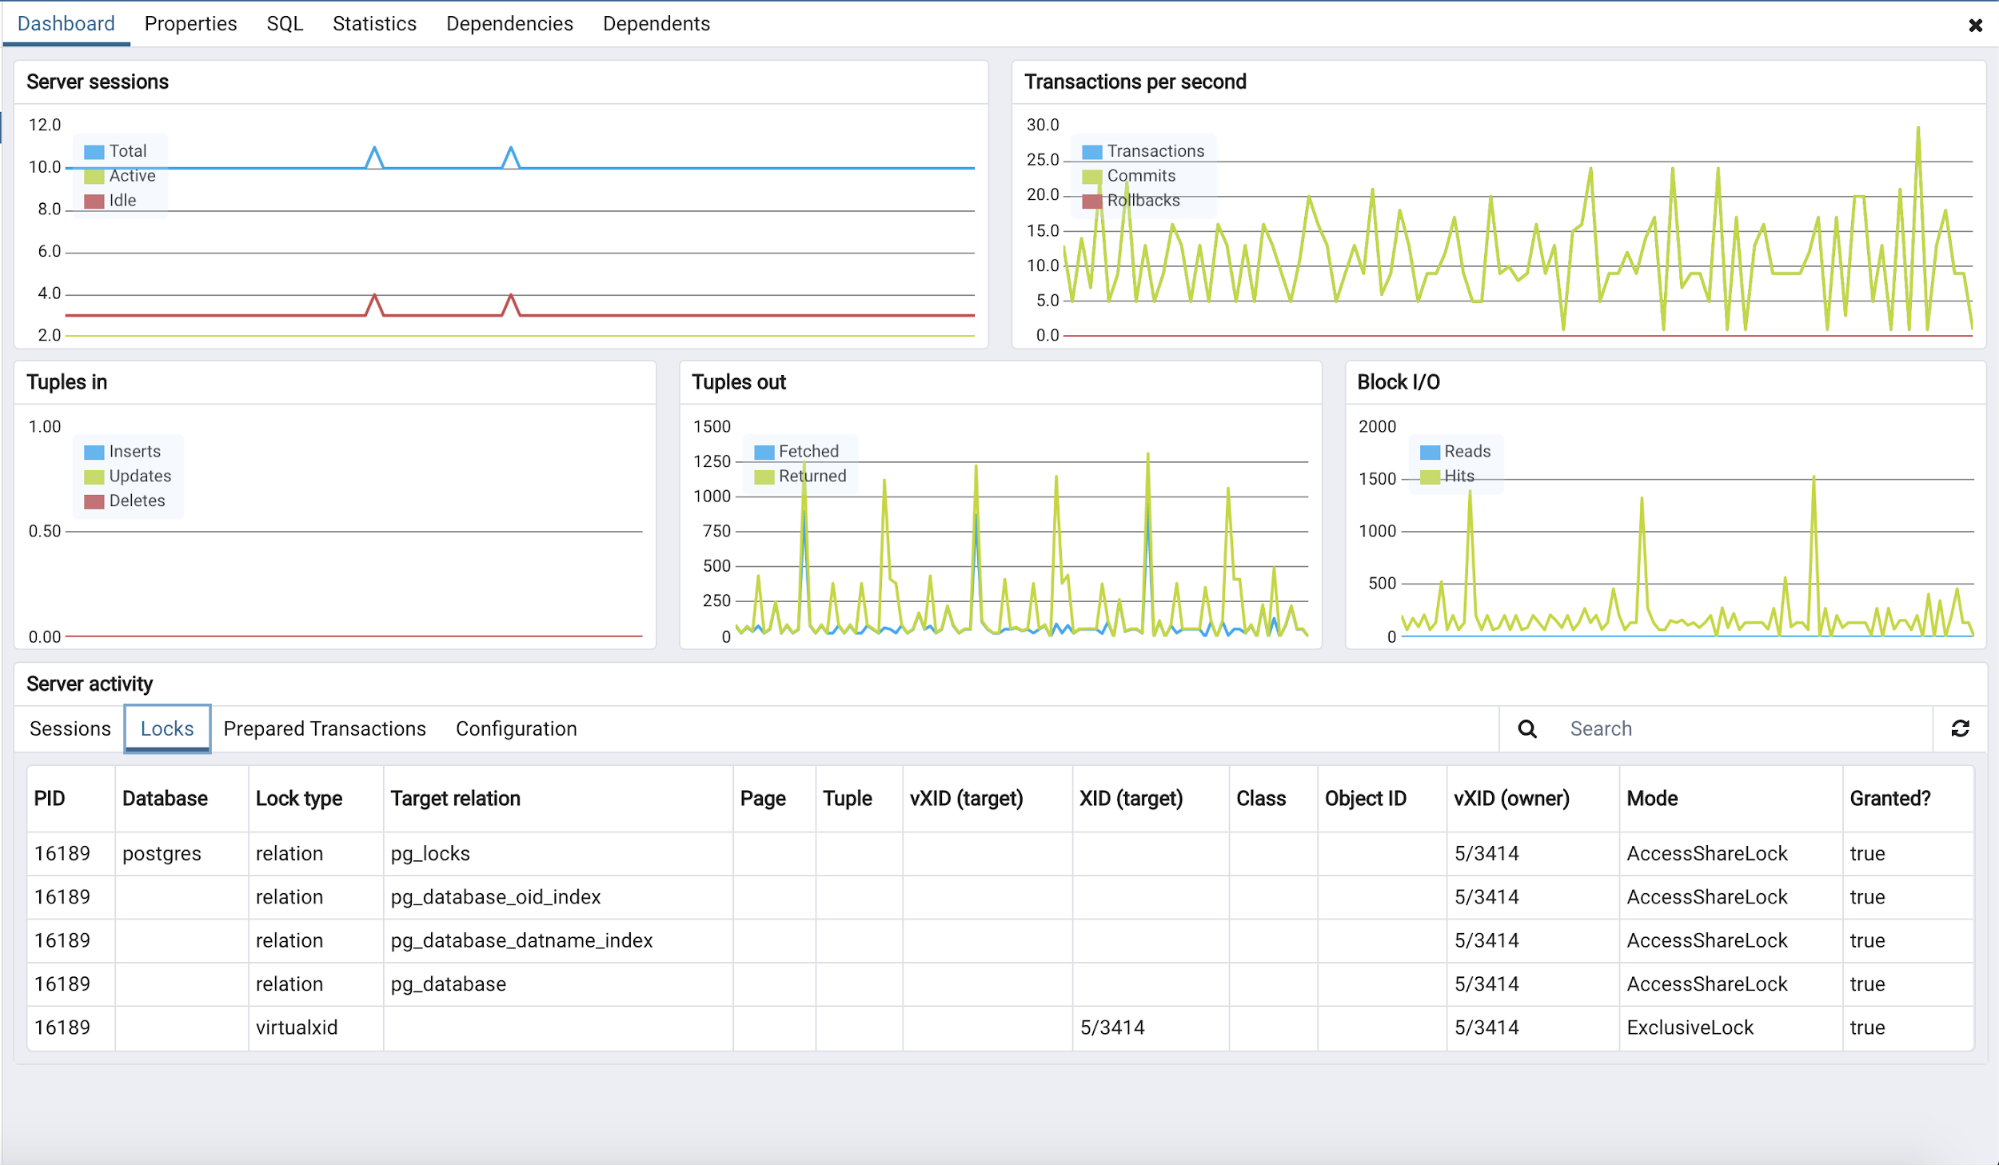
In the Dashboard, you can monitor information related to incoming connections to the database through Server Sessions. Information related to commit transactions, rollbacks and total transactions per second in the database can be seen in the Transactions per Seconds screen. Tuples in contains information related to total tuples insert, update, delete in the database. Tuples out contain tuples information that is returned to the client from the database. Tuples itself is a term in PostgreSQL for rows. Metrics Block I / O contains information related to Disk information, both total read and fetched blocks from the database cache.
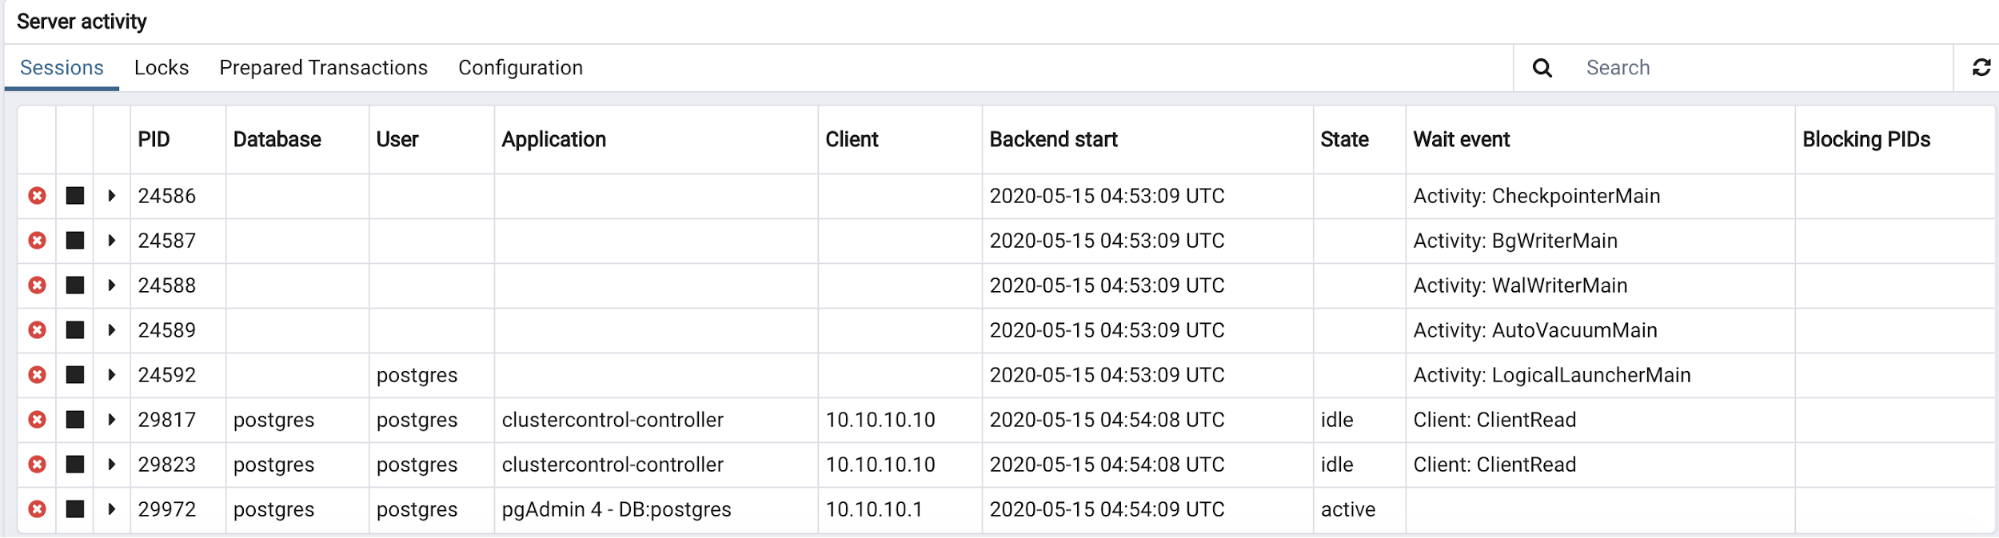
Server activity contains information related to running sessions, locking that occurs in the database, prepared statements from queries, and database configuration. As shown in the picture below.
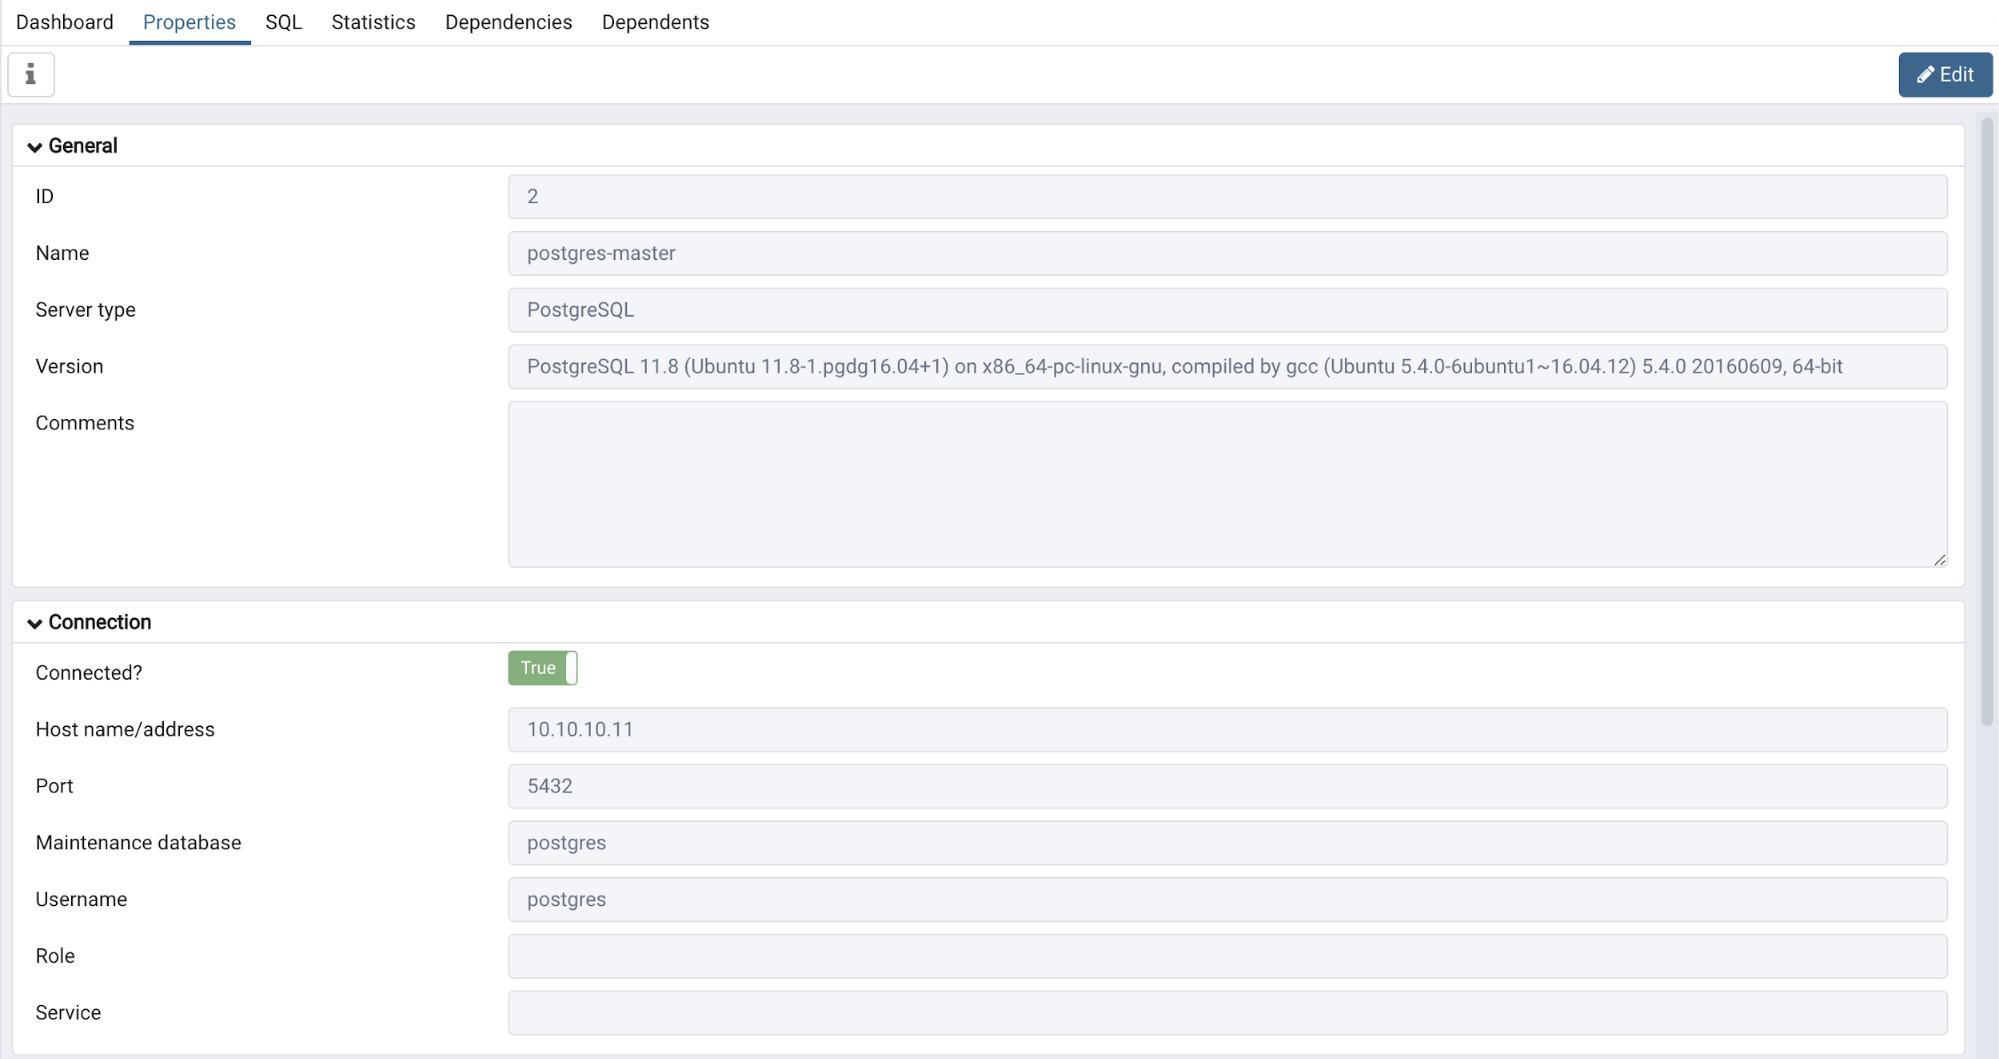
In Properties, you can see information related to the PostgreSQL database that is being accessed, such as the database name, server type, database version, ip address, and the username used.
The SQL contains information related to the generated SQL script created from a selected object as follows:
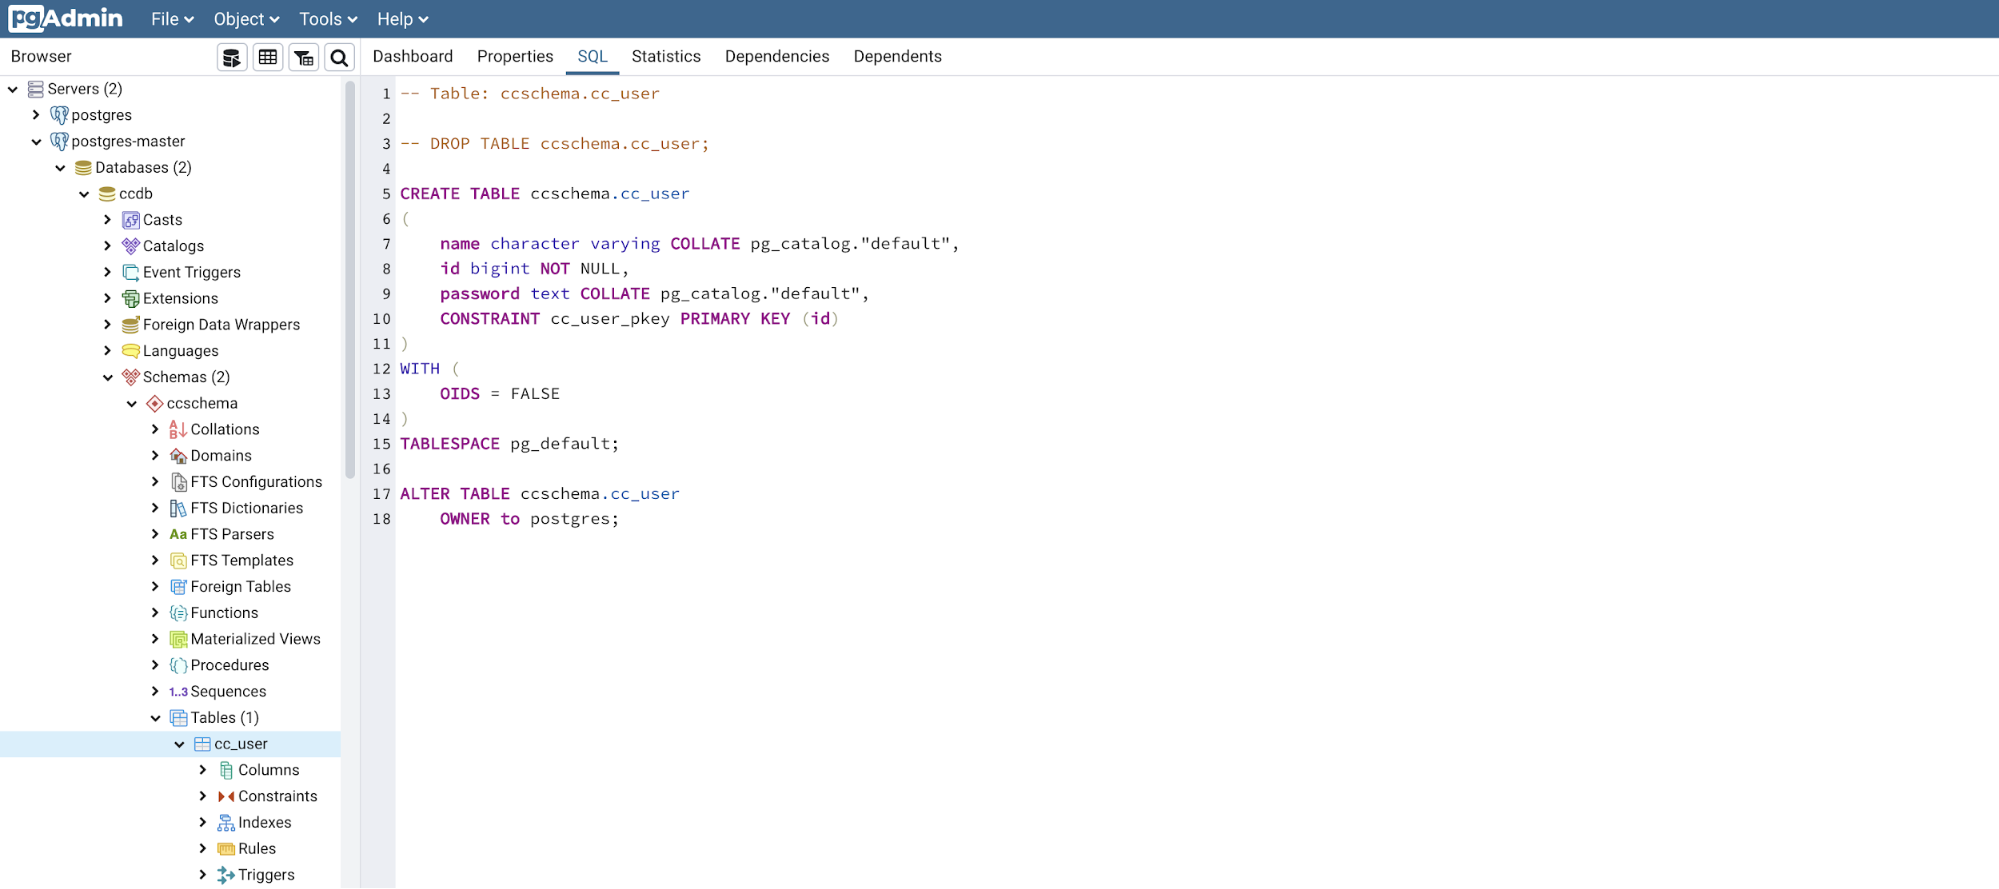
The information in the highlighted object is displayed in great detail, as it contains a script to reconstruct an object.
In the Statistics tab, the information related to statistics collected from each object running in the database are displayed on the menu.
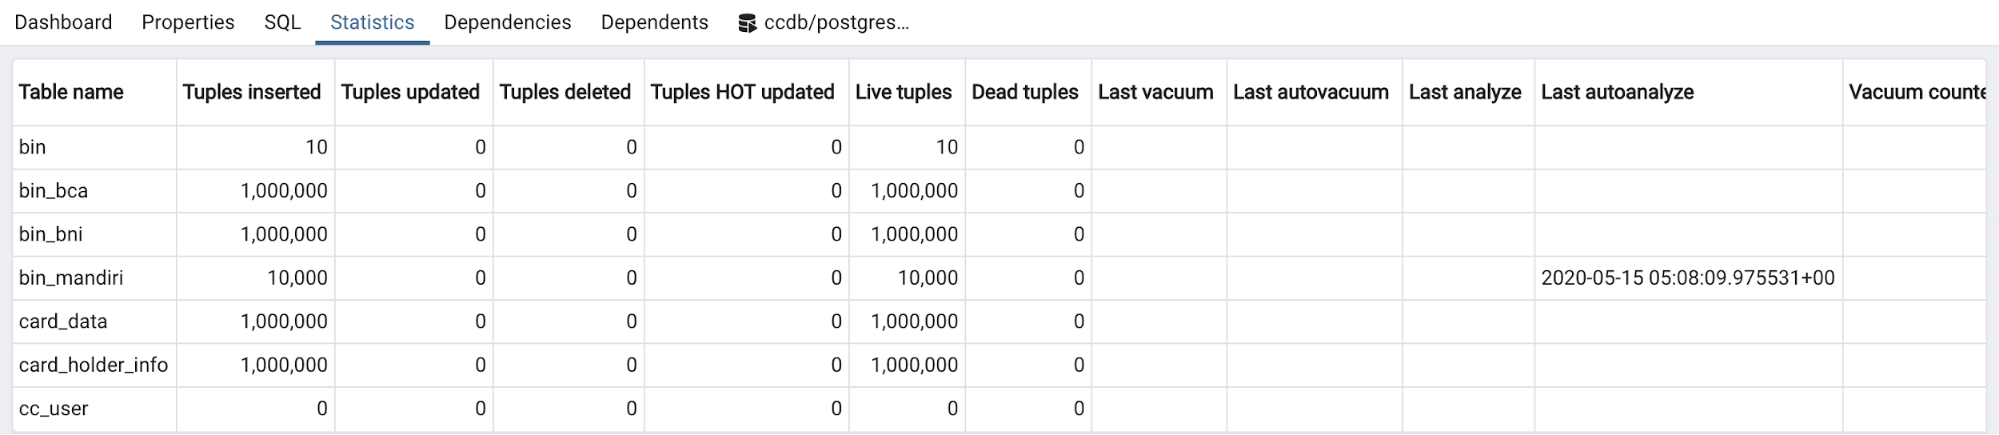
As an example, the above table contains information regarding Tuples (inserted, updated, deleted, live, dead). There is also information related to vacuum and auto-analyze.
Vacuum runs to clean dead tuples in the database and reclaim disk storage used by dead tuples. While auto-analyze functions to generate statistics on objects so the optimizer can precisely determine the execution plan of a query.
ClusterControl PostgreSQL Monitoring
ClusterControl has various metrics related to the PostgreSQL database which can be found on the Overview, Nodes, Dashboard, Query Monitor, and Performance tabs. The following metrics display in ClusterControl.
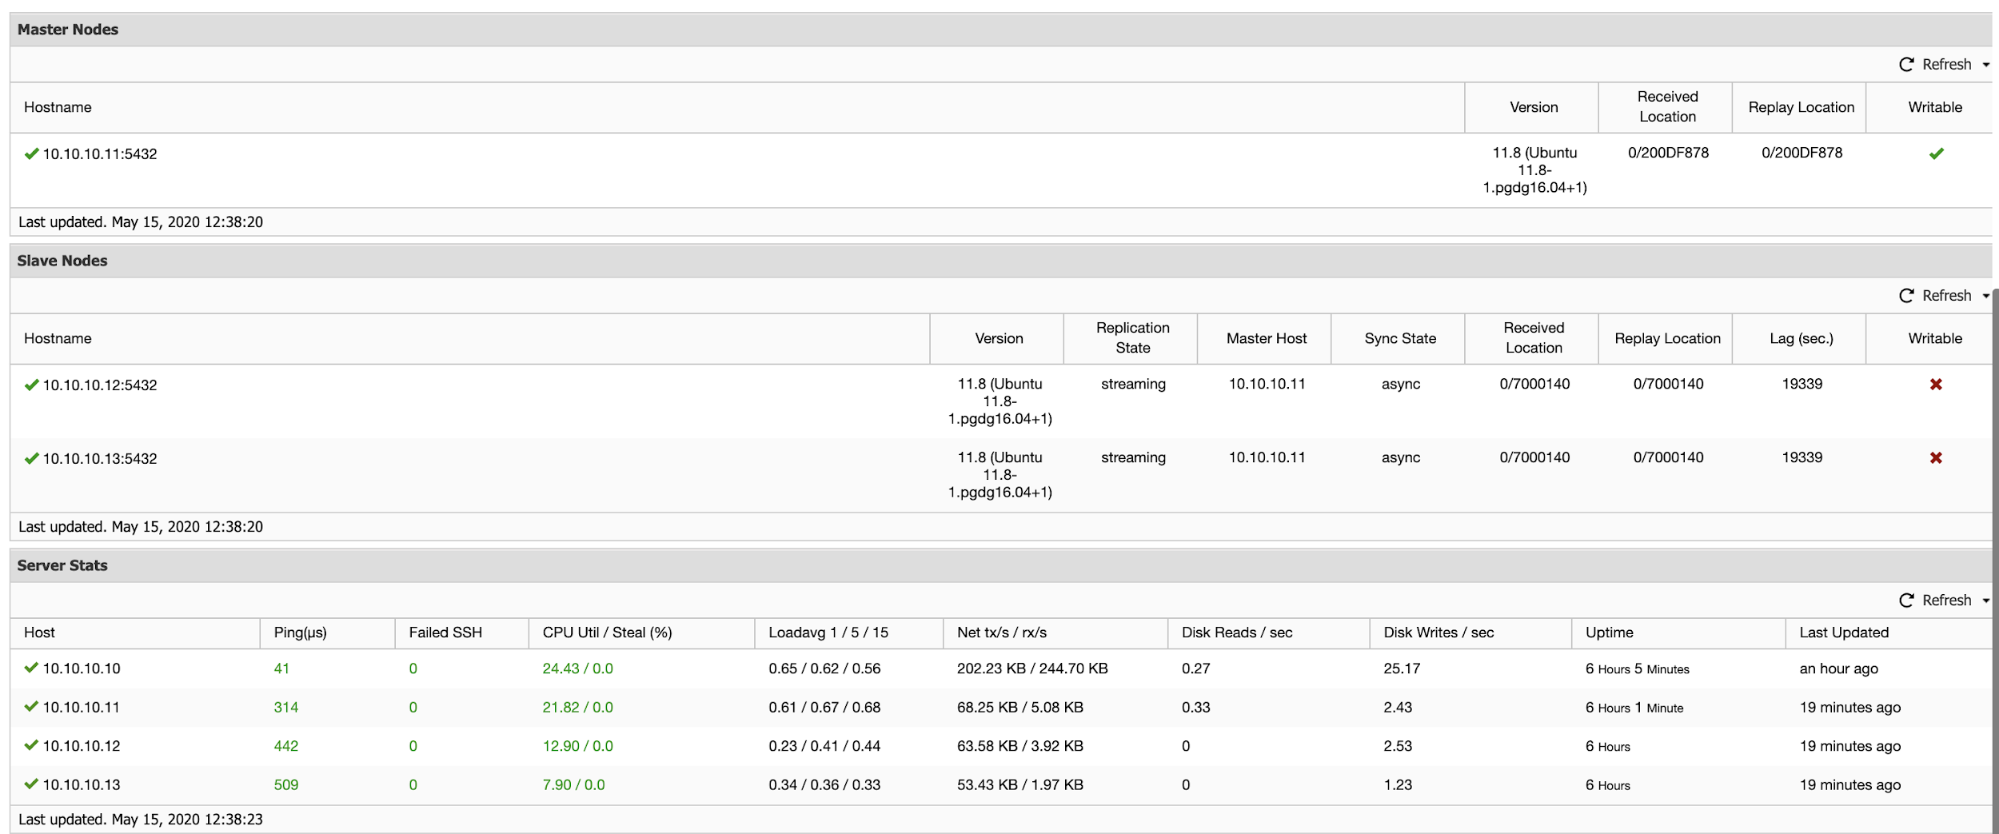
The Overview section contains information related to server load metrics ranging from connection, number of insert, delete, update, commit & rollback and connection. In addition, there is information such as health nodes, the replication status of the PostgreSQL database, and also information related to server utilization as shown in the figure below.
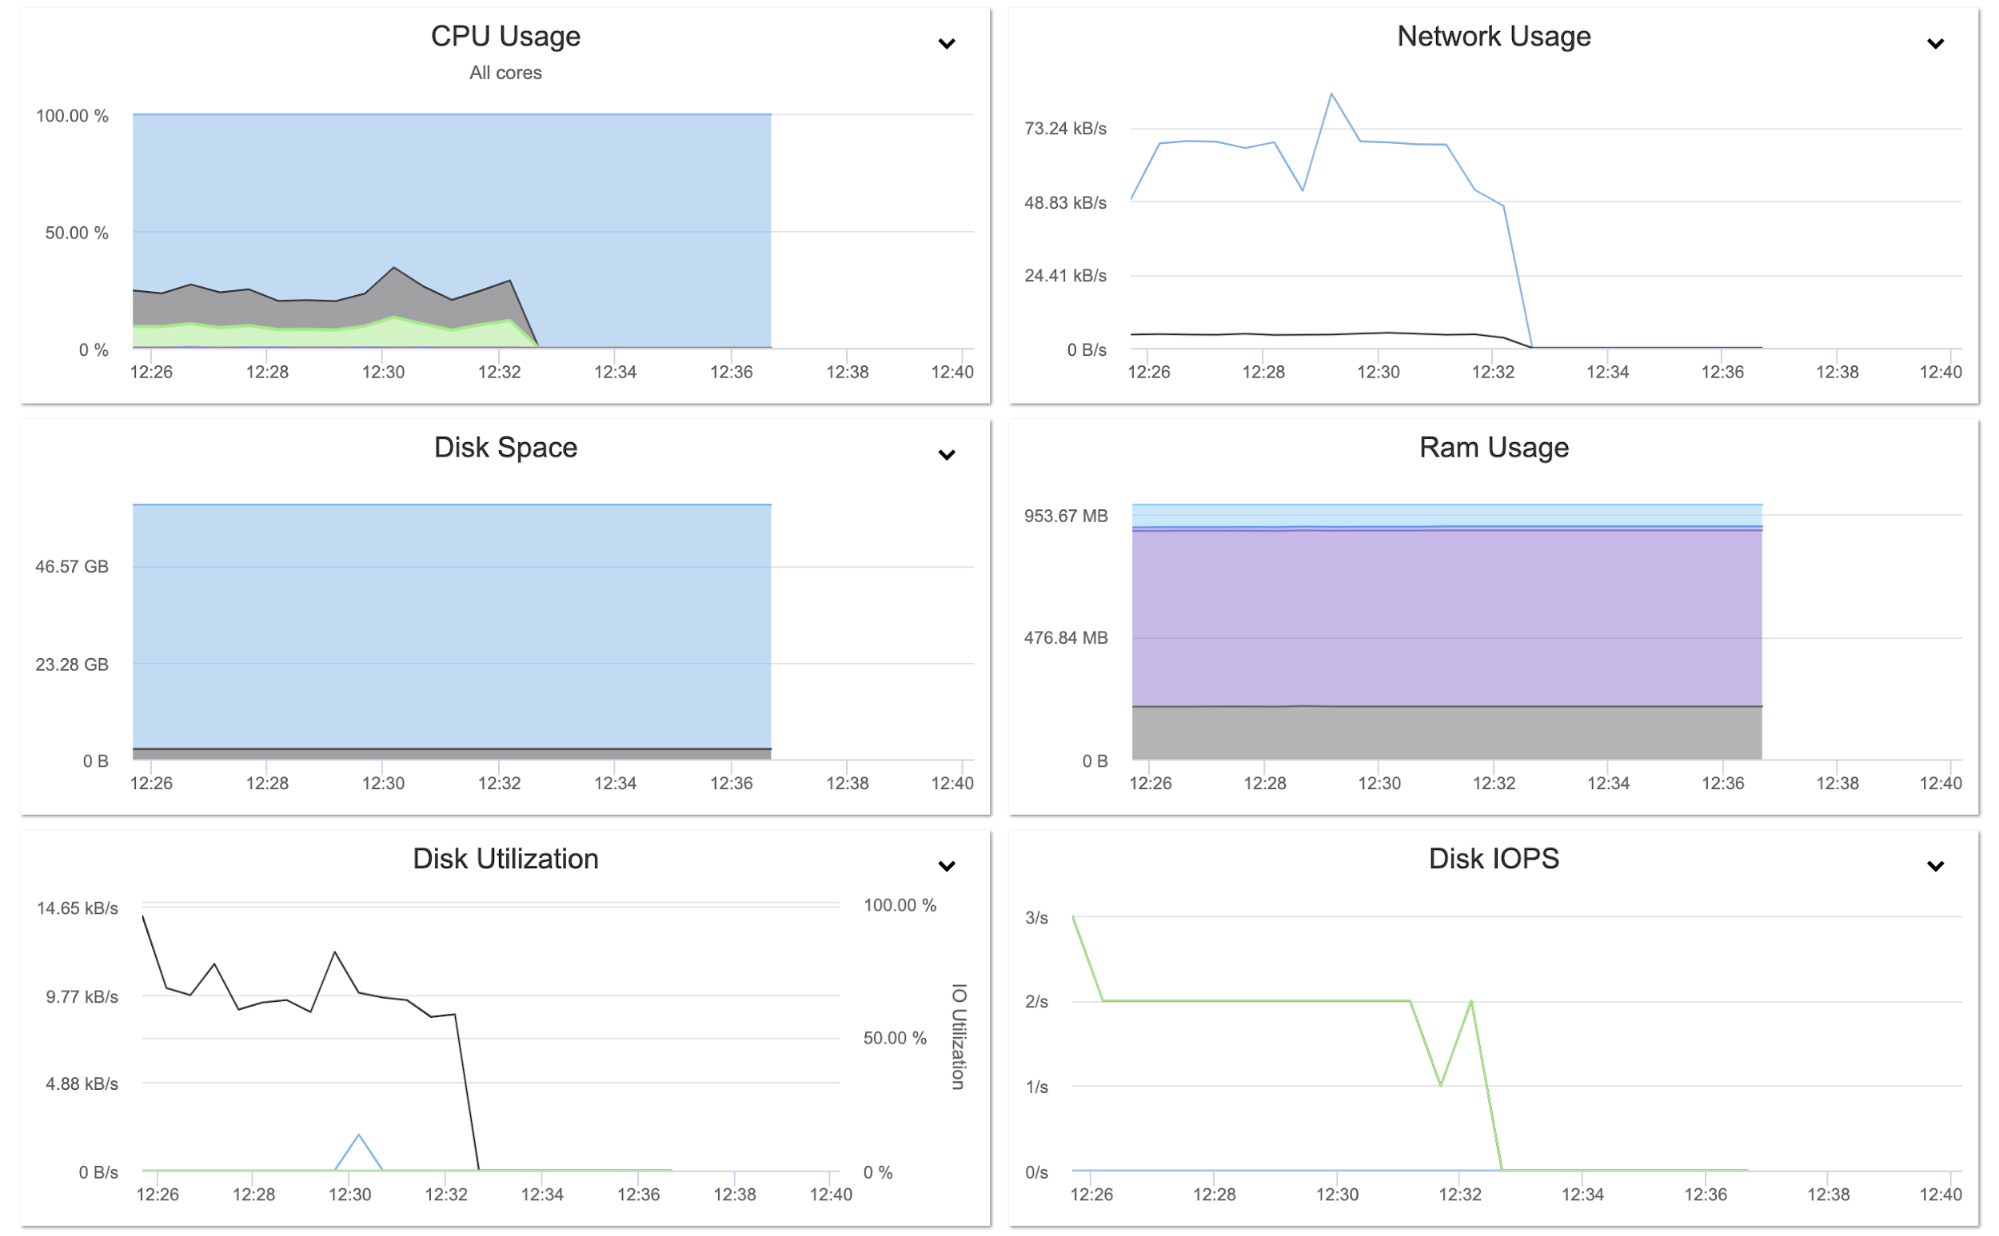
The Nodes tab provides graph-related information on the server side starting from CPU Utilization, Memory, Disk Usage, Network, and Swap Usage.
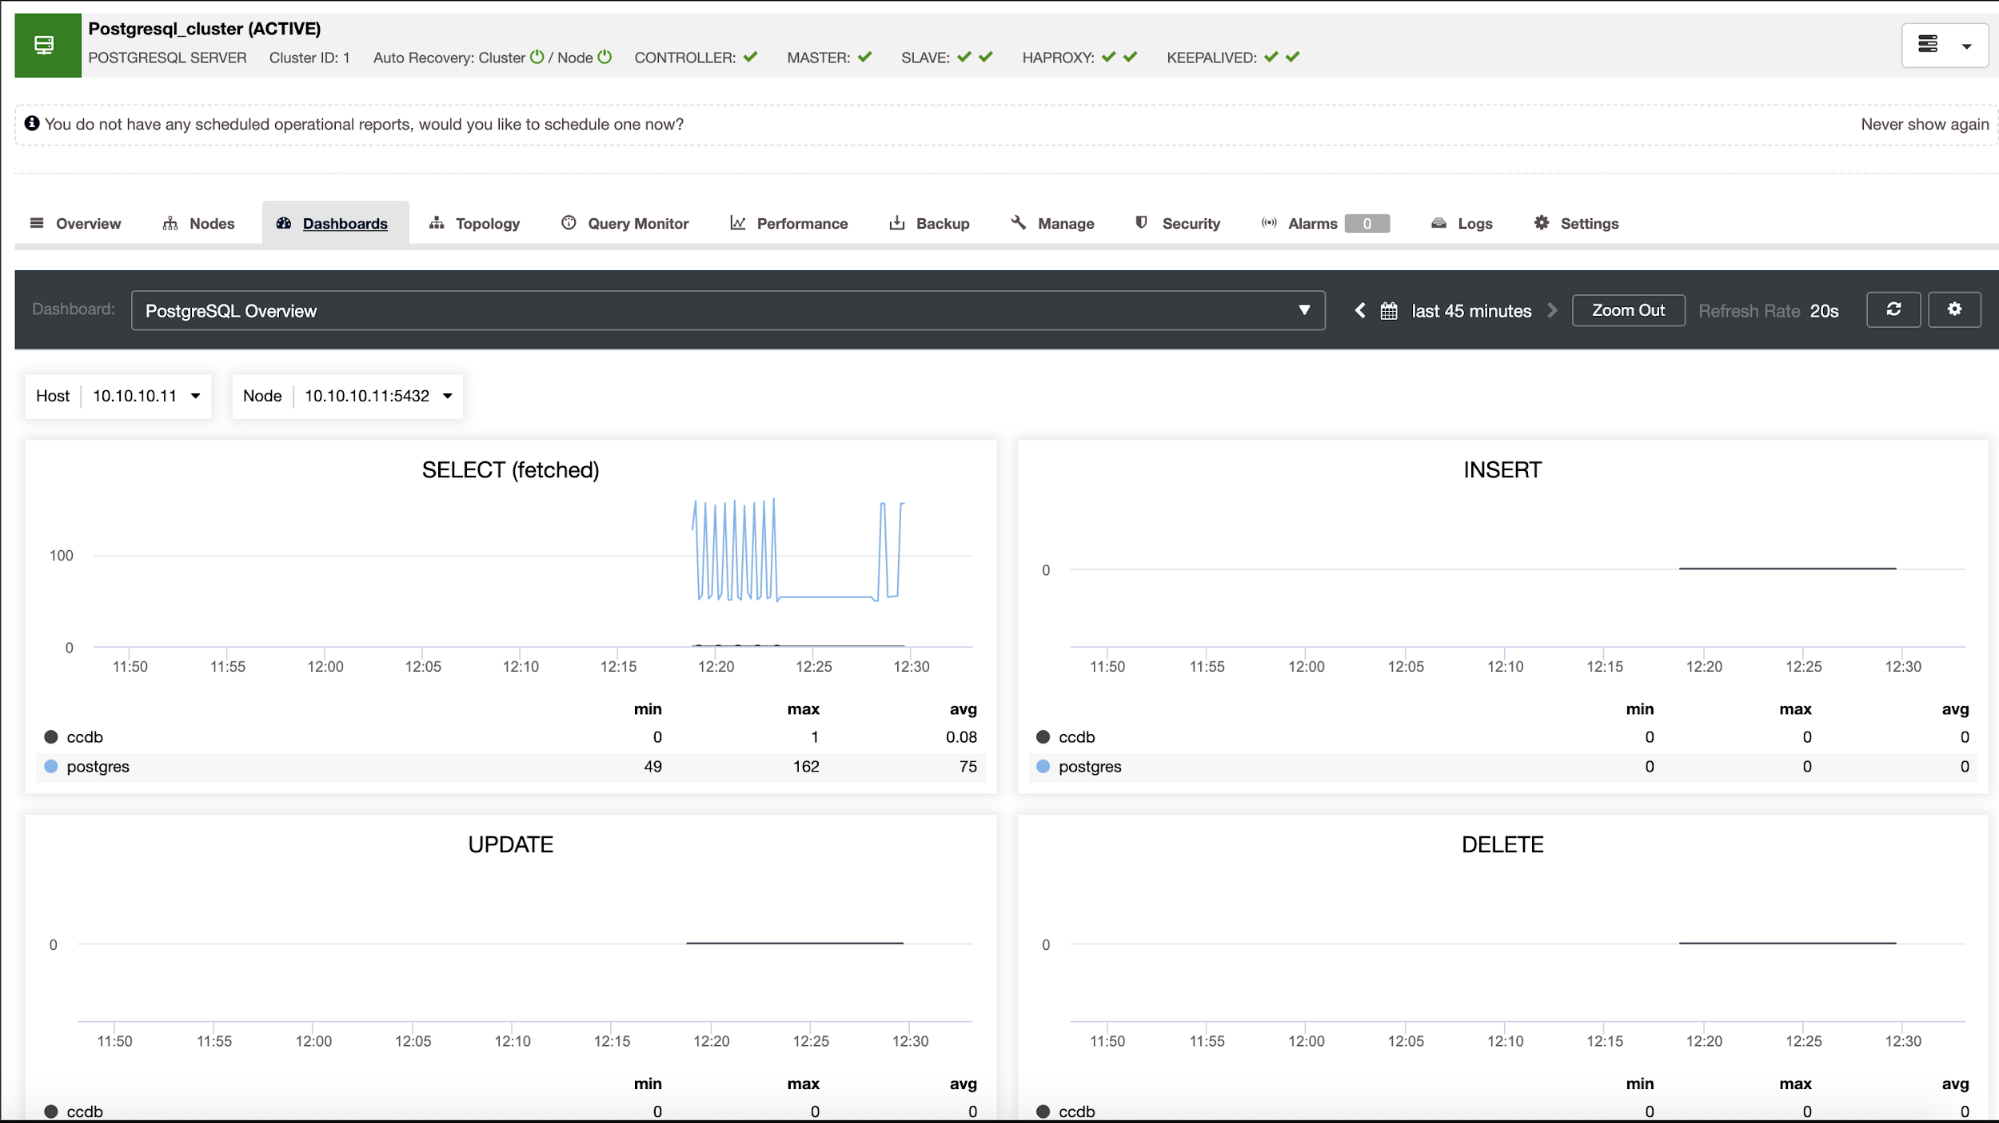
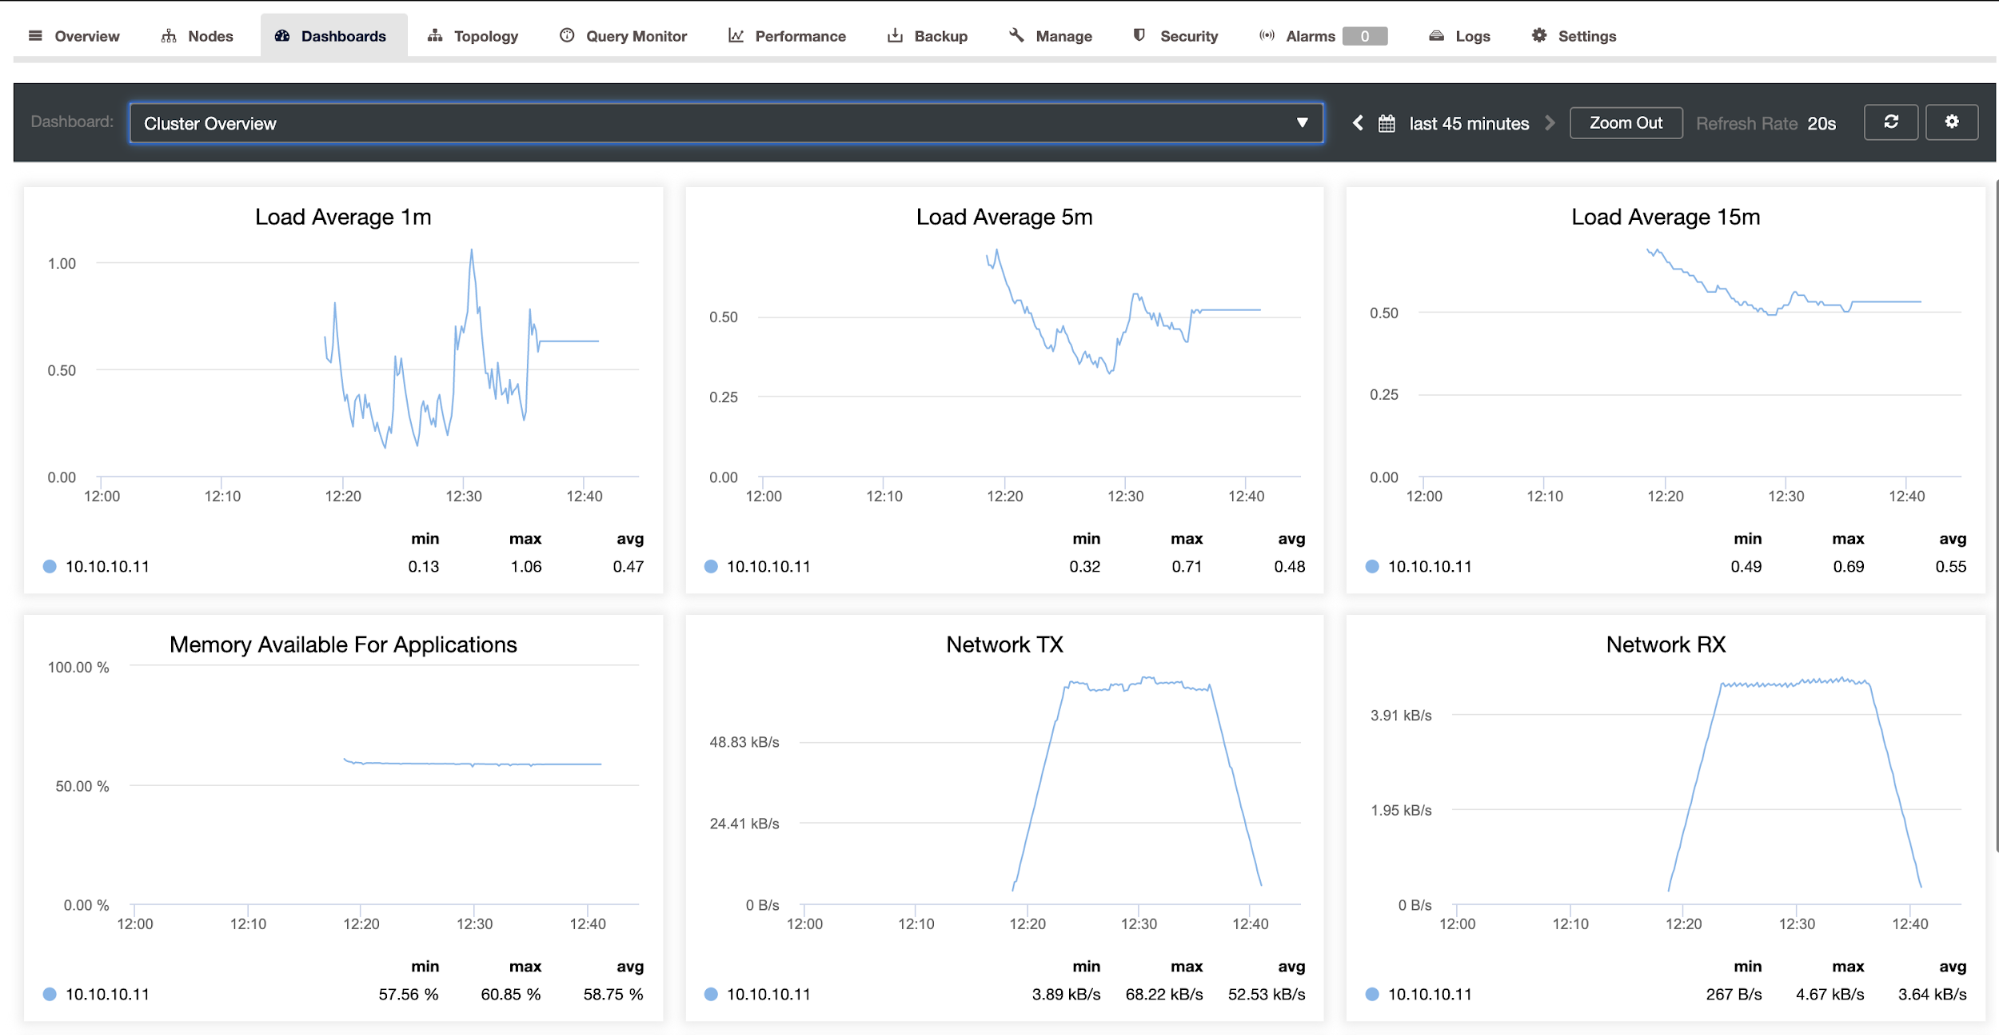
The Dashboard has several metrics options such as System Overview, Cluster Overview, and PostgreSQL Overview. For each option there are various metrics that are related to the running system condition. For example, in the PostgreSQL Overview metrics, there is information ranging from Load averages from the database, Memory Available, and Network transmission and receiving as shown below.
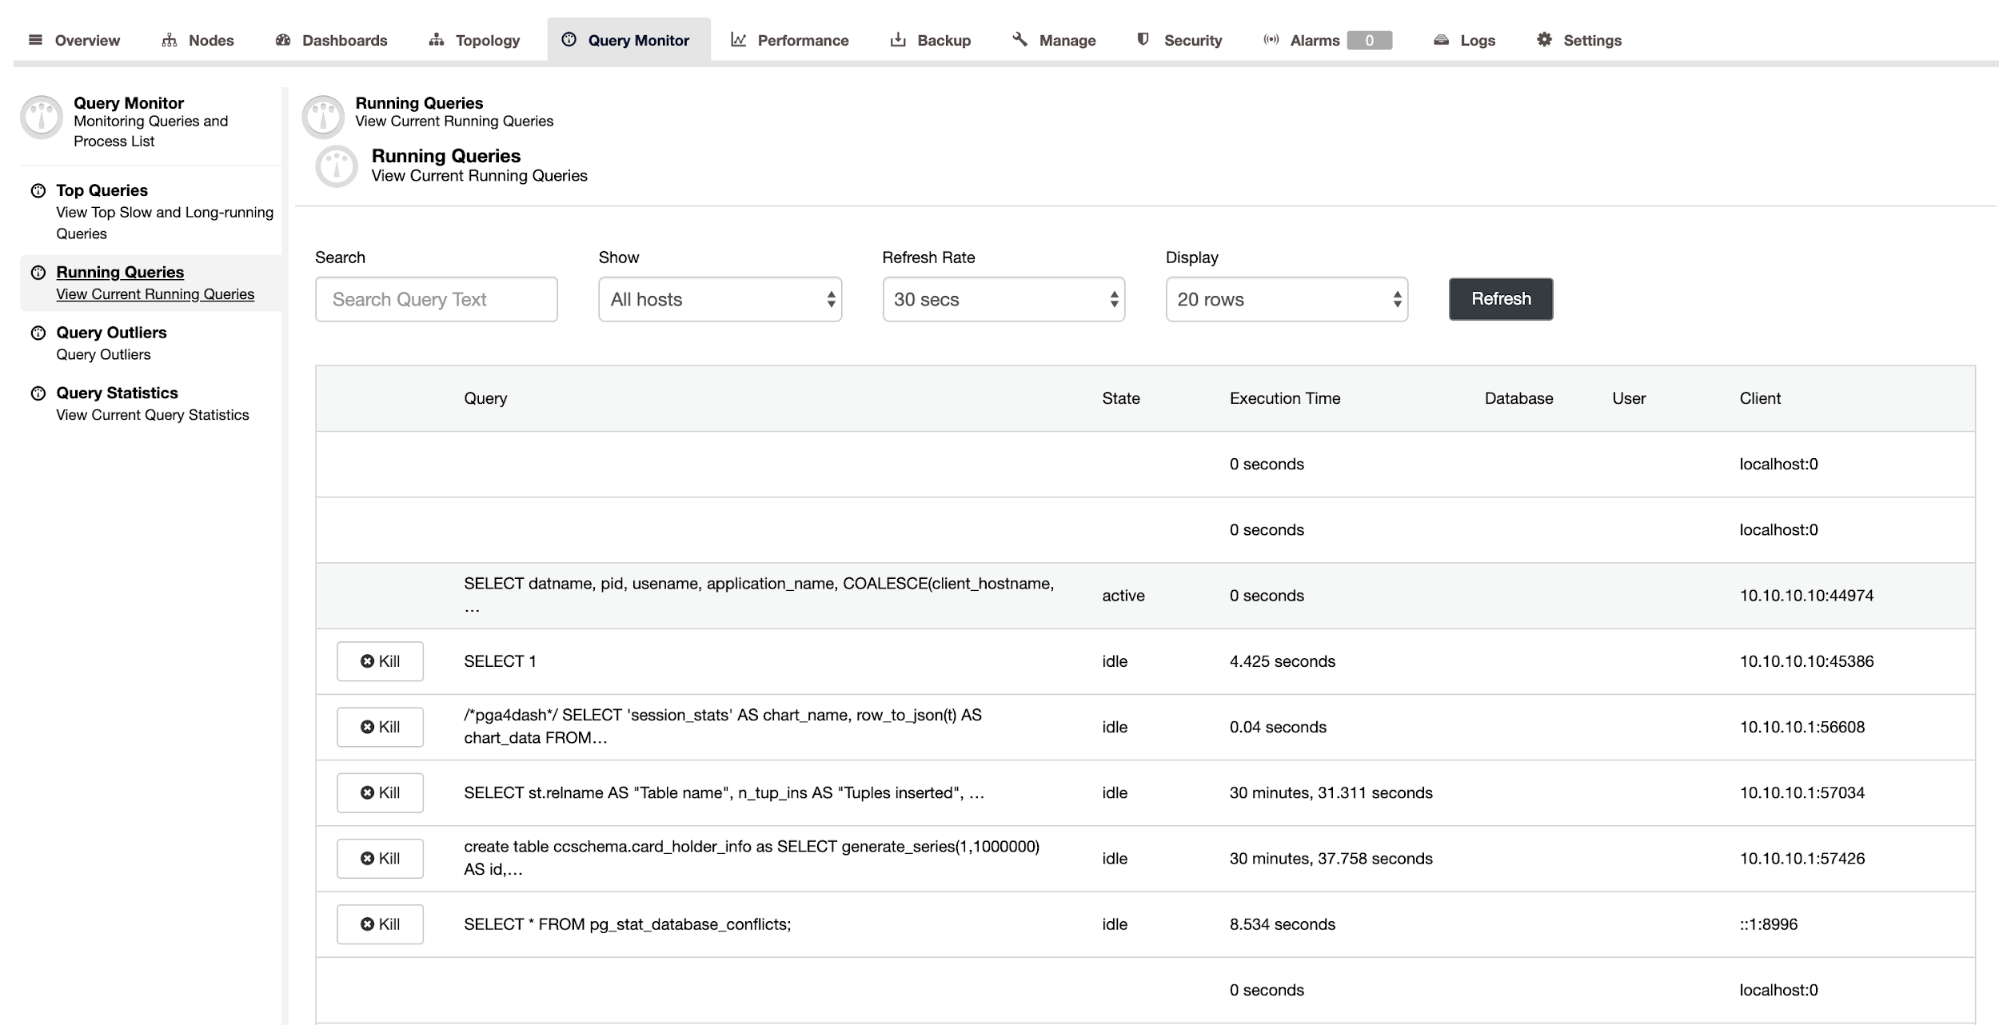
The Query Monitor contains information related to running queries that run on the database. We can find out what queries are running, how long is the execution time, source client address information, and the state of the session. Besides that, there is a Kill session feature, where we can terminate the session that causes the database to experience delays. The following is the display from Query Monitor:
In addition to running queries, we can also view Query Statistics information, starting from Access by Sequential or index scan, Table I / O Statistics, Index I / O Statistics, Database Size, Top 10 Largest Tables.
The Performance tab contains information related to database variables and the value currently running, besides that there is an Advisor to provide input related to the follow-up of the warning that occurred.
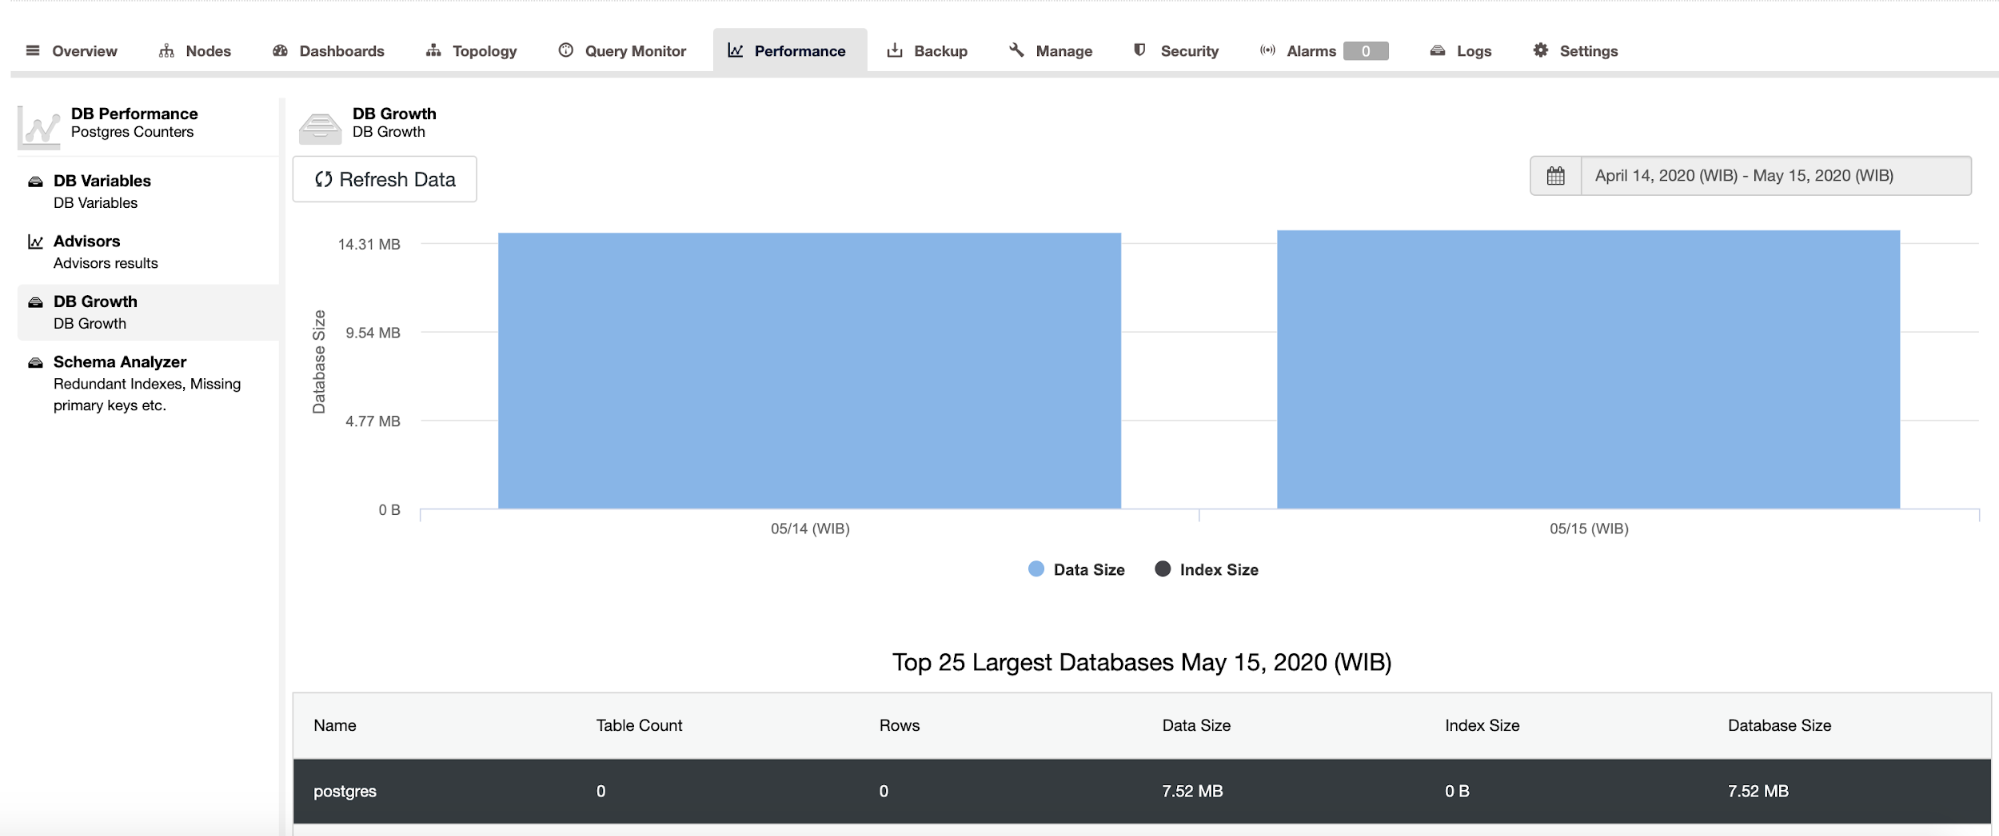
The growth of databases and tables can also be monitored on the DB Growth menu, you can predict storage needs or other actions that will be performed by analyzing the metrics of the growth of these databases and tables.
PostgreSQL Administration Tasks with pgAdmin
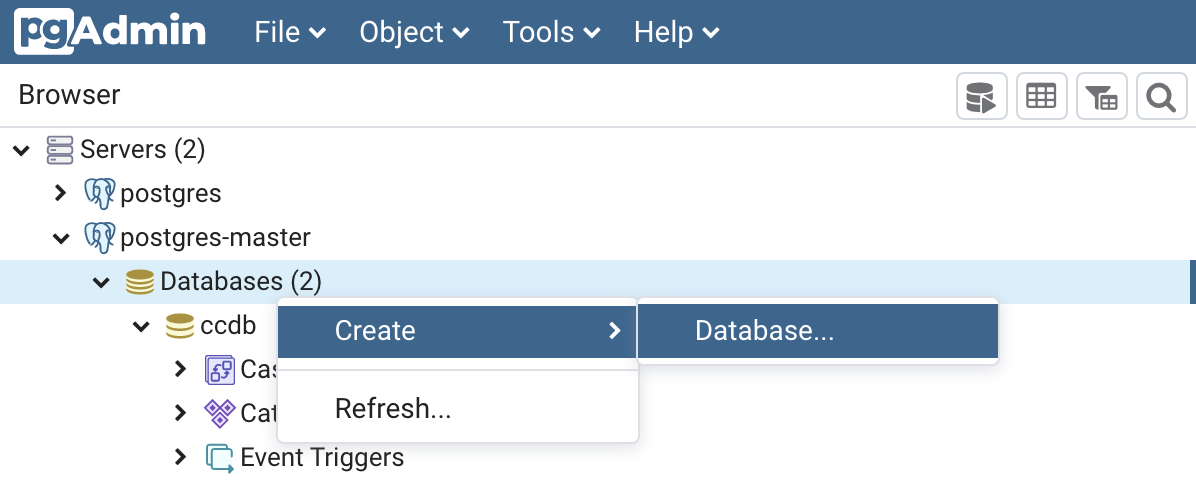
pgAdmin has various features for database administration and objects that are in the database ranging from creating tables, indexes, users, and tablespaces. The various features of pgAdmin are very useful for both Developer and DBA, because they make it very easy to manage database objects. Following is the appearance of the Menu Tree in pgAdmin.
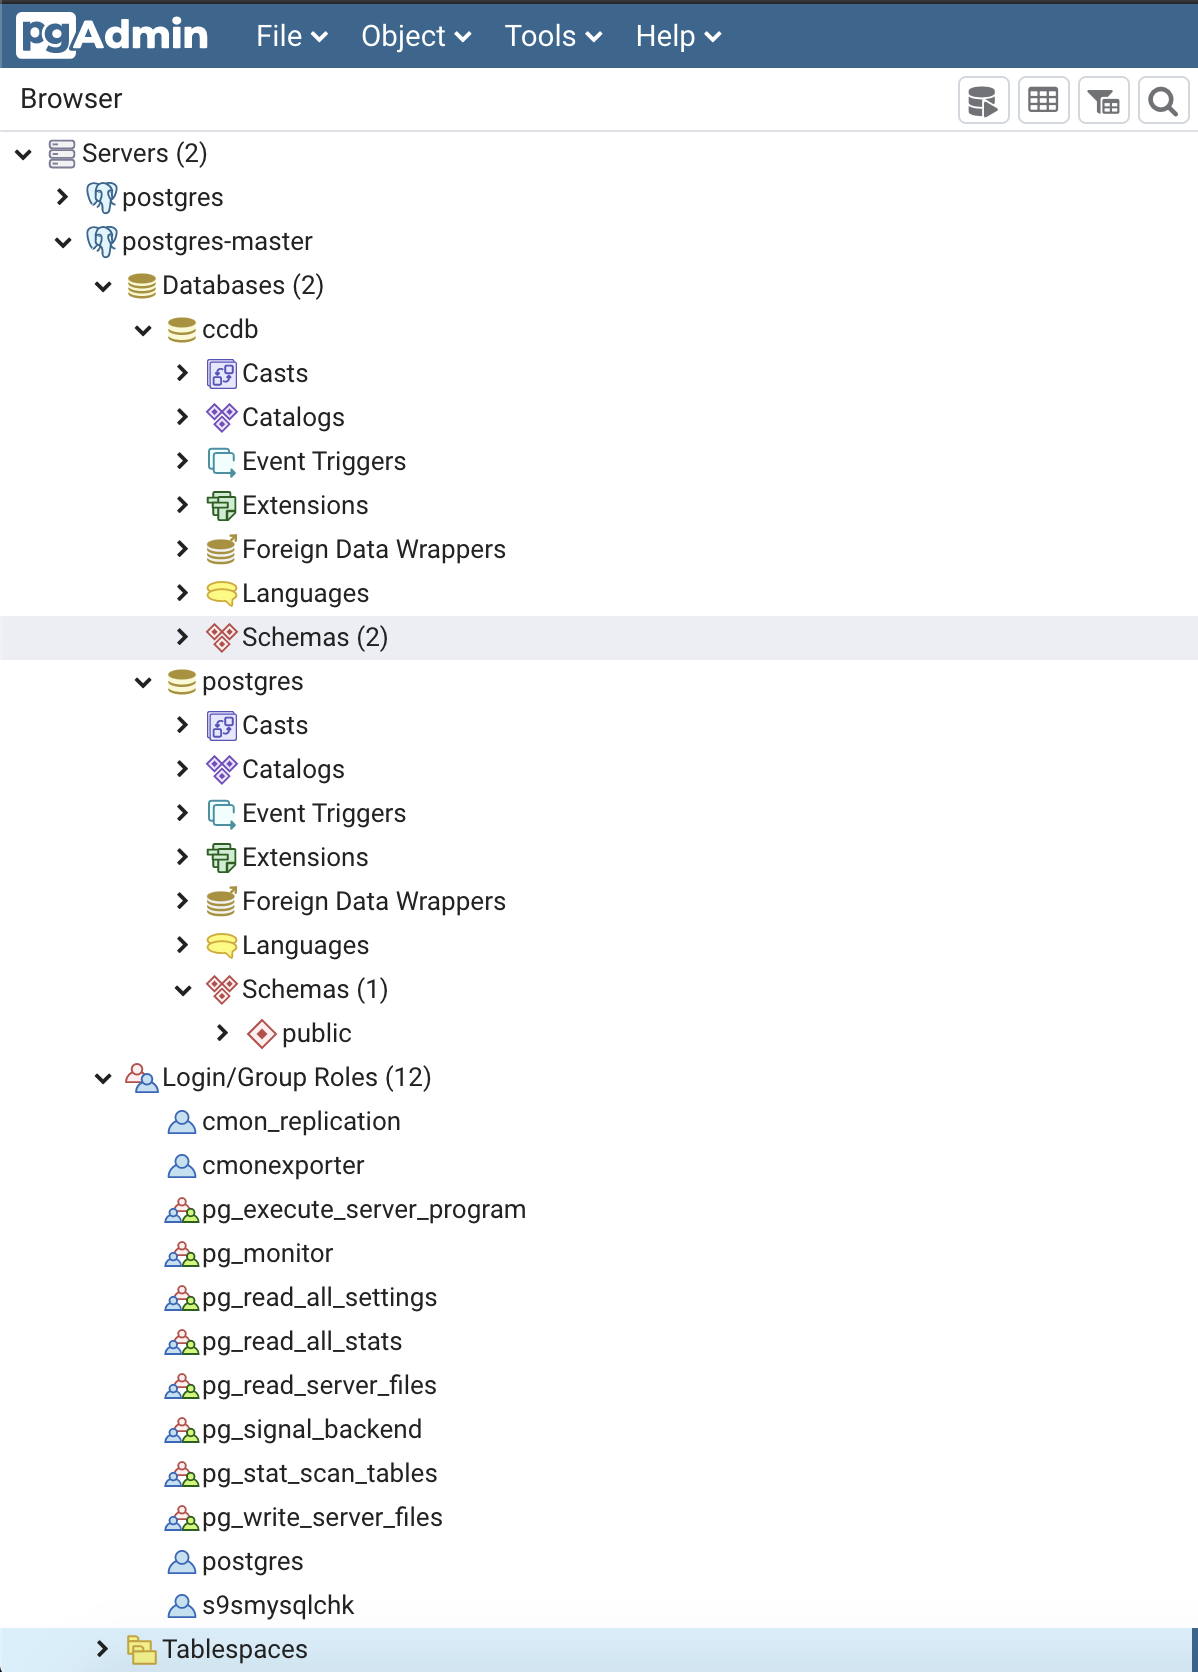
You can just do right click on the object to be highlighted, then there will be actions that can be done from that object. For example, highlighting Database, then you can create a new database like this:
There will be a dialog box to fill in the database name information, the owner of the database to be created, the encoding that will be used, the tablespace that will be used by the database, security access to the database.
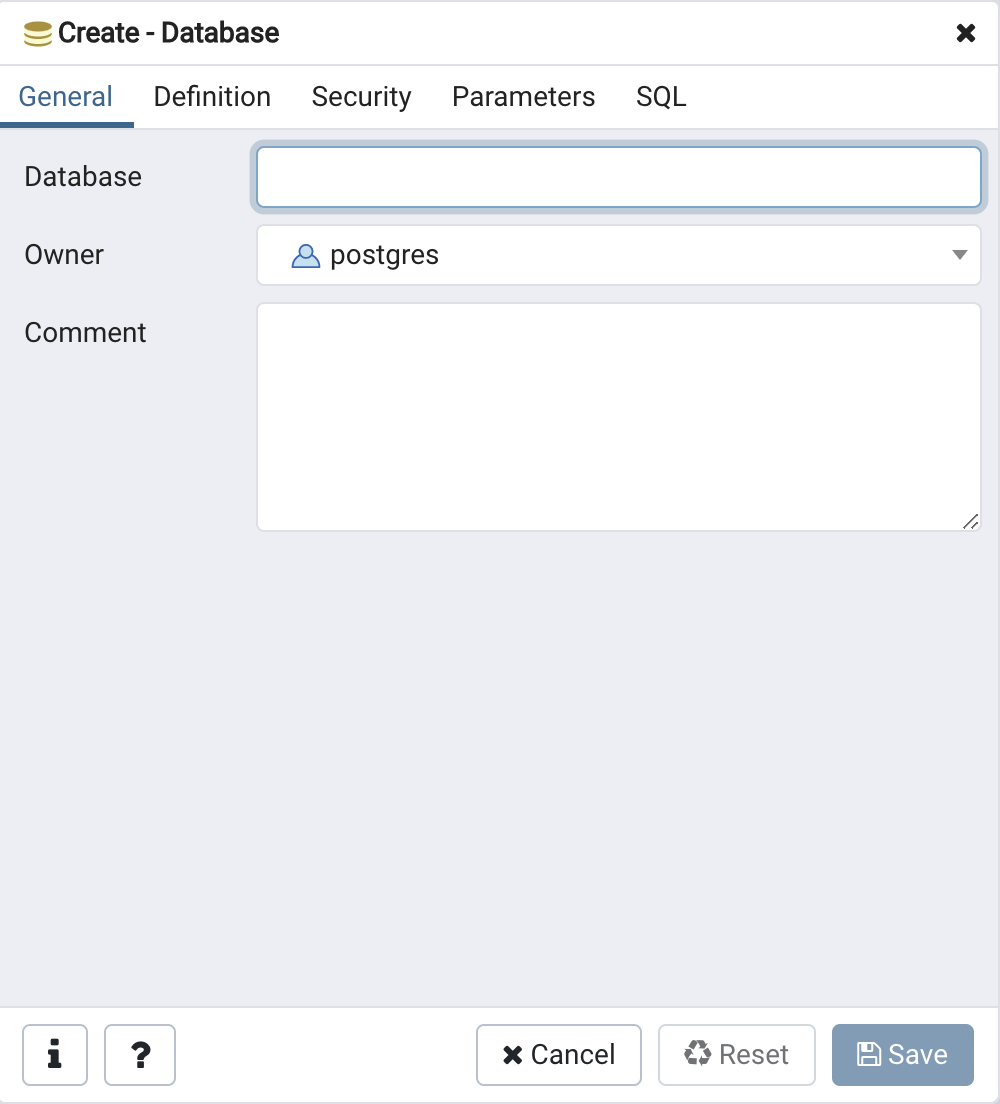
What users have the right to access, and what privileges will be given.
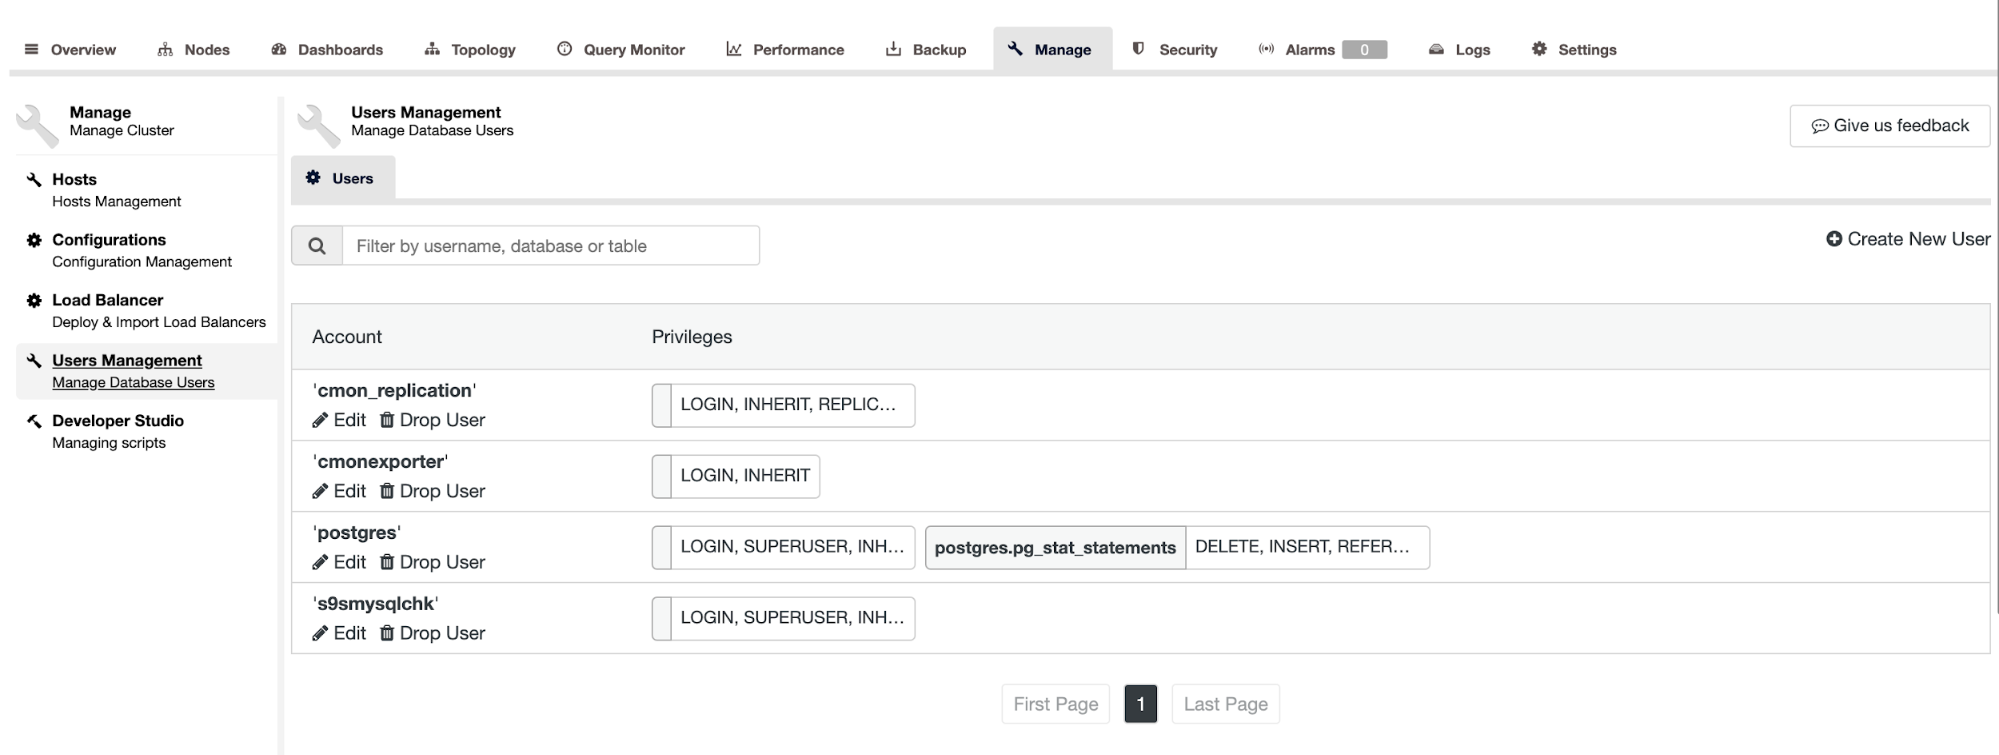
PostgreSQL Administration Tasks with ClusterControl
ClusterControl can also create users and privileges that will be given to User Management as shown in the following figure.
With ClusterControl you can deploy highly available PostgreSQL databases. Managing your PostgreSQL is as easy as just clicking on the menu in dashboard. There are some features for administering your PostgreSQL in Cluster side, such as Add Load Balancer, Add Replication Slave, Enable / Disable Cluster Recovery and Node Recovery as shown below .
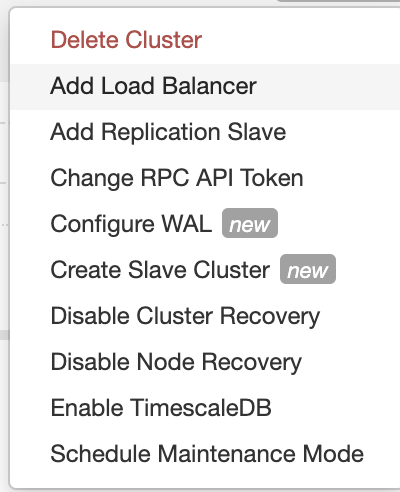
You can also create a new PostgreSQL cluster and have it replicate from the running cluster, using the Create Slave Cluster menu item. Cluster-to-Cluster replication is a new feature provided by ClusterControl.
In the Node side, there are several database administrative tasks you can do, such as Reboot Host, Restart Node, Stop Node, Promote Slave, Stop Slave. You can access your hosts remotely through SSH Console.
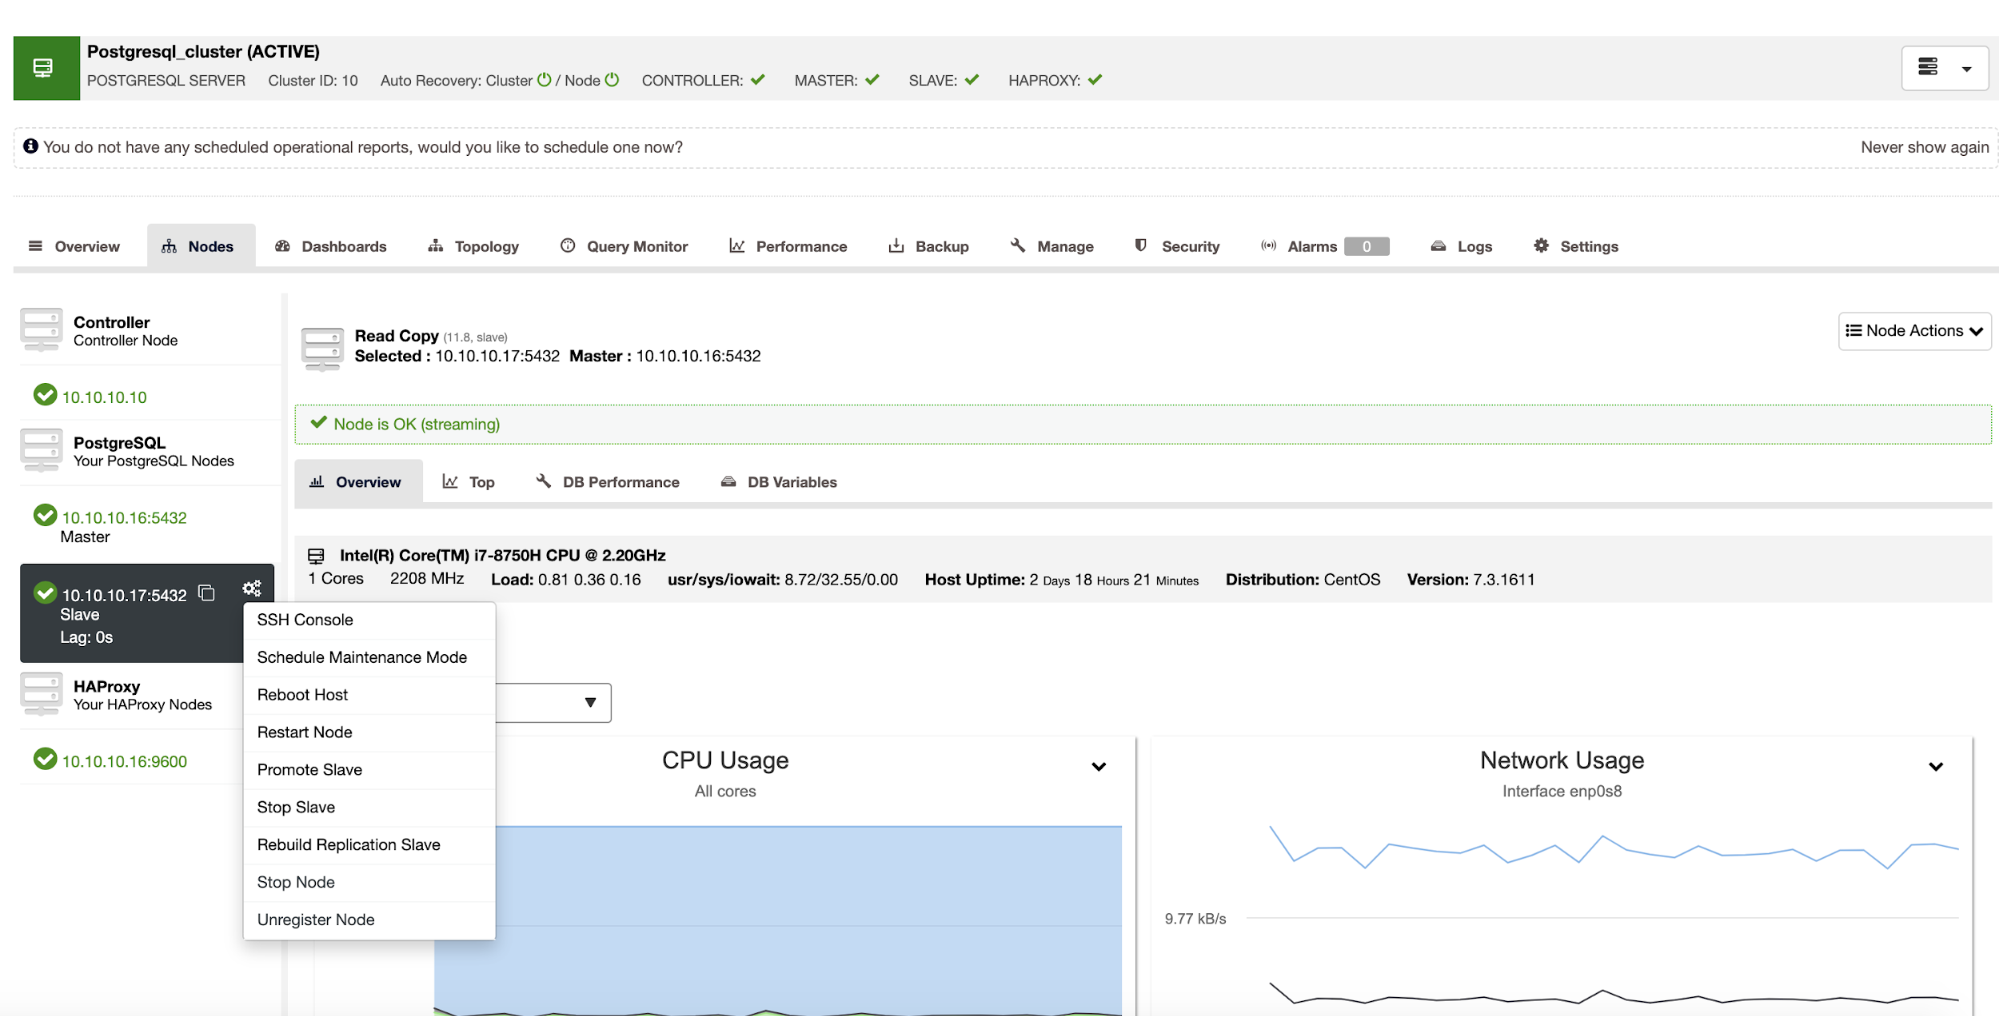
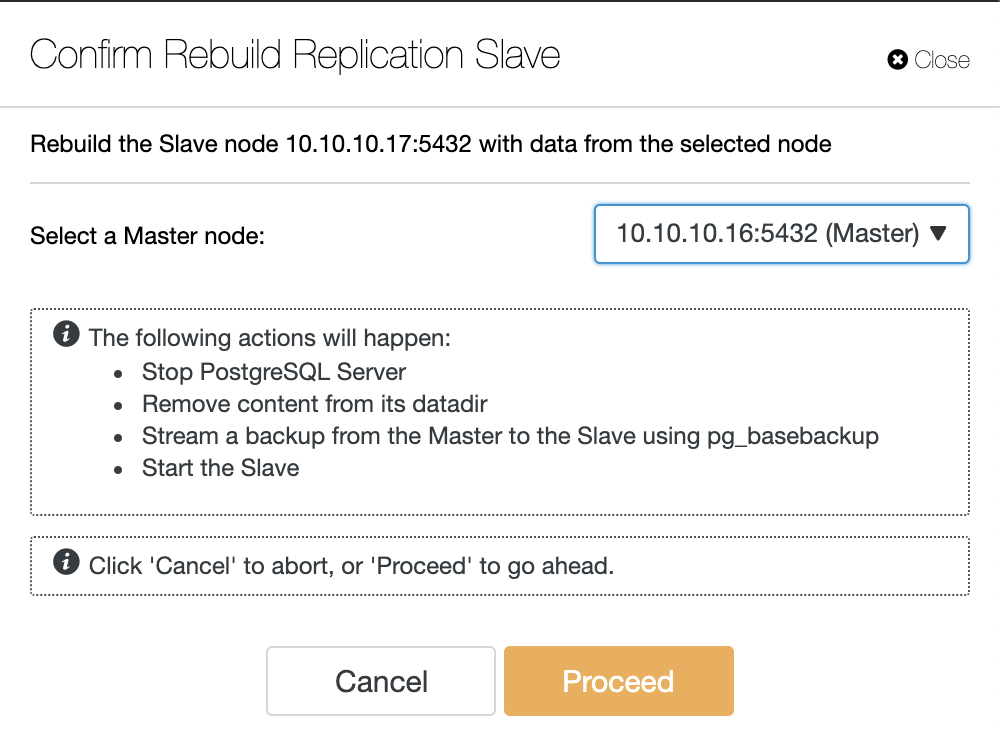
Rebuild Replication Slave is a neat feature to automatically fix slave servers that broke beyond repair. It stops the slave, wipes out its contents and streams a fresh backup from the master server. Once the backup is applied, replication is resumed so it can catch up with the master again. All this with just a click.
There is also a feature to visualize the current state of your PostgreSQL Topology architecture in ClusterControl.
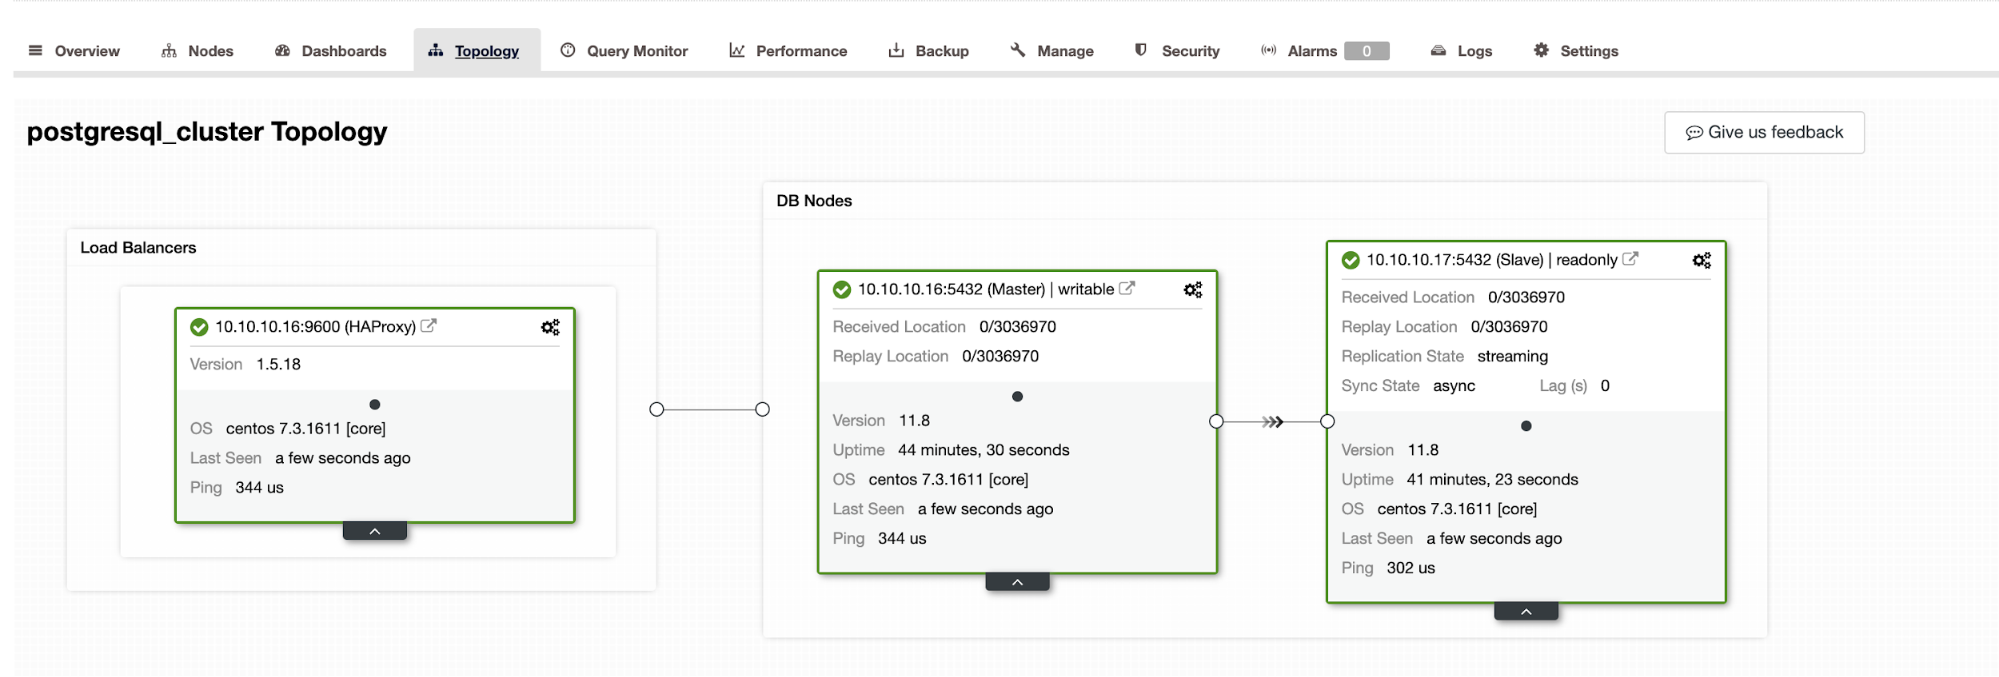
It provides, at a quick glance, useful information about current PostgreSQL Cluster such as latency between the nodes, database uptime, version of database that you use, the state of synchronization, replication lag.
You can also change the configuration related to the database parameters and the ACL ip address that has the right to access the database in the Configuration menu.
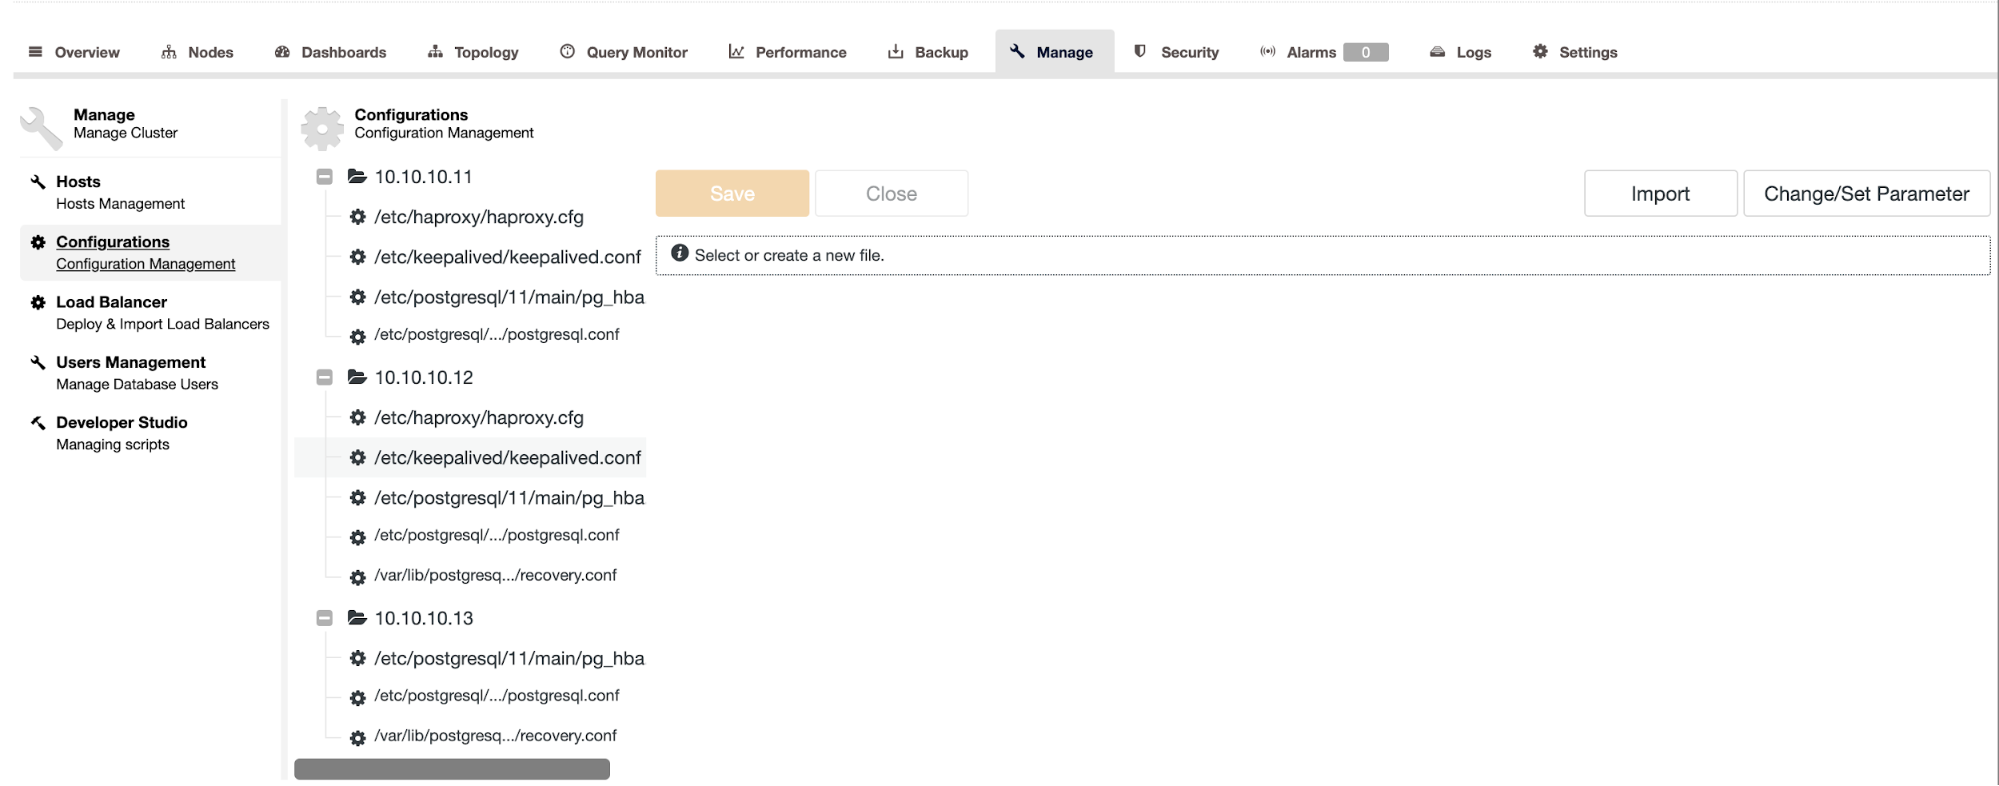
Running a distributed database environment usually requires some sort of load balancing and traffic control, as there are multiple database instances and applications would not keep track of which one is the writeable master and which ones are the read-only slaves. ClusterControl allows you to integrate HAProxy for this purpose. HAProxy can itself be made highly available using Keepalived, so that applications can connect using one Virtual IP address that is floated to another instance in case the primary HAProxy load balancer goes down.
ClusterControl has other features like operational reports, that provide analytics on server usage, uptime, security and capacity on a weekly or monthly basis. pgAdmin is great at manipulating objects in the database, whereas ClusterControl is more targeted at operating the system and keeping it up.