blog
Monitoring PostgreSQL in a Hybrid Environment

Hybrid Cloud is a recent concept that has been increased for a few years, and now is a common topology in any company for a Disaster Recovery Plan (DRP), or even to have redundancy on your systems.
Once you have your Hybrid Cloud environment up-and-running, you will need to know what is happening all the time. Monitoring is a must if you want to be sure everything is going fine or if you might need to change something. For each database technology, there are several things to monitor. Some of these are specific to the database engine, vendor, or even the specific version that you are using.
In this blog, we will see what you need to monitor in a PostgreSQL database running on a Hybrid Cloud environment and how ClusterControl can help you on this task.
What to Monitor in PostgreSQL
When monitoring a database cluster or node, there are two main things to take into account: the operating system and the database itself. You will need to define which metrics you are going to monitor from both sides and how you are going to do it.
Keep in mind that when one of your metrics is affected, it can also affect others, making troubleshooting of the issue more complex. Having a good monitoring and alerting system is important to make this task as simple as possible.
Operating System Monitoring
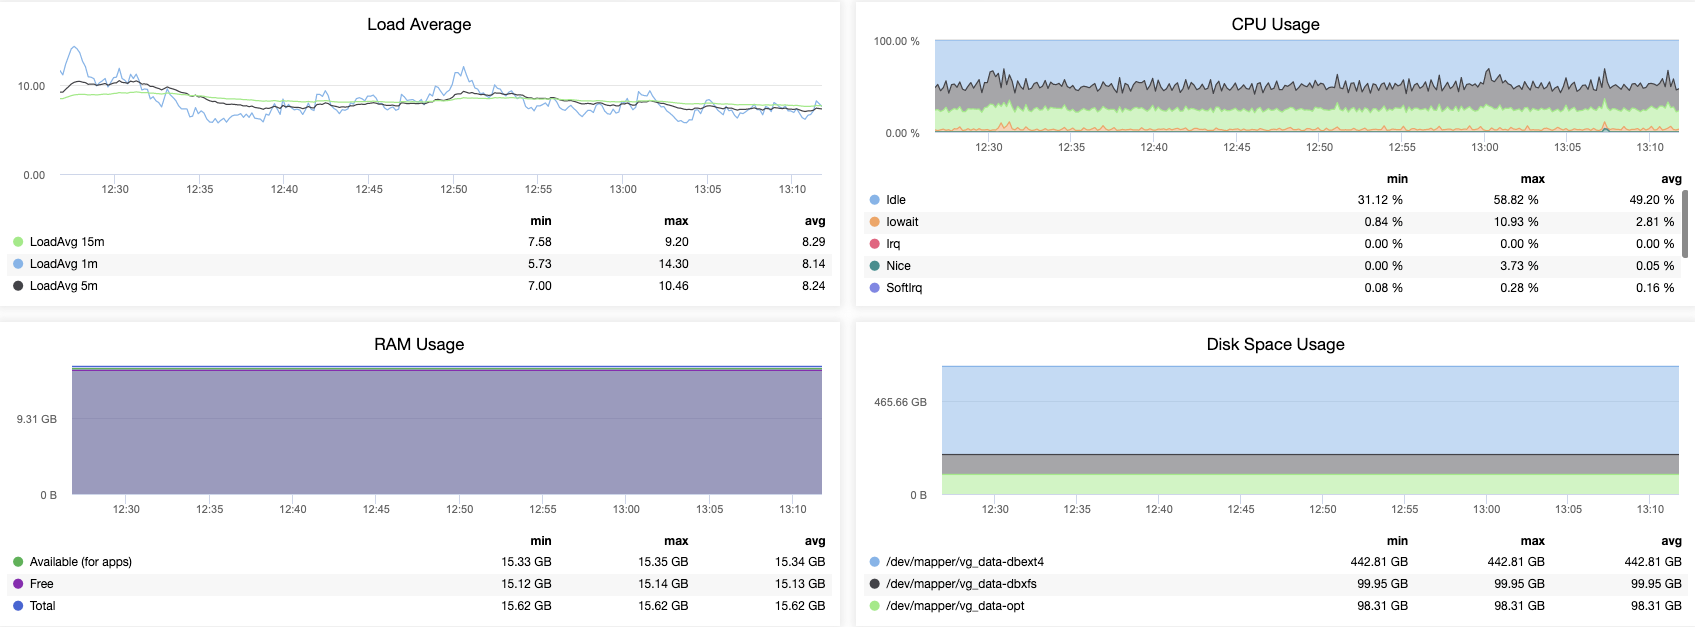
One important thing (which is common to all database engines and even to all systems) is to monitor the Operating System behavior. Let’s see some points to check here.
CPU Usage
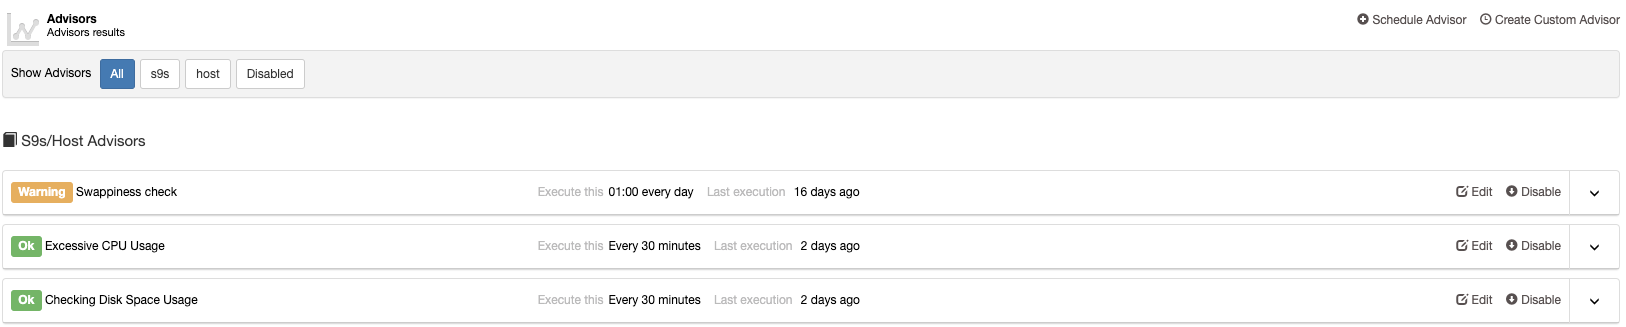
An excessive percentage of CPU usage could be a problem if it is not usual behavior. In this case, it is important to identify the process/processes that are generating this issue. If the problem is the database process, you will need to check what is happening inside the database.
RAM Memory or SWAP Usage
If you are seeing a high value for this metric and nothing has changed in your system, you probably need to check your database configuration. Parameters like shared_buffers and work_mem can affect this directly as they define the amount of memory to be able to use for the PostgreSQL database.
Disk Usage
An abnormal increase in the use of disk space or an excessive disk access consumption are important things to monitor as you could have a high number of errors logged in the PostgreSQL log file or a bad cache configuration that could generate an important disk access consumption instead of using memory to process the queries.
Load Average
It is related to the three points mentioned above. A high load average could be generated by excessive CPU, RAM, or disk usage.
Network
A network issue can affect all the systems as the application can’t connect (or connect losing packages) to the database, so this is an important metric to monitor indeed. You can monitor latency or packet loss, and the main issue could be a network saturation, a hardware issue, or just a bad network configuration.
Database Monitoring
Monitoring your PostgreSQL database is not only important to see if you are having an issue, but also to know if you need to change something to improve your database performance, that is probably one of the most important things to monitor in a database. Let’s see some metrics that are important for this.
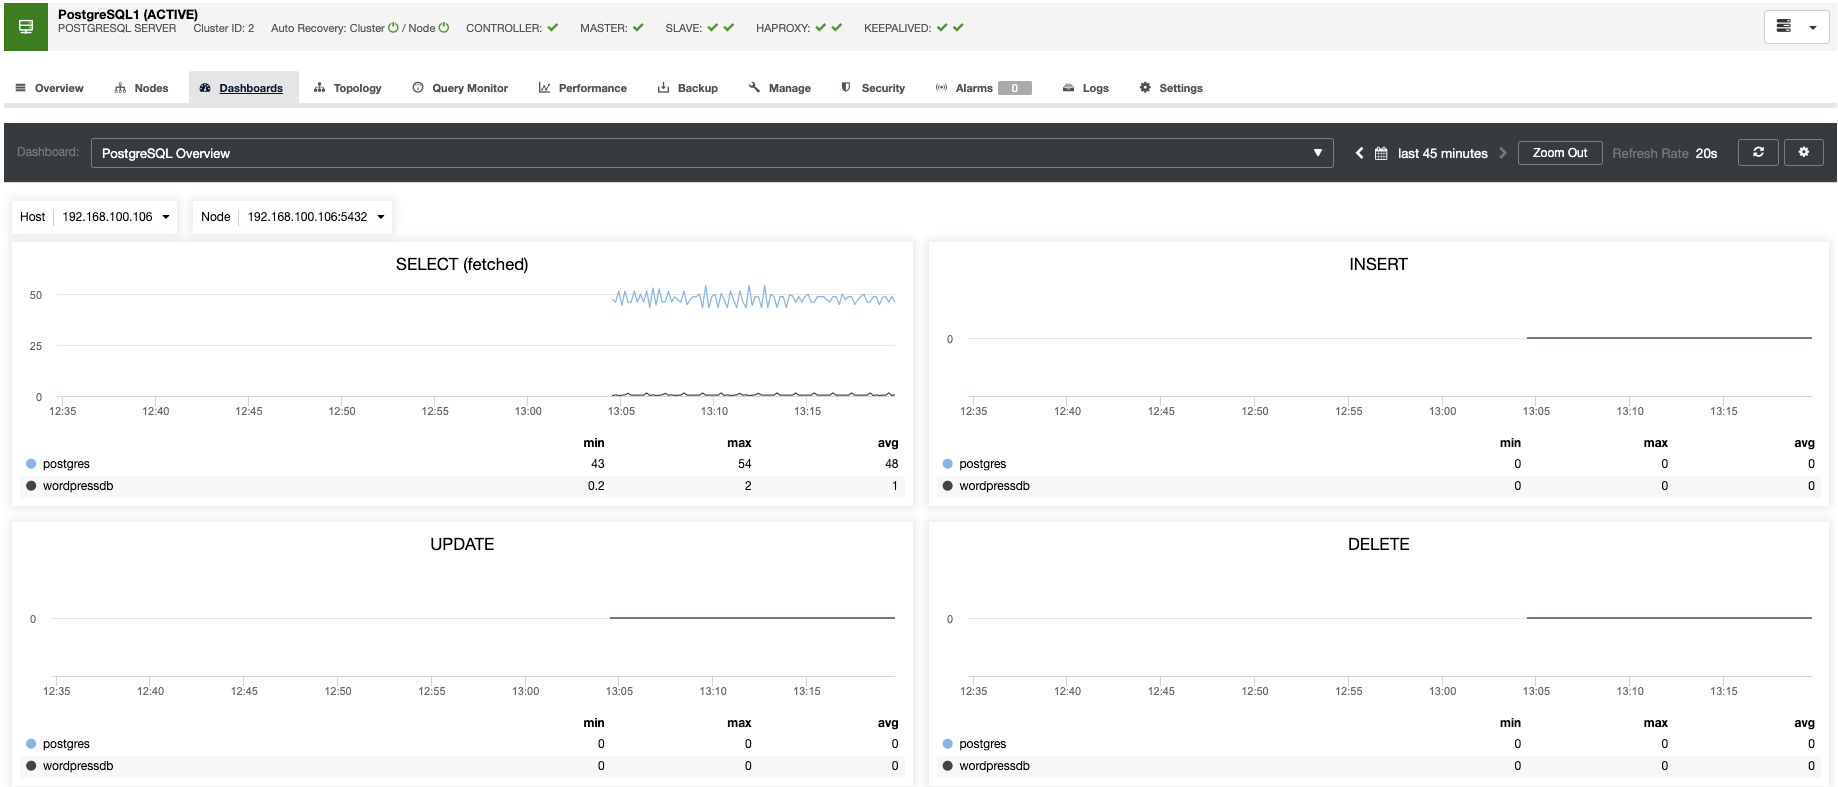
Query Monitoring
In general, the databases are configured with compatibility and stability in mind by default, so you need to know your queries and their pattern, and configure your databases depending on the traffic that you have. Here, you can use the EXPLAIN command to check the query plan for a specific query, and you can also monitor the amount of SELECT, INSERT, UPDATE, or DELETEs on each node. If you have a long query or a high number of queries running at the same time, that could be a problem for all the systems.
Active Sessions
You should also monitor the number of active sessions. If you are near the limit, you need to check if something is wrong or if you just need to increment the max connection value in the database configuration. The difference in the number can be an increase or decrease of connections. Bad usage of connection pooling, locking, or network issues are the most common problems related to the number of connections.
Database Locks
If you have a query waiting for another query, you need to check if that other query is a normal process or something new. In some cases, if somebody is making an update on a big table, for example, this action can be affecting the normal behavior of your database, generating a high number of locks.
Replication Status
The key metrics to monitor for replication are the lag and the replication state. The most common issues are networking issues, hardware resource issues, or under dimensioning issues. If you are facing a replication issue you will need to know this asap as you will need to fix it to ensure the high availability environment.
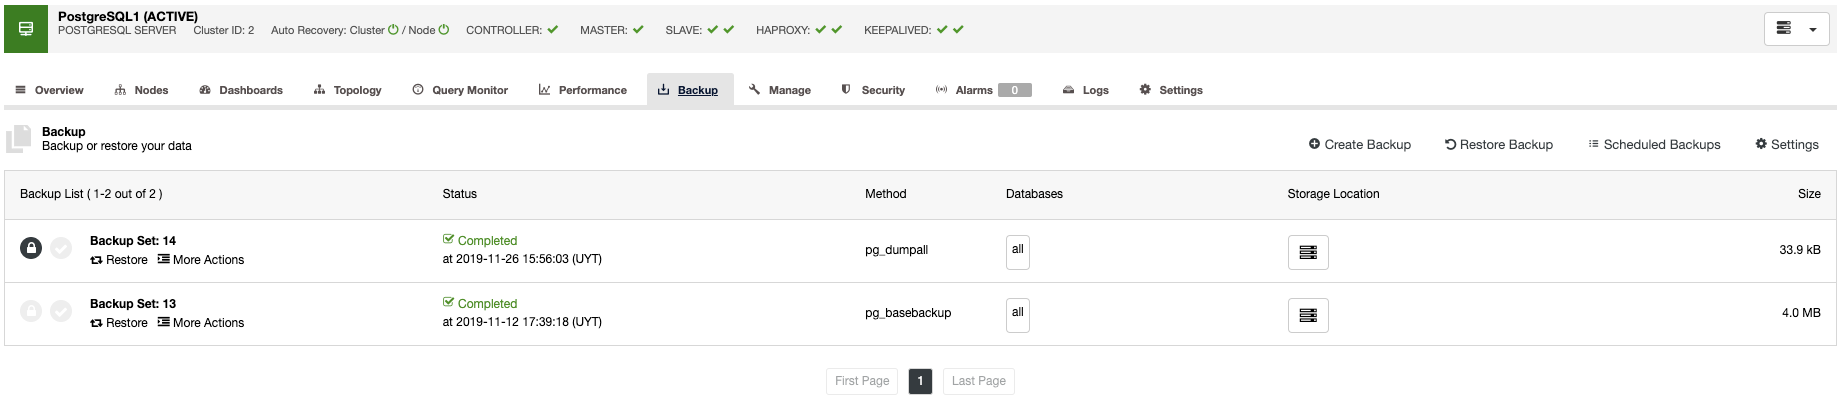
Backups
Avoiding data loss is one of the basic DBA tasks, so you don’t only need to take the backup, you should know if the backup was completed, and if it is usable. Usually, this last point is not taken into account, but it is probably the most important check in a backup process.
Database Logs
You should monitor your database log for errors, authentication issues, or even long-running queries. Most of the errors are written in the log file with detailed useful information to fix them.
Notifications and Alerting
Just monitoring a system is not enough if you don’t receive a notification about each issue. Without an alerting system, you should go to the monitoring tool to see if everything is fine, and it could be possible that you are having a big issue since many hours ago. This alerting job could be done by using email alerts, text alerts, or other tools like Slack.
It is really difficult to find a tool to monitor all the necessary metrics for PostgreSQL, in general, you will need to use more than one and even some scripting will need to be made. One way to centralize the monitoring and alerting task is by using ClusterControl, which provides you with features like backup management, monitoring and alerting, deployment and scaling, automatic recovery, and more important features to help you manage your databases. All these features on the same system.
One important point here is that ClusterControl works on the Cloud, On-prem, or even a combination of both. The requirement here is to have SSH access to the nodes, and then, ClusterControl will take care of them.
Monitoring Your PostgreSQL Database with ClusterControl
ClusterControl is a management and monitoring system that helps to deploy, manage, monitor, and scale your databases from a friendly interface. It has support for the top open-source database technologies and you can automate many of the database tasks you have to perform regularly like adding and scaling new nodes, running backups and restores, and more.
ClusterControl allows you to monitor your servers in real-time with a predefined set of dashboards to analyze some of the most common metrics.
It allows you to customize the graphs available in the cluster, and you can enable the agent-based monitoring to generate more detailed dashboards.
You can also create alerts, which inform you of events in your cluster, or integrate with different services such as PagerDuty or Slack.
In the query monitor section, you can find the top queries, the running queries, queries outliers, and the queries statistics to monitor your database traffic.
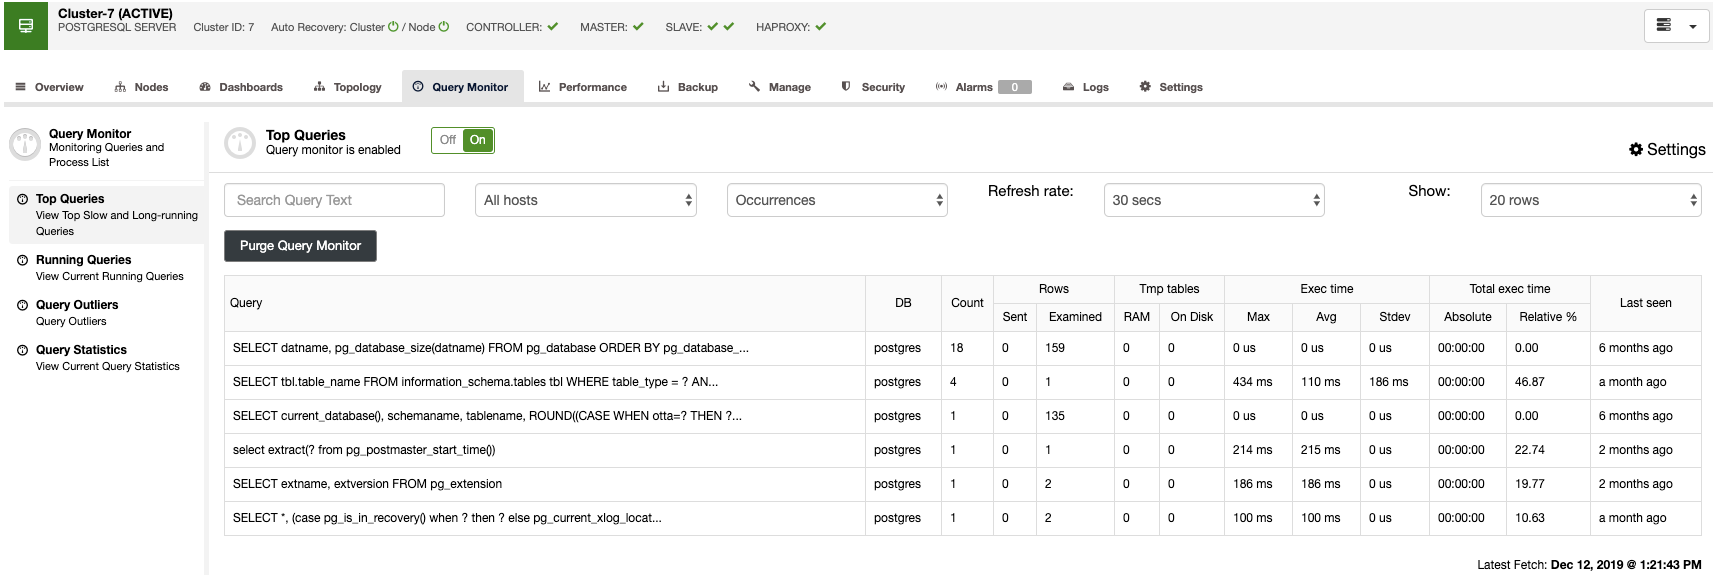
With these features, you can see how your PostgreSQL database is going.
For backup management, ClusterControl centralizes it to protect, secure, and recover your data, and with the verification backup feature, you can confirm if the backup is good to go.
This verification backup job will restore the backup in a separate standalone host, so you can make sure that the backup is working.
Finally, you don’t need to access your database node to check the logs, you can find all your database logs centralized in the ClusterControl Log section.
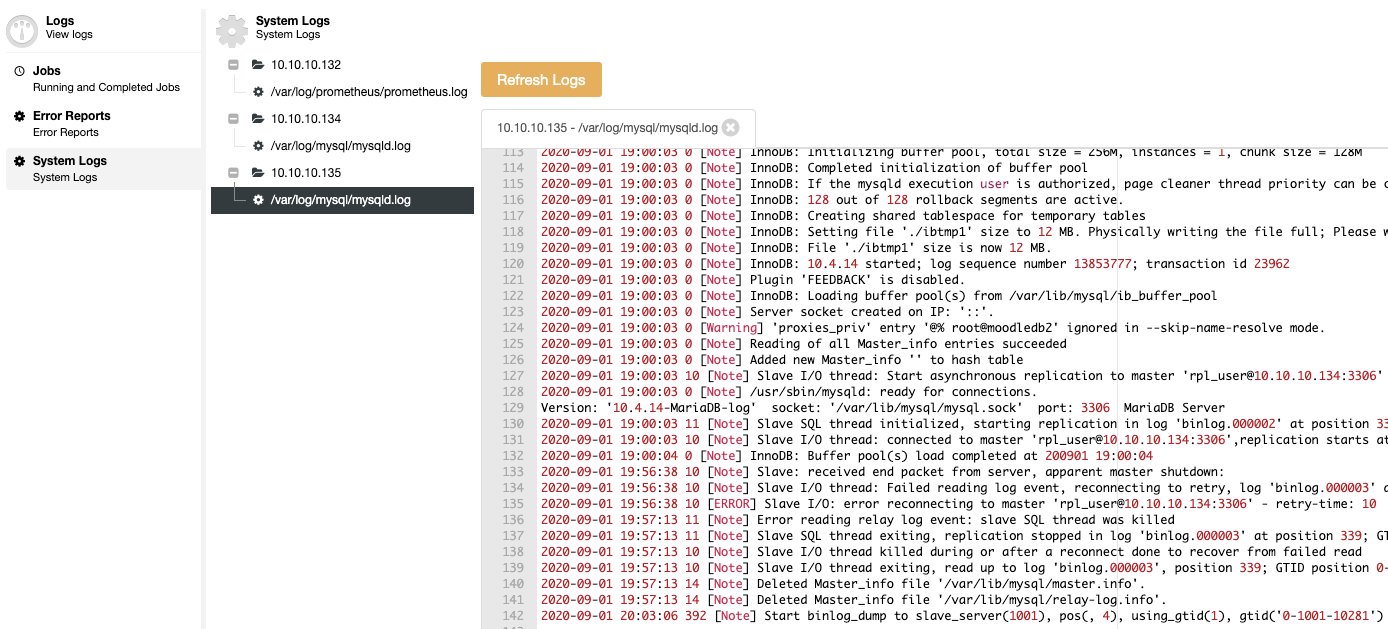
As you can see, you can handle all the mentioned things from the same centralized system: ClusterControl.
Monitoring with the ClusterControl Command Line
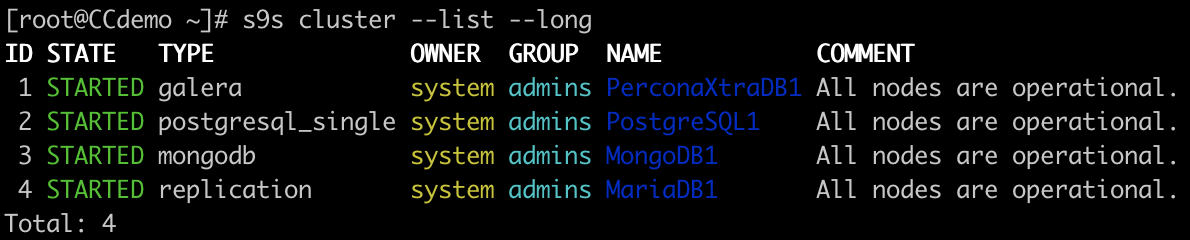
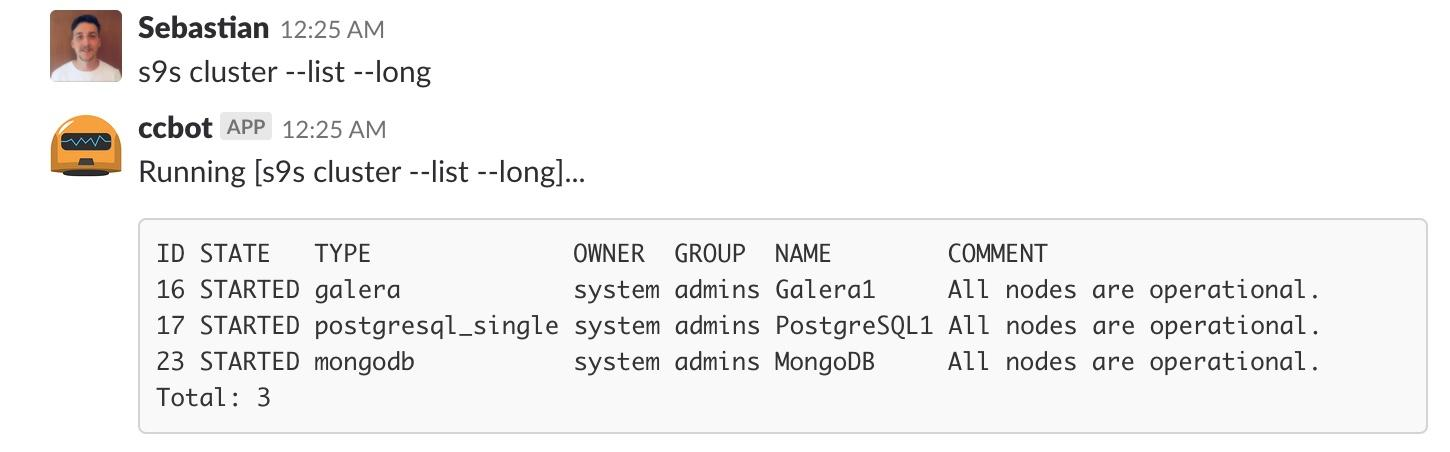
For scripting and automating tasks, or even if you just prefer the command line, ClusterControl has the s9s tool. It is a command-line tool for managing, or monitoring your database cluster.
Cluster List
Node List
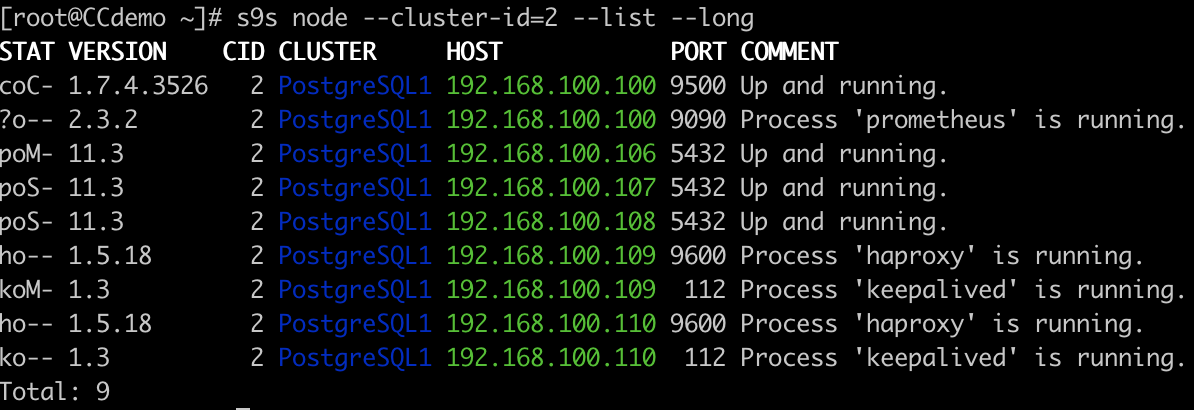
You can perform all the tasks (and even more) available in the ClusterControl UI, and you can integrate this feature with some external tools like slack, to manage it from there.
Conclusion
As you can see, monitoring is absolutely necessary, no matter if it is running on-prem, on the cloud, or even on a mix of them, and the best way on how to do it depends on the infrastructure and the system itself. In this blog, we mentioned some important metrics to monitor in your PostgreSQL environment, how to use ClusterControl to do the job.


