blog
How to Monitor HAProxy Metrics with ClusterControl

Load balancers are an essential component of any highly available database setup. They’re used to increase the capacity and reliability of your critical systems and applications by preventing any one server from becoming overloaded. We talk a lot about them on the Severalnines blog, such as why you need them and how they work. One of the most popular load balancers available for MySQL and MariaDB is HAProxy.
Feature-wise, HAProxy is not comparable to ProxySQL or MaxScale. However, HAProxy is a fast, robust load balancer that will work perfectly fine in any environment as long as the application can perform the read/write split and send SELECT queries to one backend and all writes and SELECT…FOR UPDATE to a separate backend.
Keeping track of all metrics made available by HAProxy is very important; you must be able to know the state of your proxy, especially to know whether you’ve encountered any issues.
ClusterControl has always made available an HAProxy status page showing the state of the proxy in real-time. Now, with the new Prometheus-based SCUMM (Severalnines ClusterControl Unified Monitoring & Management) dashboards, it’s possible to easily track how those metrics change over time.
This blog post will explore the different metrics presented in the HAProxy SCUMM dashboard.
Exploring the HAProxy Dashboard in ClusterControl
All Prometheus and SCUMM dashboards are disabled by default in ClusterControl. However, to deploy them for any given cluster is just a matter of one click. If you monitor multiple clusters with ClusterControl, you can reuse the same Prometheus instance for each cluster.
Once deployed, you can then access the HAProxy dashboard. Let’s take a look at the data available in the dashboard:
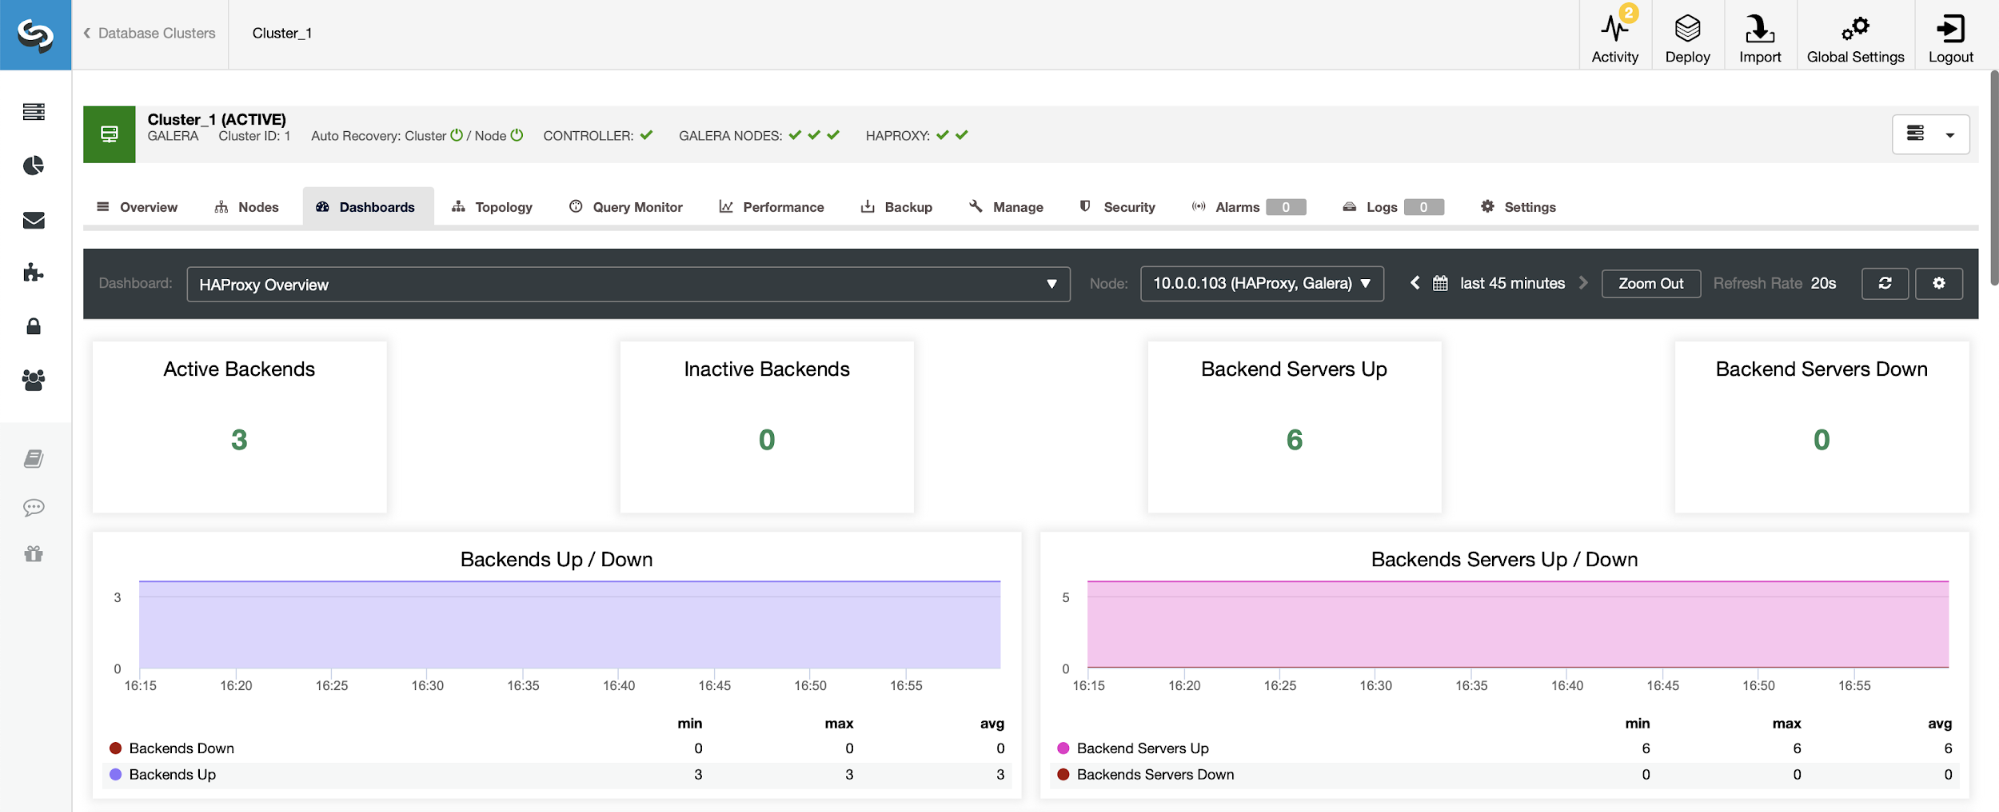
The first thing you’ll see when you navigate to the HAProxy dashboard is information about the state of your backends. Here, please note that what you see may depend on the cluster type and how you’ve deployed HAProxy. In this case, we deployed a Galera cluster, and HAProxy was deployed in a round-robin fashion. Therefore, you see three backends for reads and three for writes — six total. This is also why you see all backends marked as “Up.”
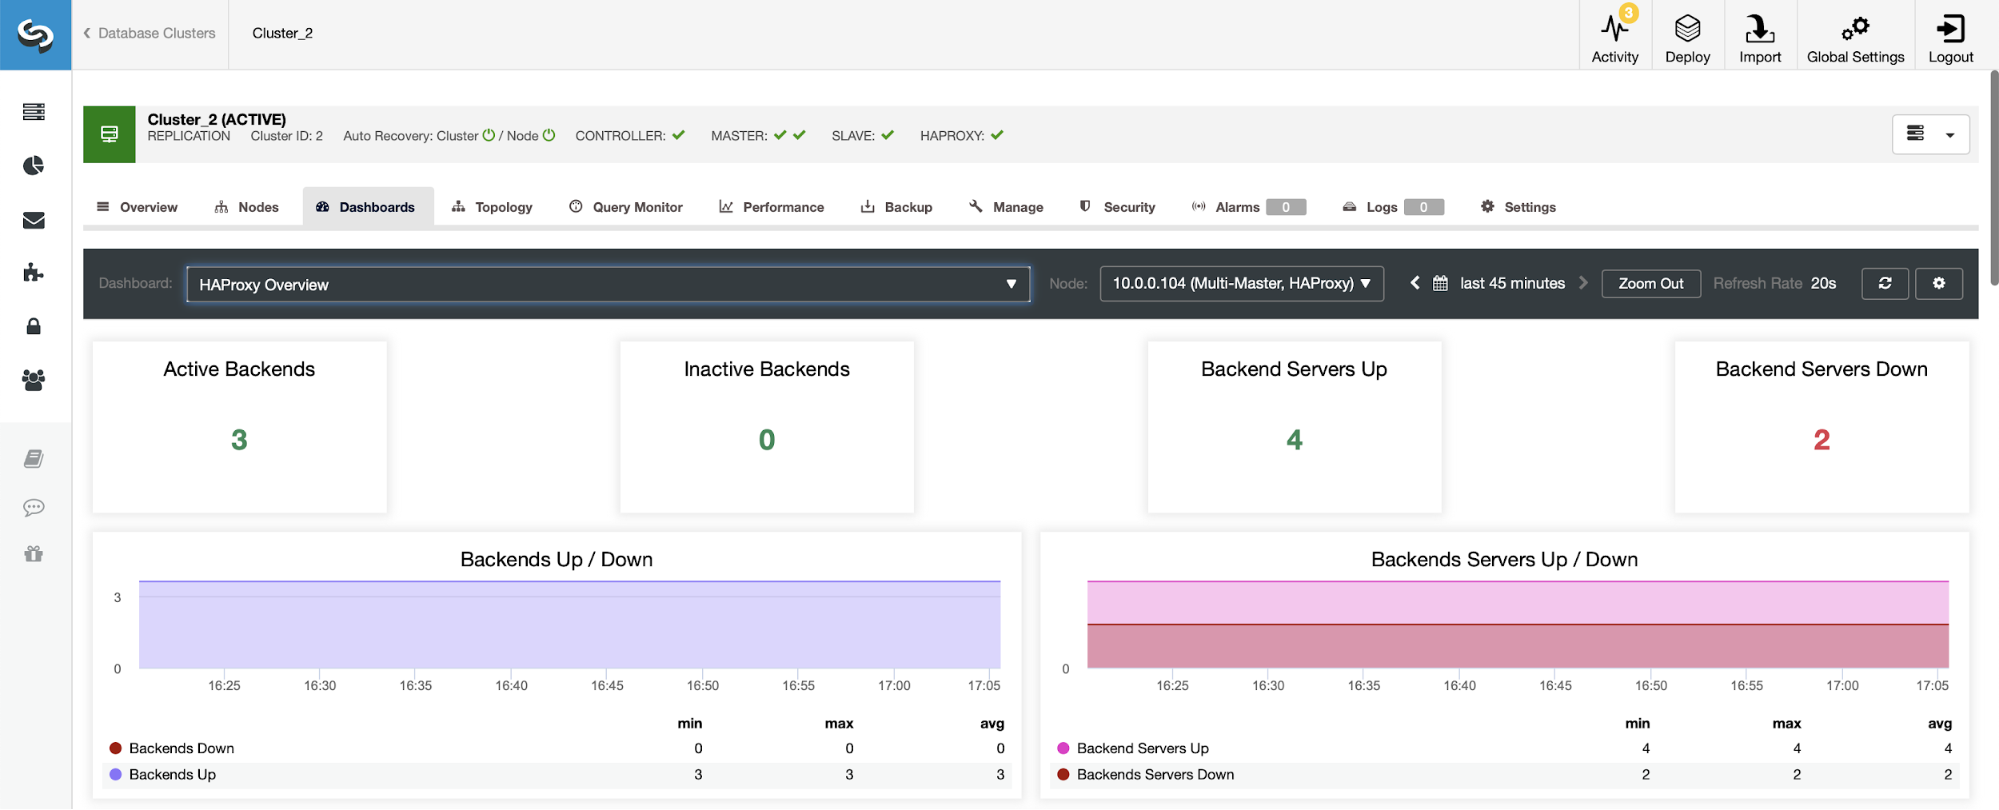
In a scenario with a replication cluster, things will look different as the HAProxy will be deployed in a read/write split, and the scripts will keep only one host (master) up and running in the writer’s backend.
Notice, this is why below you see two backend servers marked as “Down”:
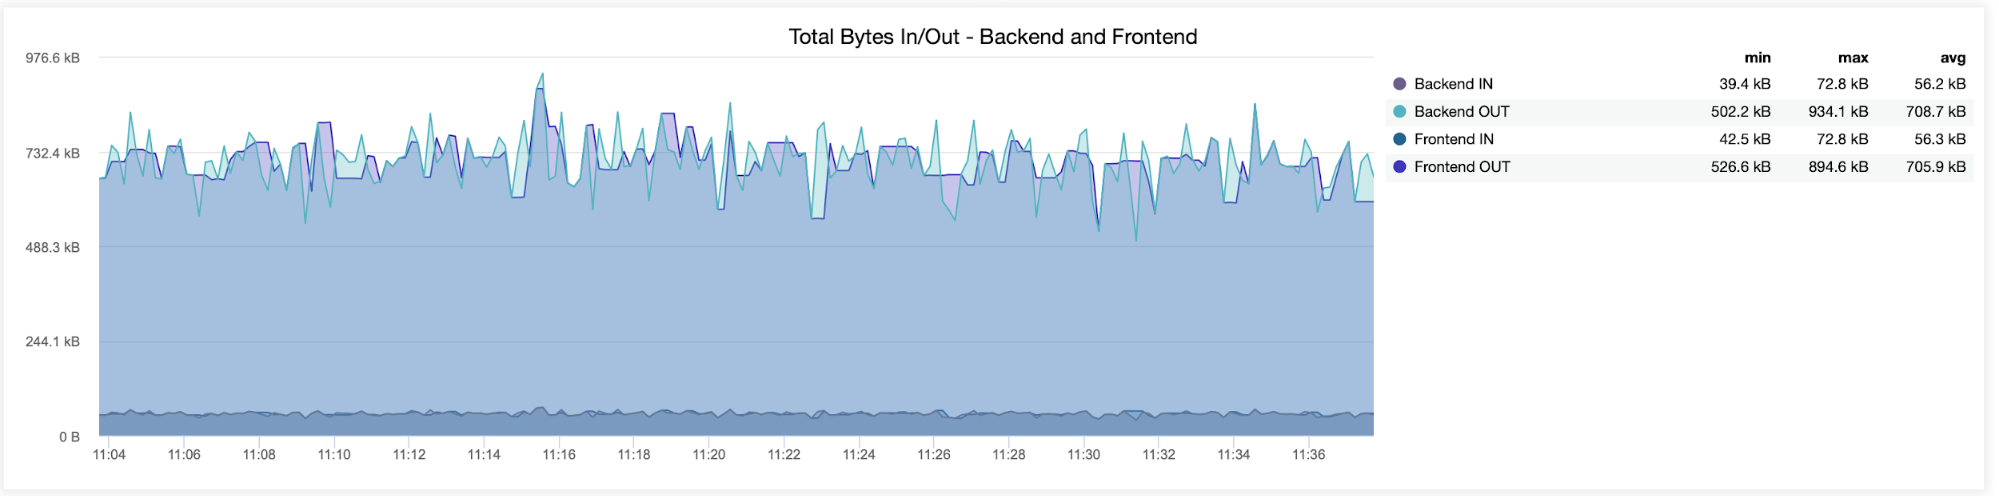
In the following graph, you will see the data sent and received by both backend (from HAProxy to the database servers) and frontend (between HAProxy and client hosts):
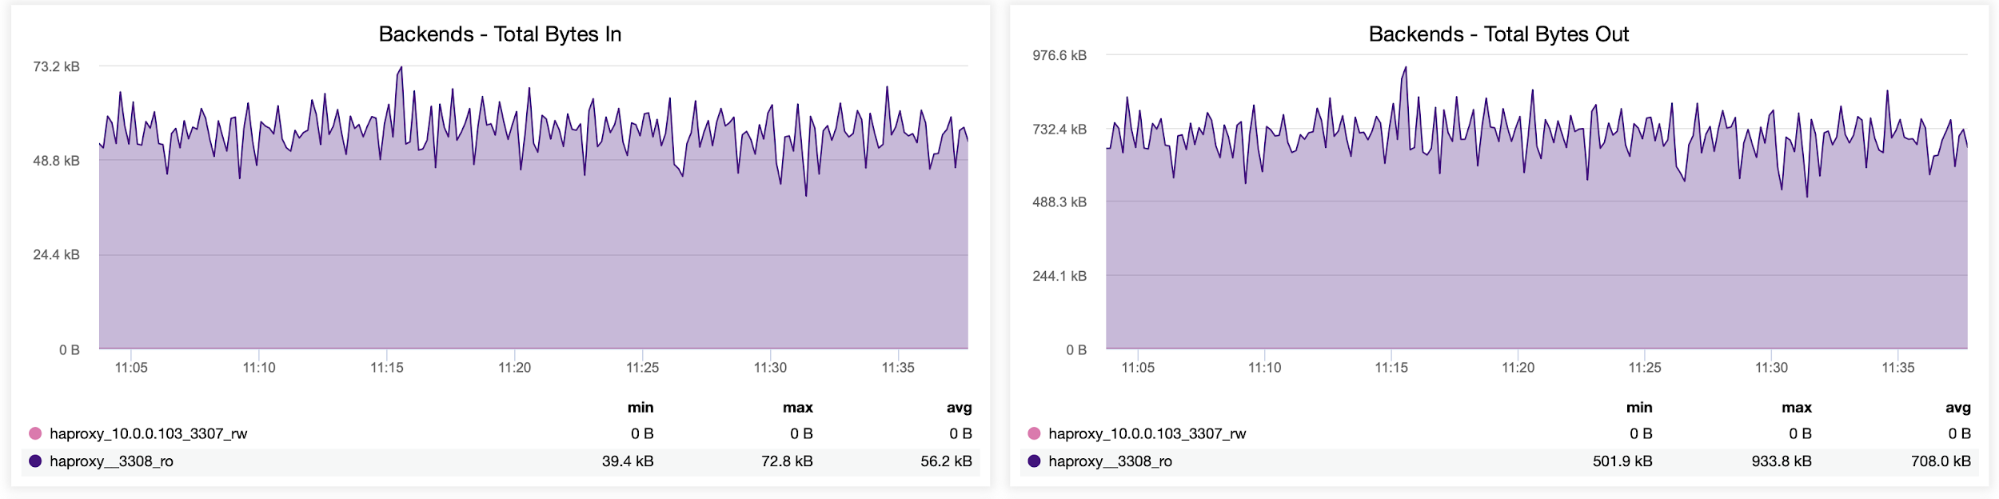
You can also check the traffic distribution between backends in your HAProxy configuration. In this case, we have two backends, and the queries are sent via port 3308, which acts as the round-robin access point to our Galera cluster:
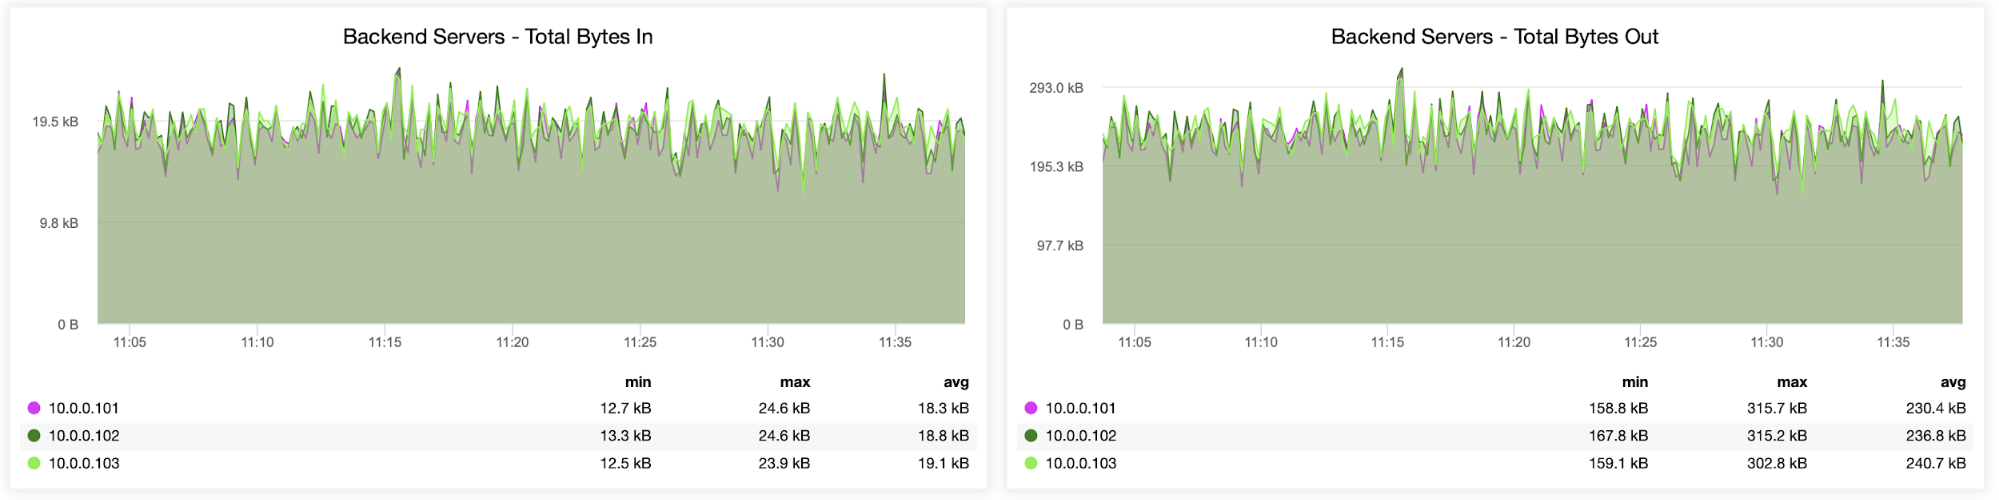
Next, you can see how the traffic was distributed across all backend servers. In this scenario — due to the round-robin access pattern — data was more or less evenly distributed across all three backend Galera servers:
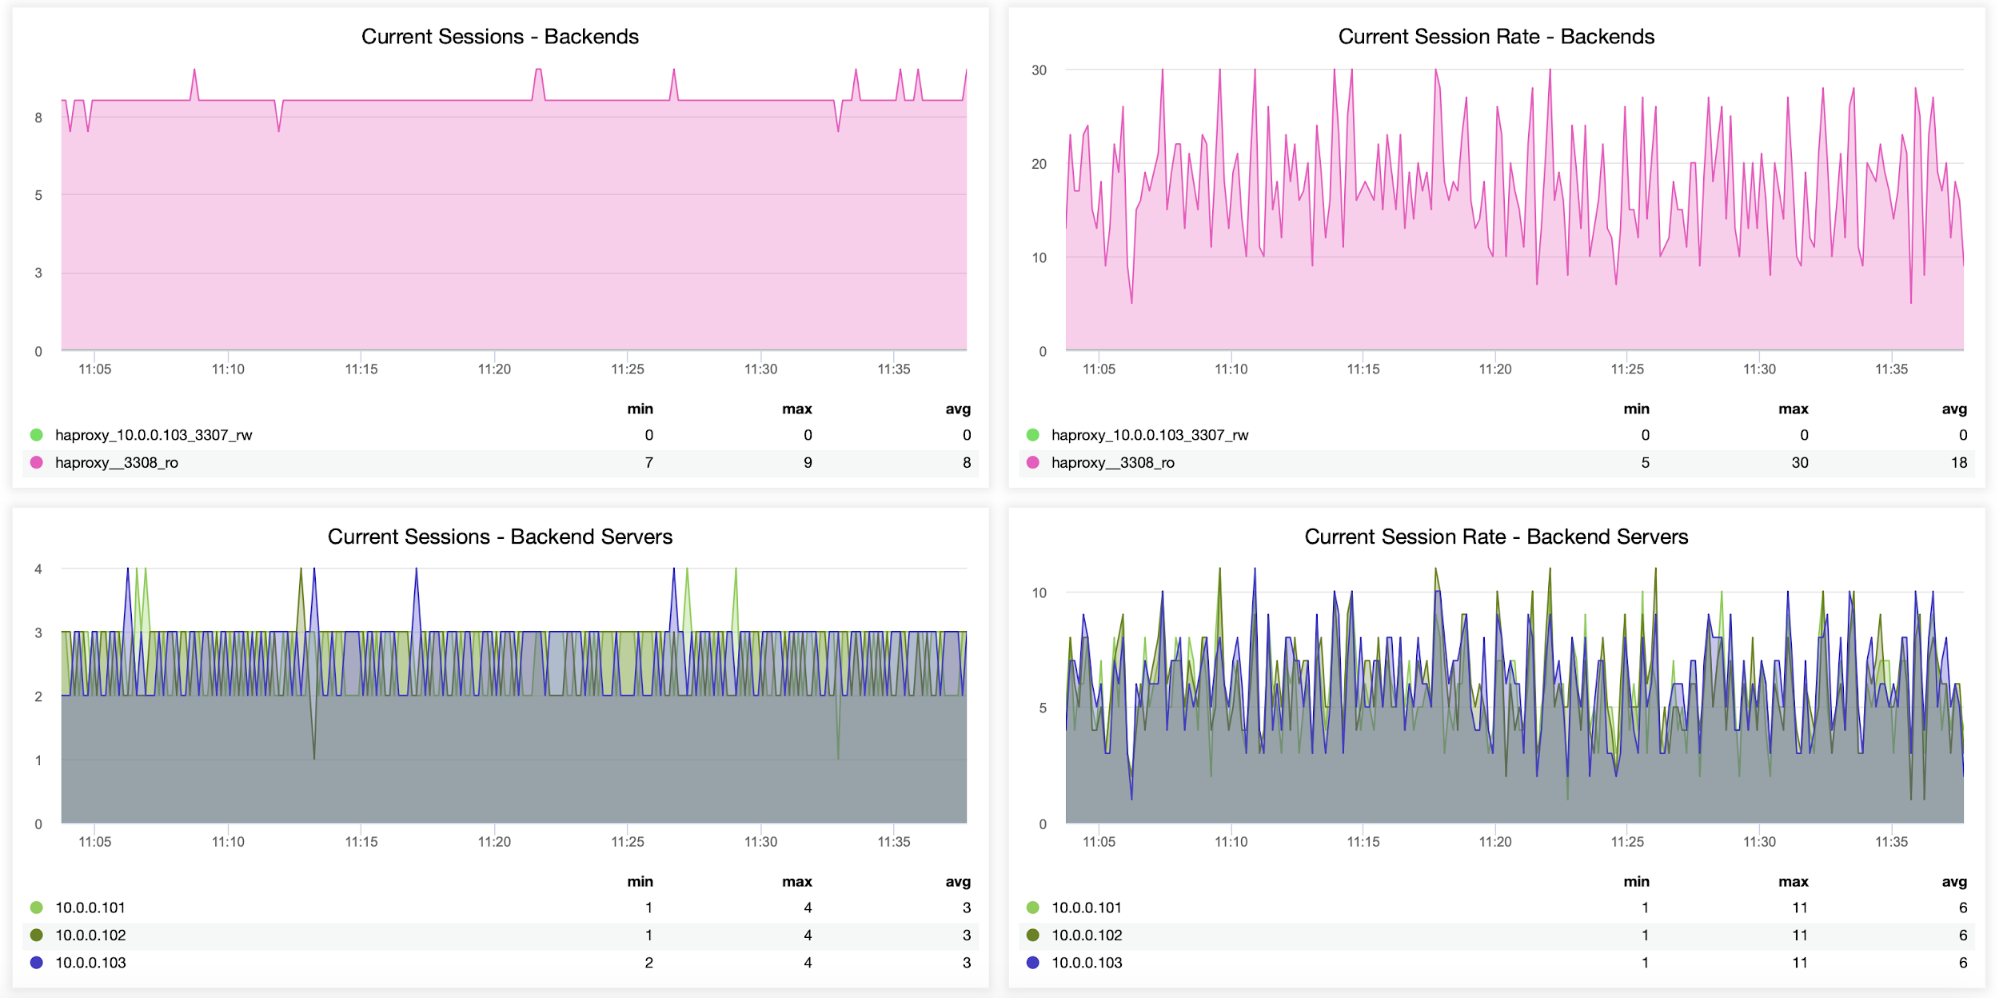
Information about sessions, including how many sessions were opened from HAProxy to the backend servers, can also be monitored, as seen in the following graph. You can also track how many times per second a new session was opened to the backend and how those metrics look on a per backend server basis.
The following two graphs show the maximum number of sessions per backend server and when connectivity issues appeared. This can be quite useful for debugging purposes where you hit a configuration error on your HAProxy instance, and connections start to drop.
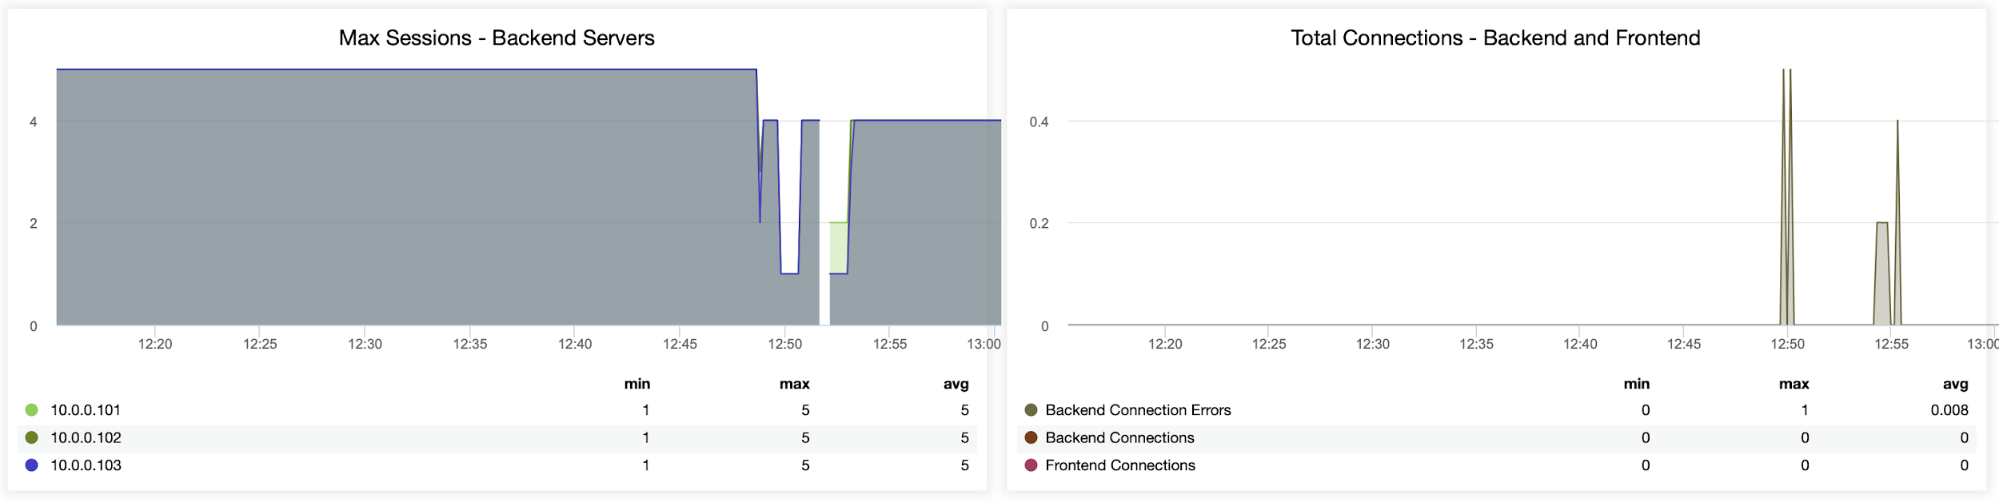
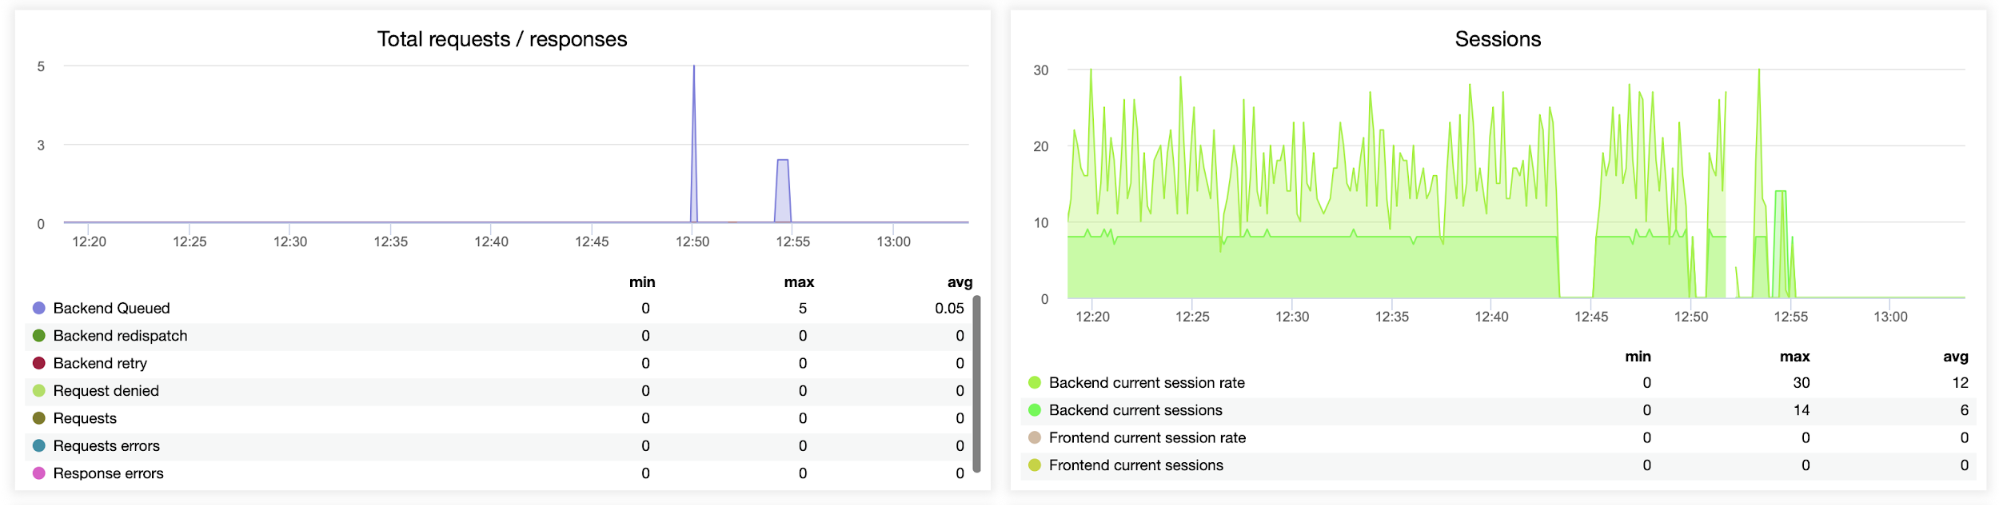
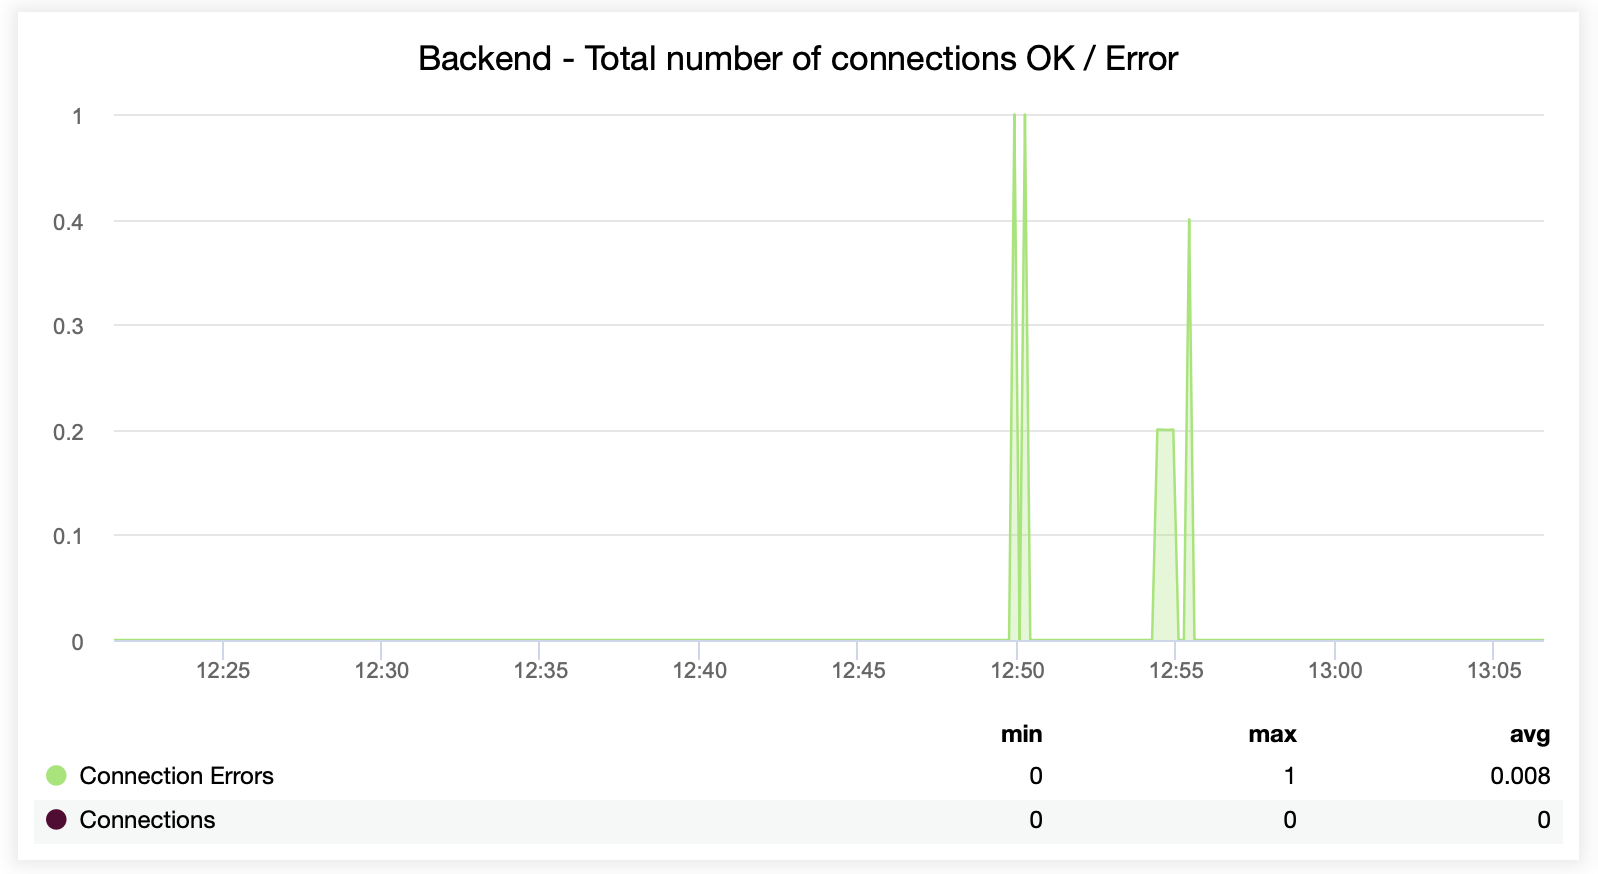
This next graph is potentially more valuable as it shows various metrics related to error handling, such as errors, request errors, retries on the backend side, etc. There is also a “Sessions” graph showing an overview of the session metrics.
Here you can see that ClusterControl tracks the connection errors in real-time, which can help pinpoint the precise time when the issues started to evolve.
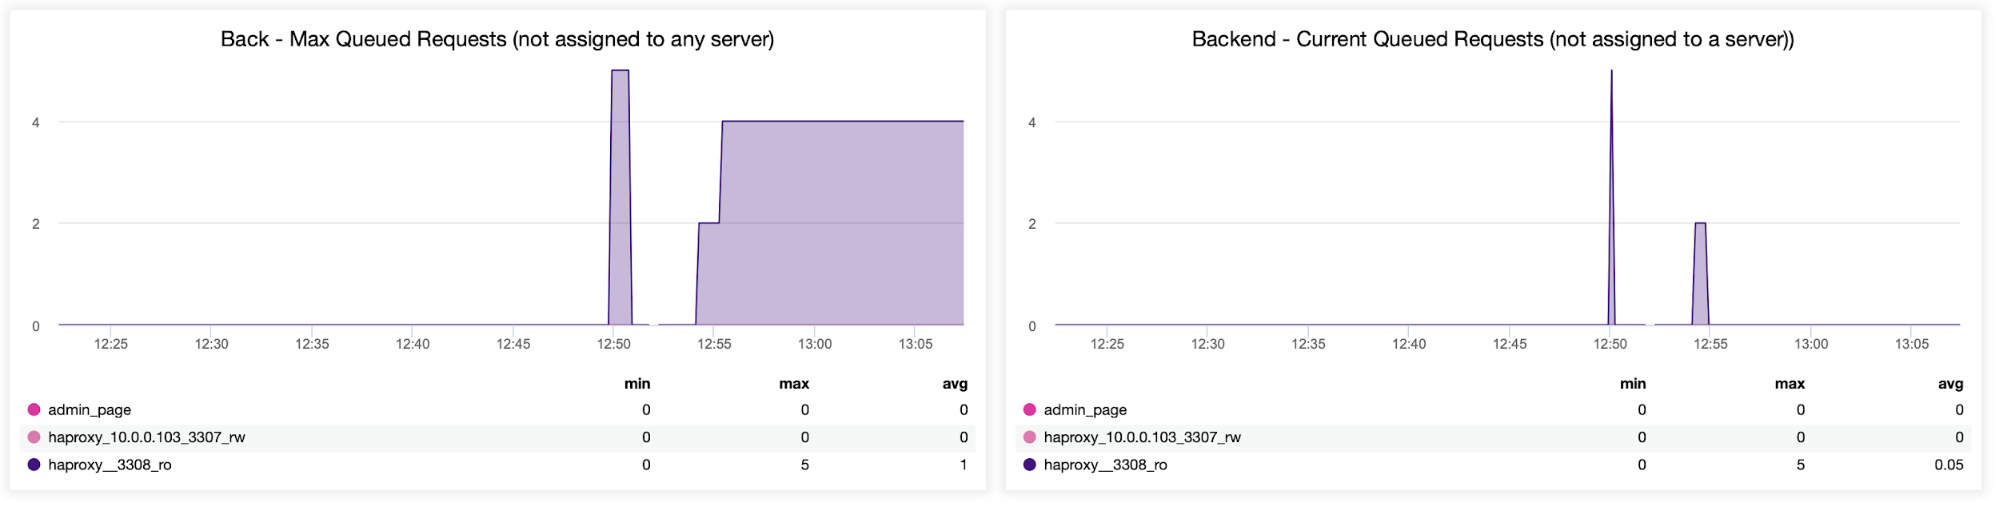
Lastly, we’ll look at the following two graphs related to queued requests. HAProxy queues requests to the backend if the backend servers are oversaturated. This can point to, for example, the overloaded database servers, which cannot handle any more traffic.
Wrapping Up
Deploying and monitoring your HAProxy load balancer in ClusterControl can help make easy work of managing and monitoring your connections. Having clear visibility into the performance of your backends, traffic distribution, session metrics, connection errors, and the number of queued requests can help ensure the availability and scalability of any database setup.
ClusterControl makes setting up and monitoring load balancers a breeze for any database configuration. Not yet using ClusterControl? If you’d like to see for yourself just how easy it is to deploy and monitor your HAProxy load balancer with ClusterControl, we’re inviting you to a free 30-day trial of the platform, no strings attached. For a more detailed walkthrough of why and how to use HAProxy for load balancing, check out our tutorial on MySQL Load Balancing with HAProxy.


