blog
Manage Engine HAProxy Monitoring Alternatives – ClusterControl HAProxy Monitoring

In a previous blog, we looked at the differences between ManageEngine Applications Manager and ClusterControl, examining the main features of each and comparing them. In this blog we will focus on the monitoring of HAProxy, how to monitor an HAProxynode and compare the specific monitoring features of these two tools.
For this blog, we’ll assume you already have Applications Manager or ClusterControl installed.
HAProxy Monitoring Usage Comparison
Manage Engine Applications Manager
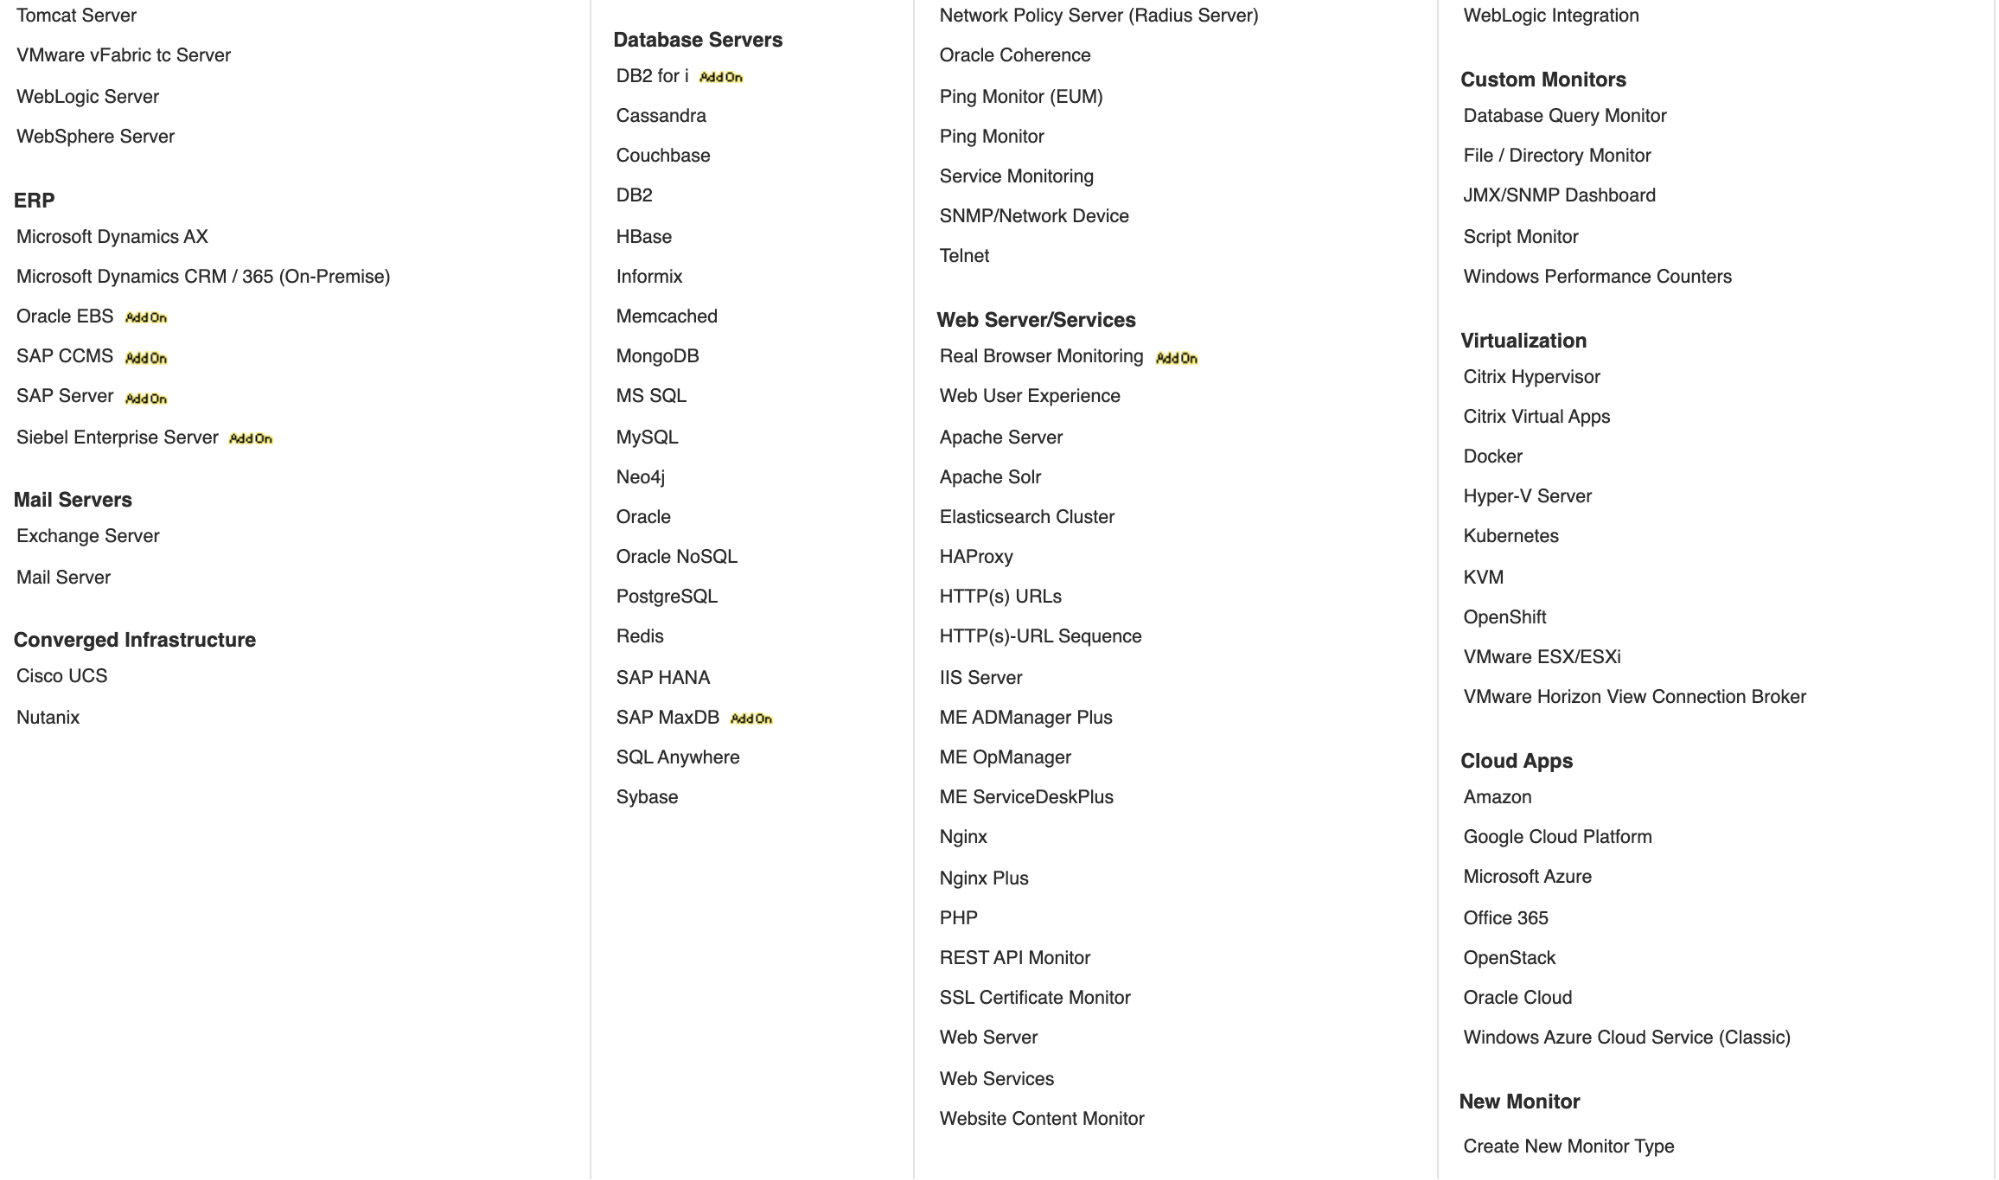
To start monitoring your HAProxy node, it must be installed previously, as you only can import it here. In your Applications Manager server, go to New Monitor -> Add New Monitor. You’ll see all the available options to monitor, so you need to choose the HAProxy option under the Web Server/Services section.
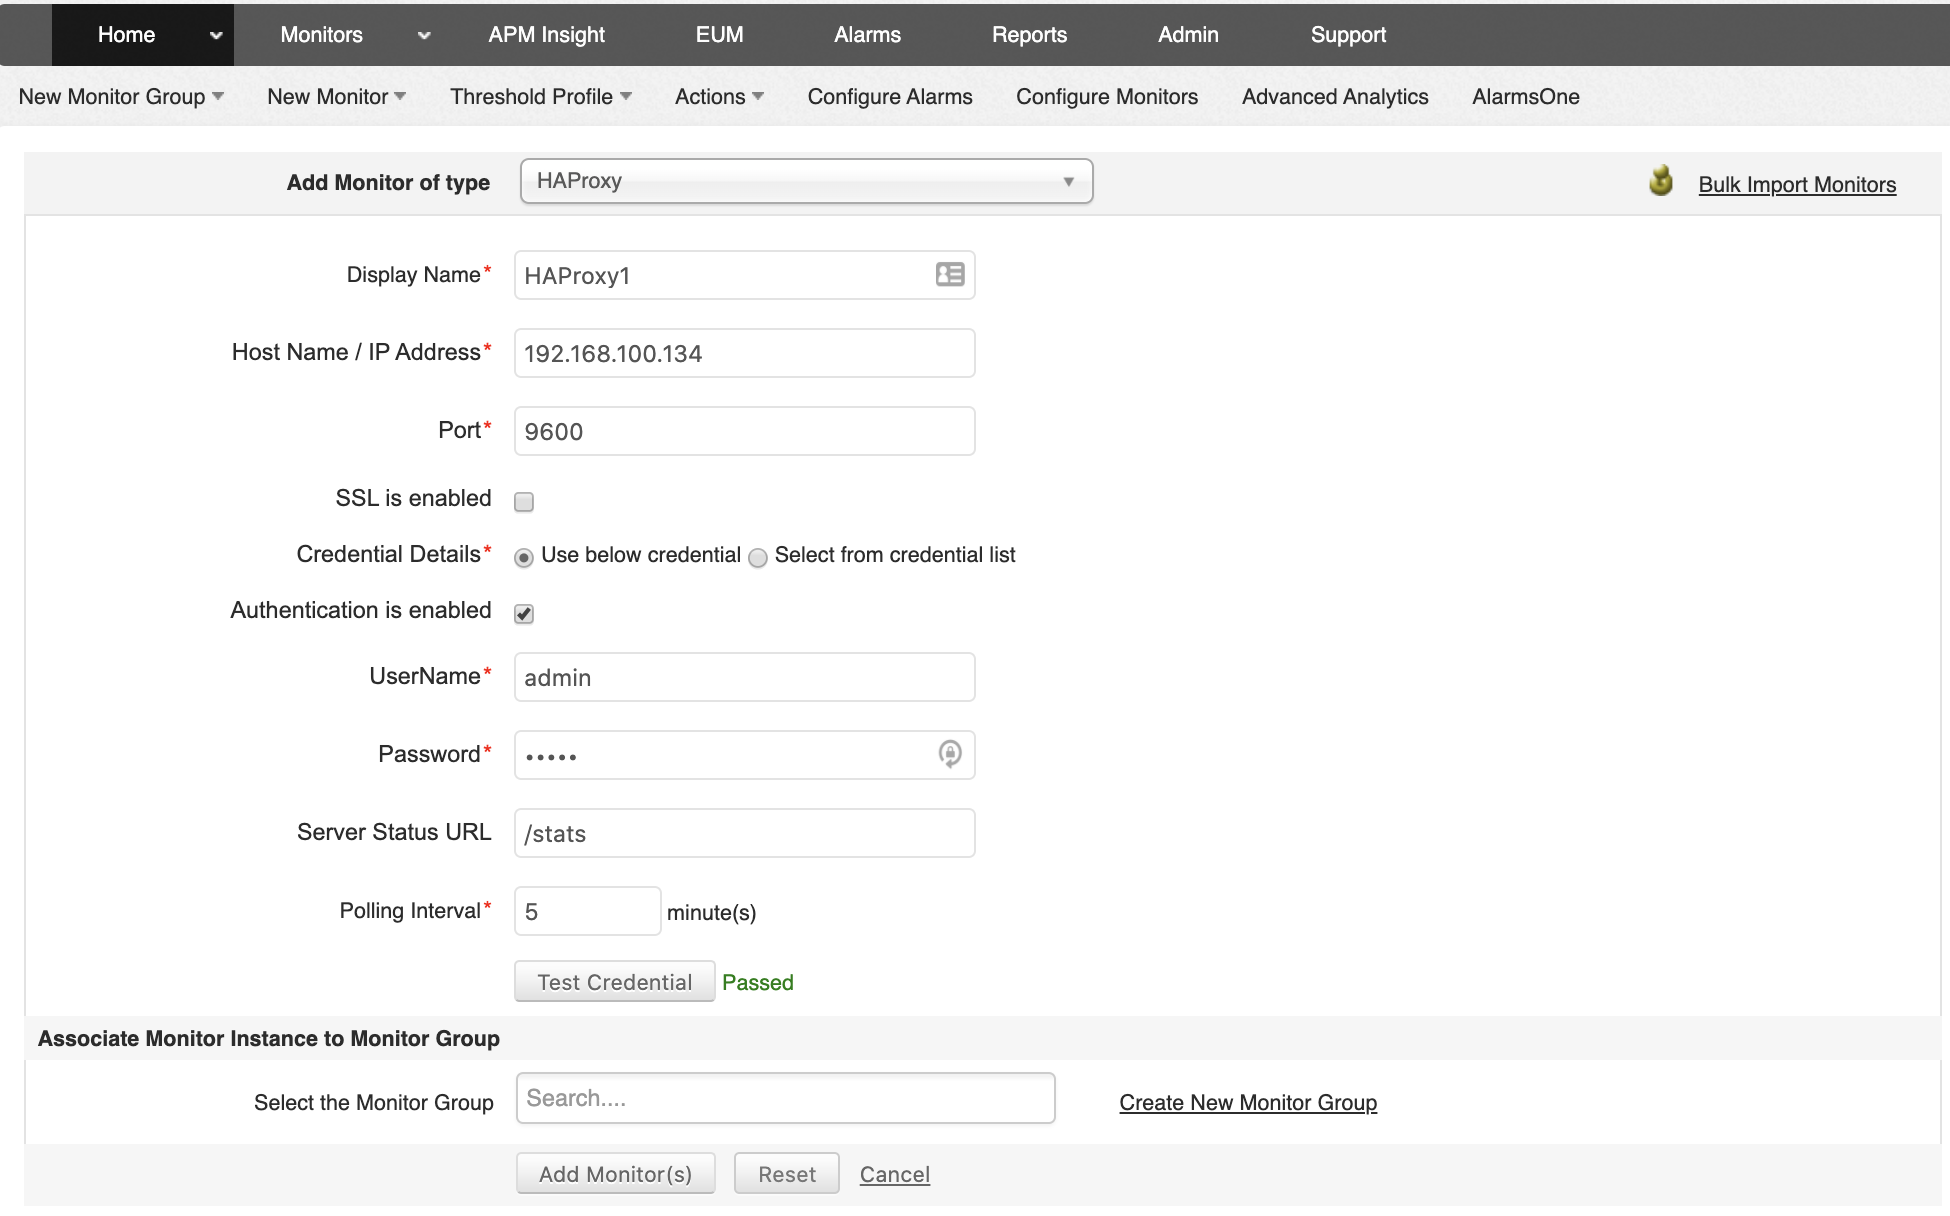
Now you must specify the following information of your HAProxy node:
- Display Name: It’ll be used to identify the node.
- Hostname/IP Address: Of the existing HAProxy node.
- Admin Port: It’s specified in the HAProxy configuration file.
- Credentials: Admin credentials if needed.
- Stats URL: URL to access the HAProxy stats.
Before pressing “Add Monitor”, you can test the credentials to confirm that it’s working correctly.
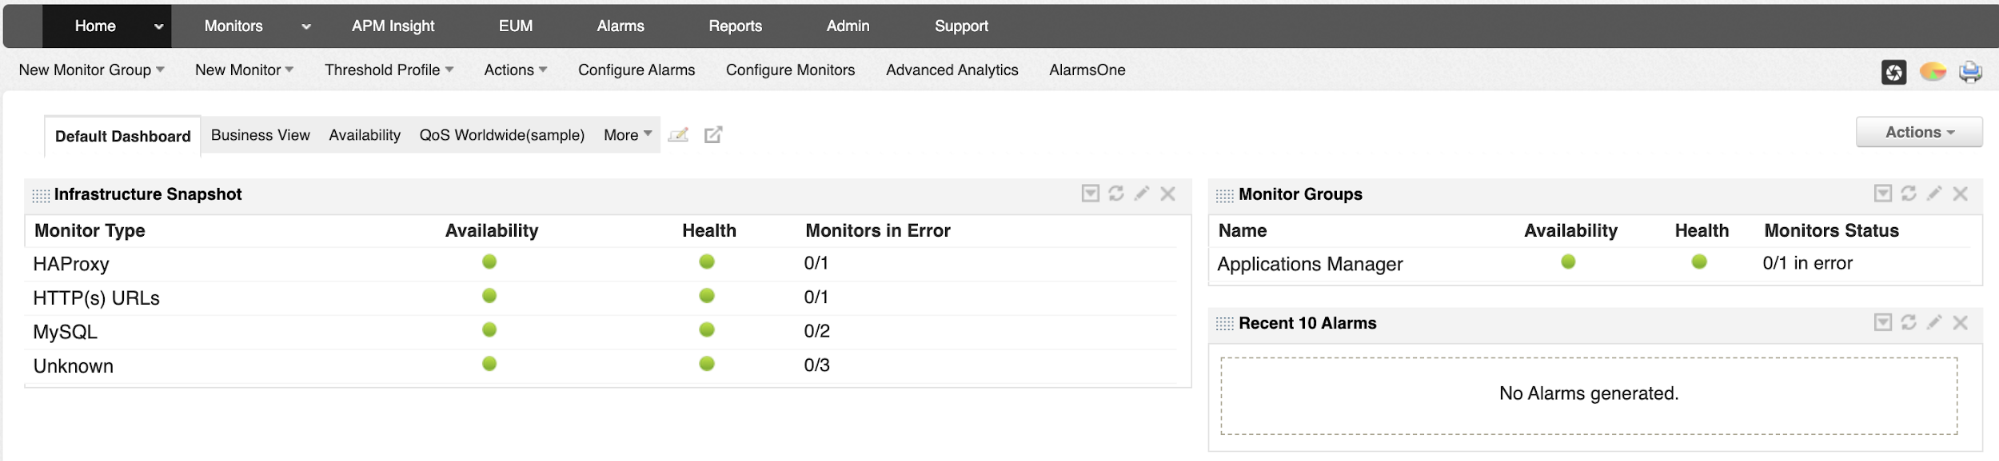
After you have your HAProxy monitored by Application Manager, you can access it from the Home section.
ClusterControl
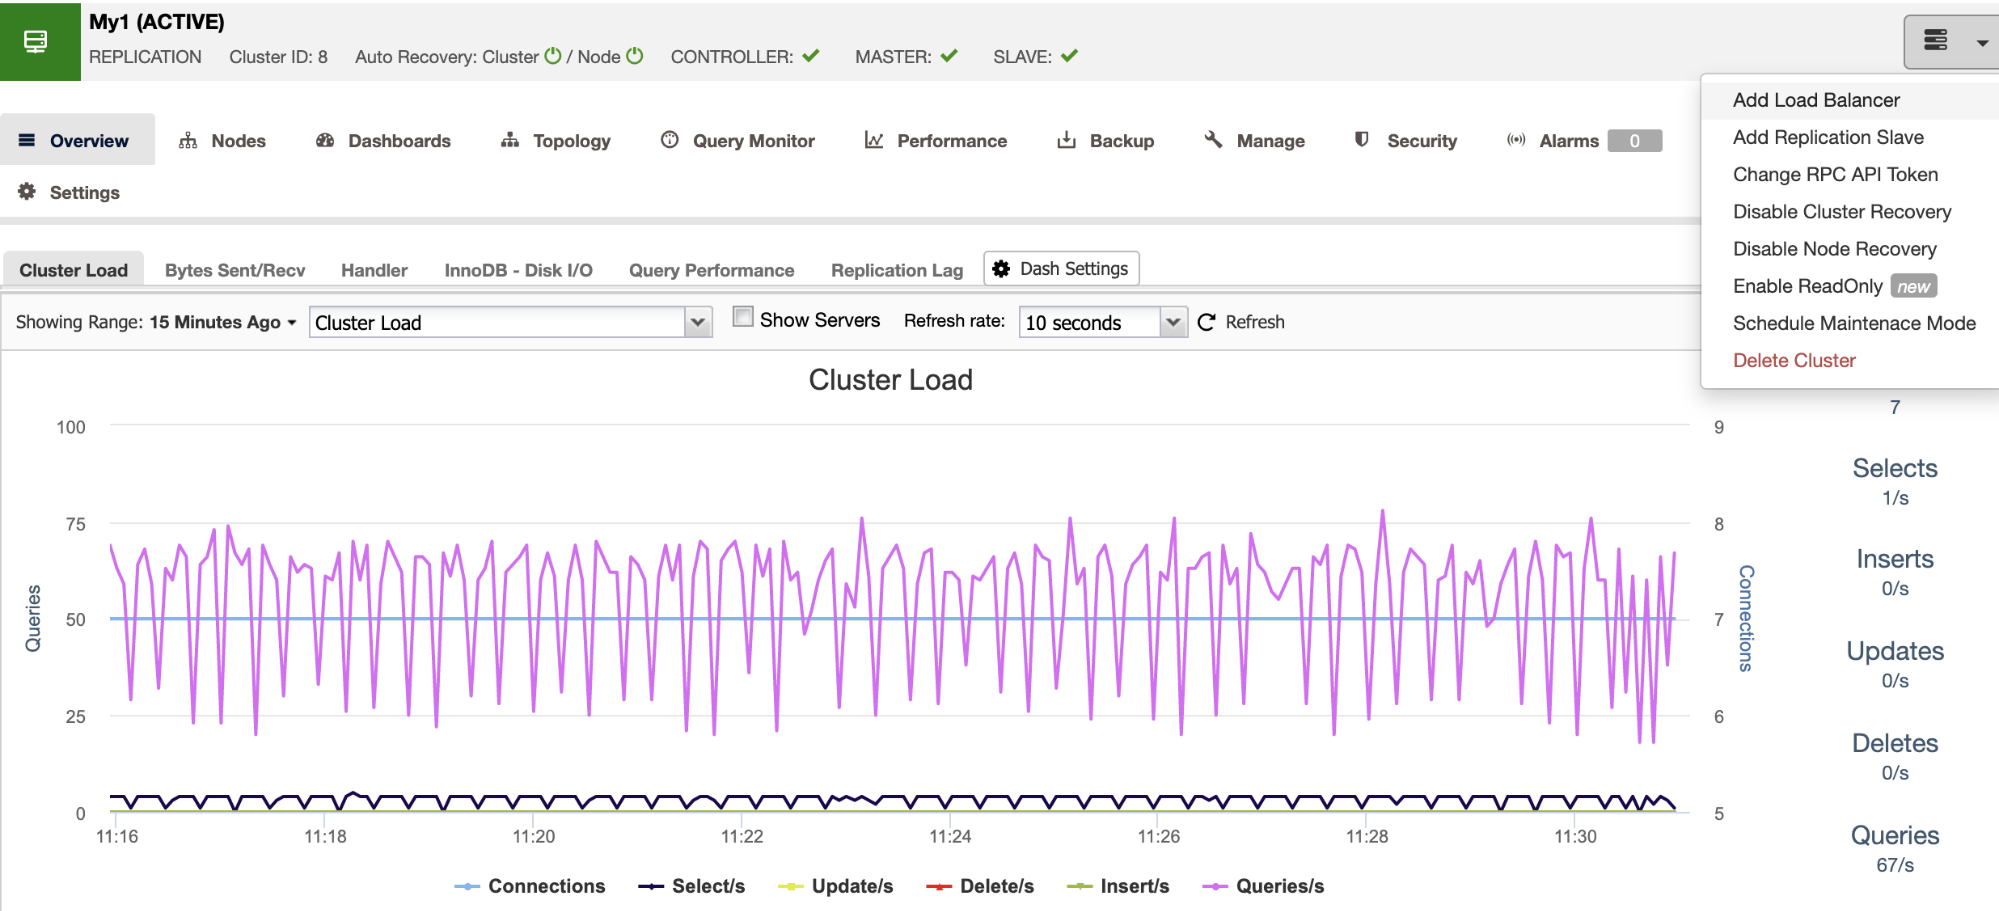
In this case, it’s not necessary to have the HAProxy node installed, as you can deploy it using ClusterControl. We’ll assume you have a Database Cluster added into ClusterControl, so if you go to the cluster actions, you’ll see the Add Load Balancer option.
In this step, you can choose if you want to Deploy or Import it.
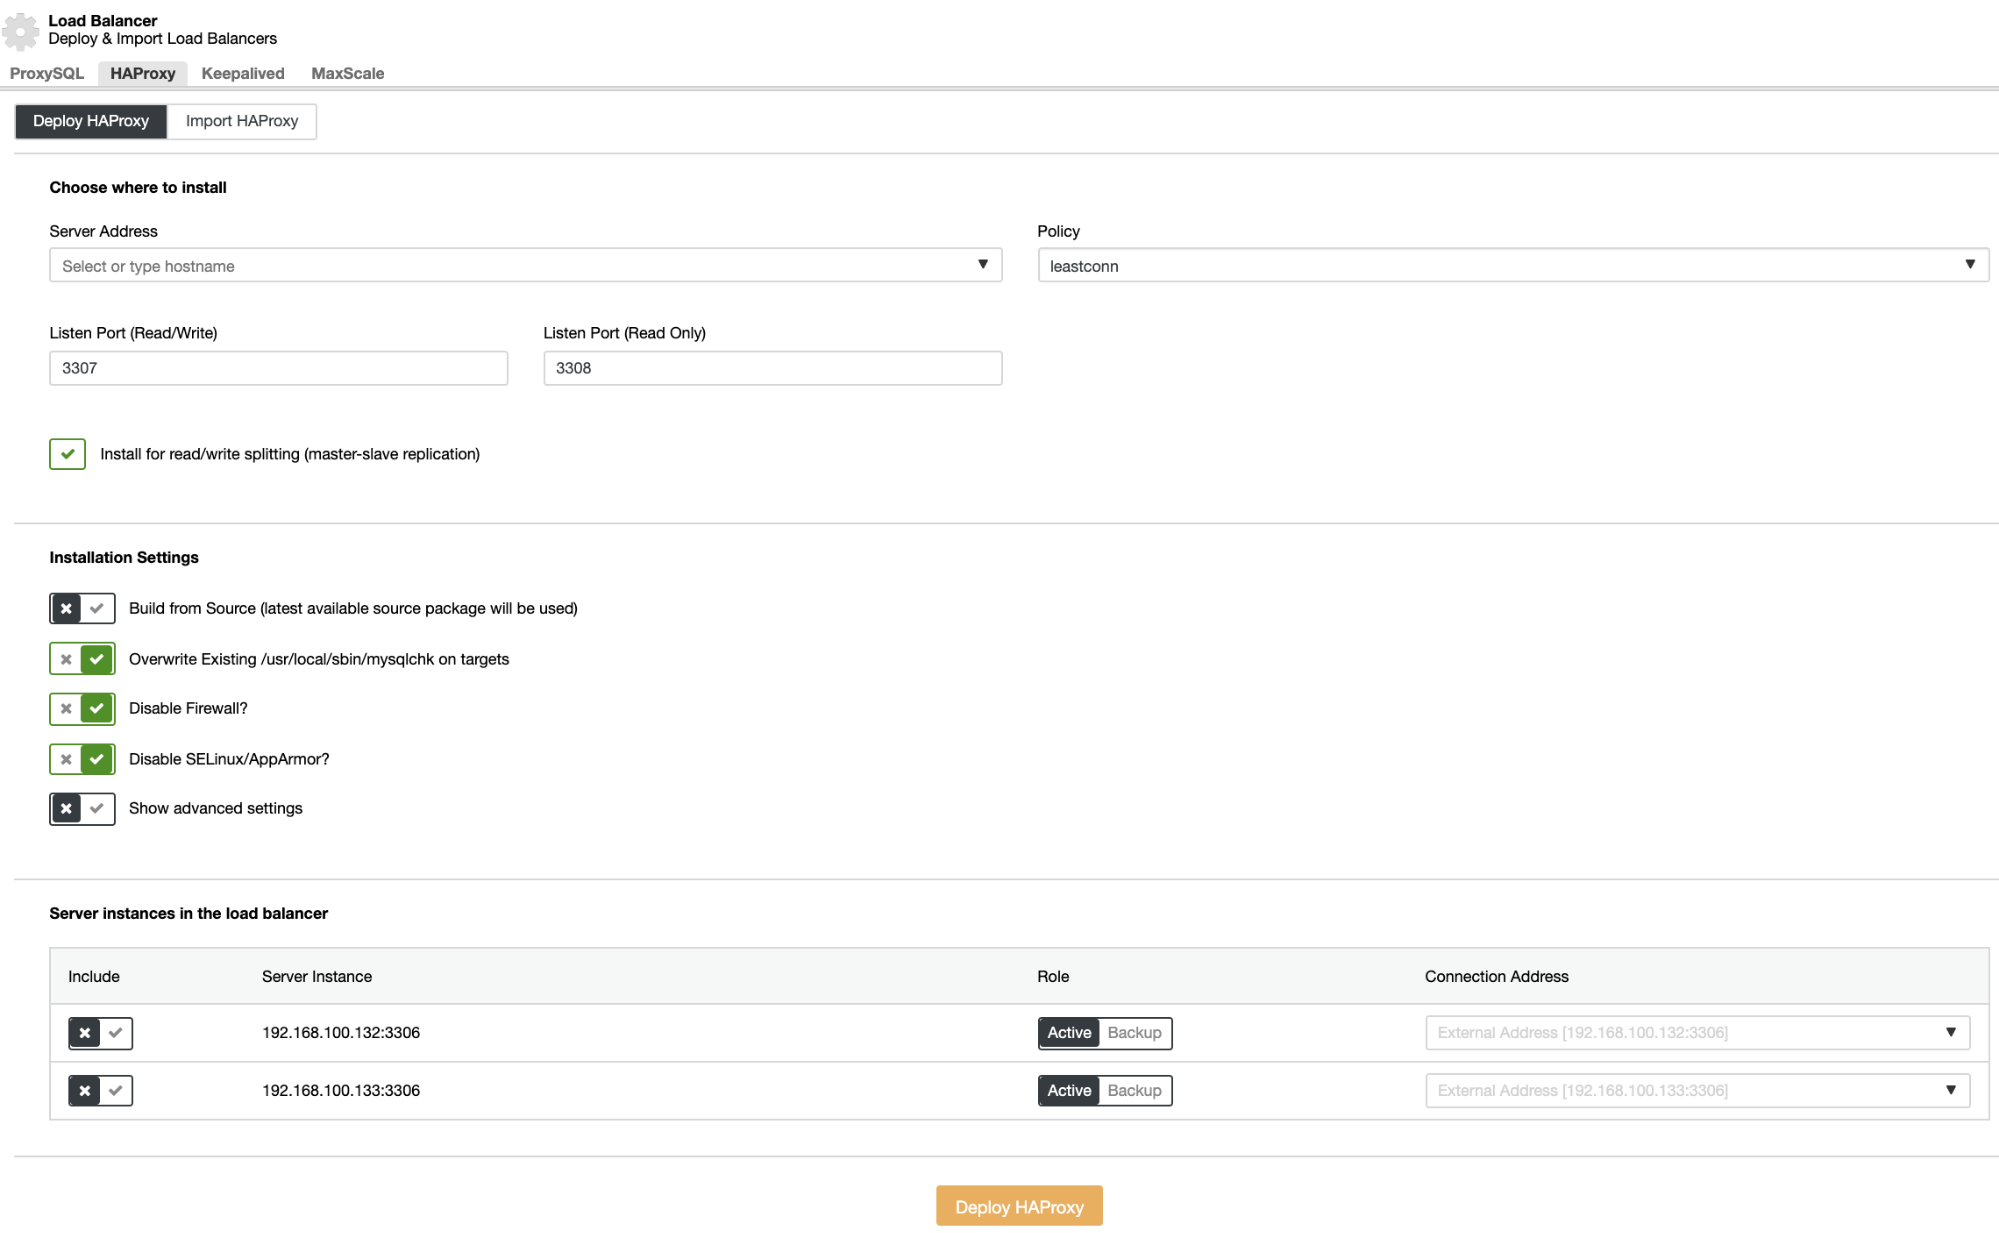
For the deployment, you must specify the following information:
- Server Address: IP Address for your HAProxy server.
- Listen Port (Read/Write): Port for read/write traffic.
- Listen Port (Read-Only): Port for read-only traffic.
- Policy: It can be:
- leastconn: The server with the lowest number of connections receives the connection
- roundrobin: Each server is used in turns, according to their weights
- source: The source IP address is hashed and divided by the total weight of the running servers to designate which server will receive the request
- Build from Source: You can choose Install from a package manager or build from source.
- And you need to select which servers you want to add to the HAProxy configuration and some additional information like:
- Role: It can be Active or Backup.
- Include: Yes or No.
- Connection address information.
Also, you can configure Advanced Settings like Admin User, Backend Name, Timeouts, and more.
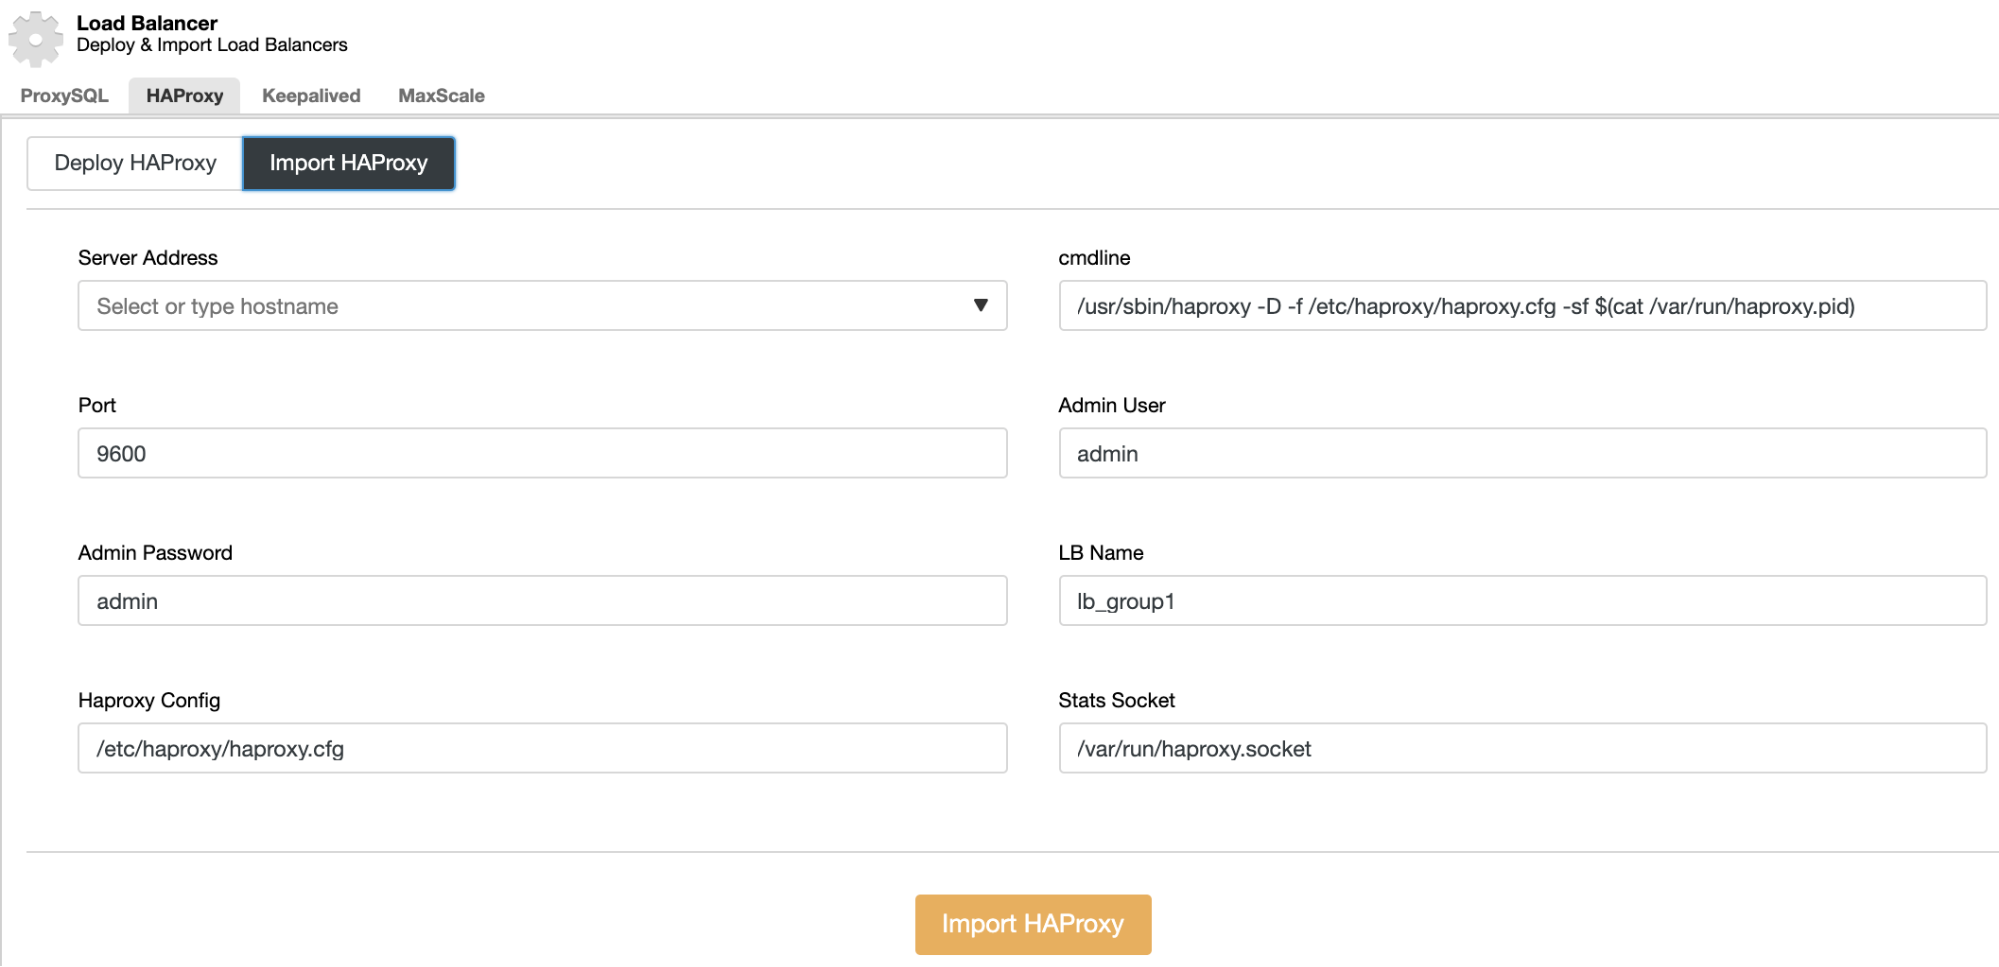
For the import action, you must specify the current HAProxy information, like:
- Server Address: IP Address for your HAProxy server.
- Port: HAProxy admin port.
- Admin User/Admin Password: HAProxy admin credentials.
- HAProxy Config: HAProxy configuration file location.
- Stats Socket: HAProxy stats socket.
Most of these values are auto-filled with the default values, so if you’re using a default HAProxy configuration, you shouldn’t change anything.
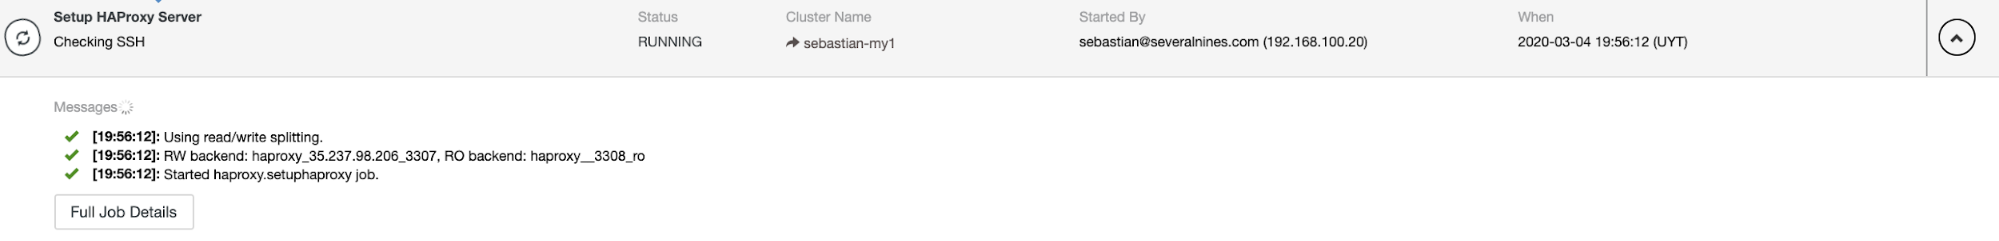
When you finish the configuration and confirm the deploy or import process, you can follow the progress in the Activity section on the ClusterControl UI.
Monitoring Your HAProxy Node
HAProxy Monitoring with Manage Engine Applications Manager
If you go into the HAProxy node, you’ll see an Availability History section.
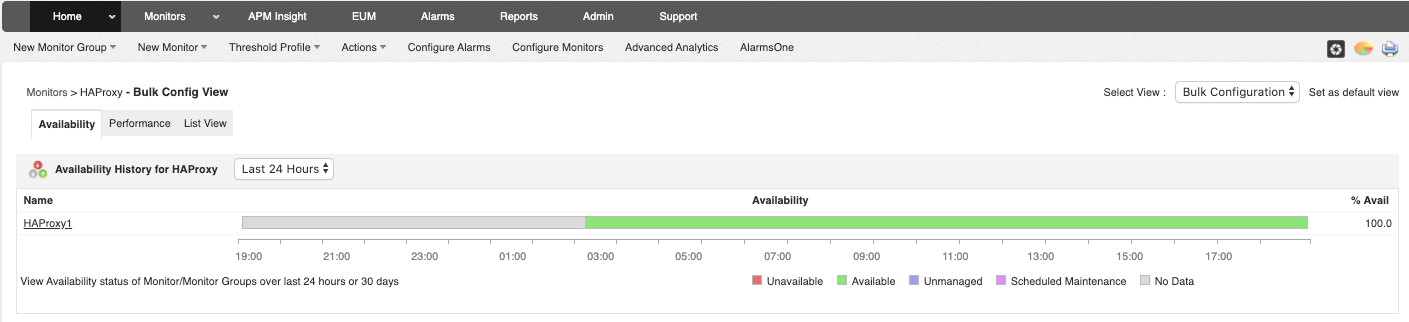
In the Performance tab, you’ll have useful information about the HAProxy performance per hour plus a graph showing the Response Time.
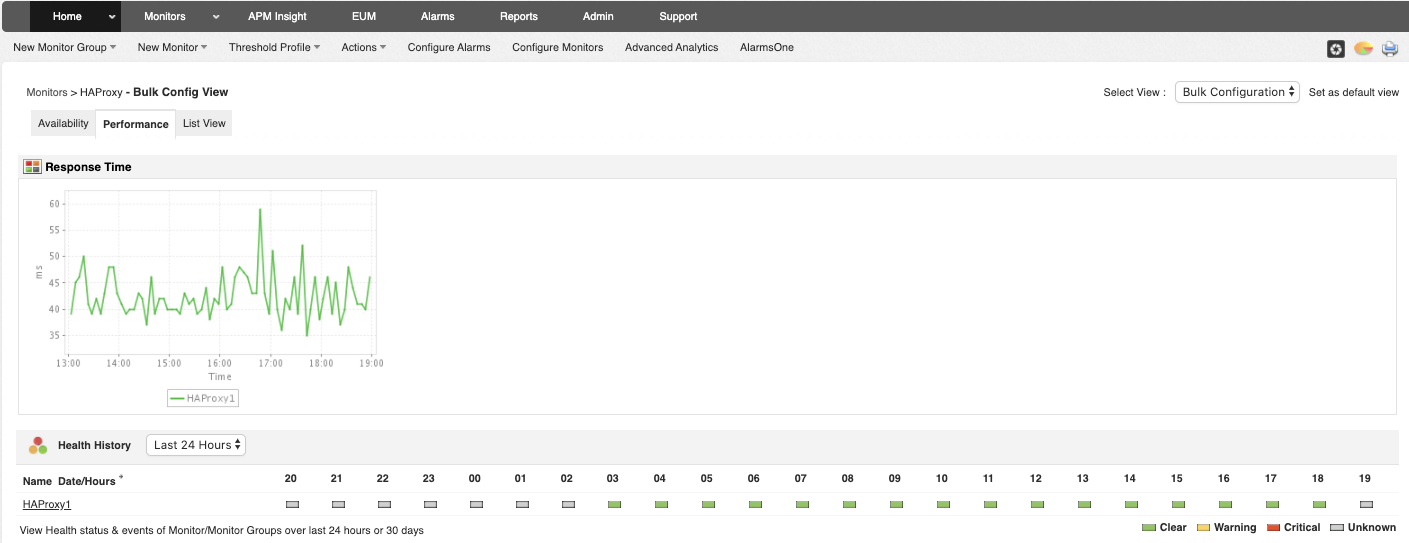
If you press on the HAProxy link under the Healthy History section, you’ll access more detailed information about it, with different metrics and graphs.
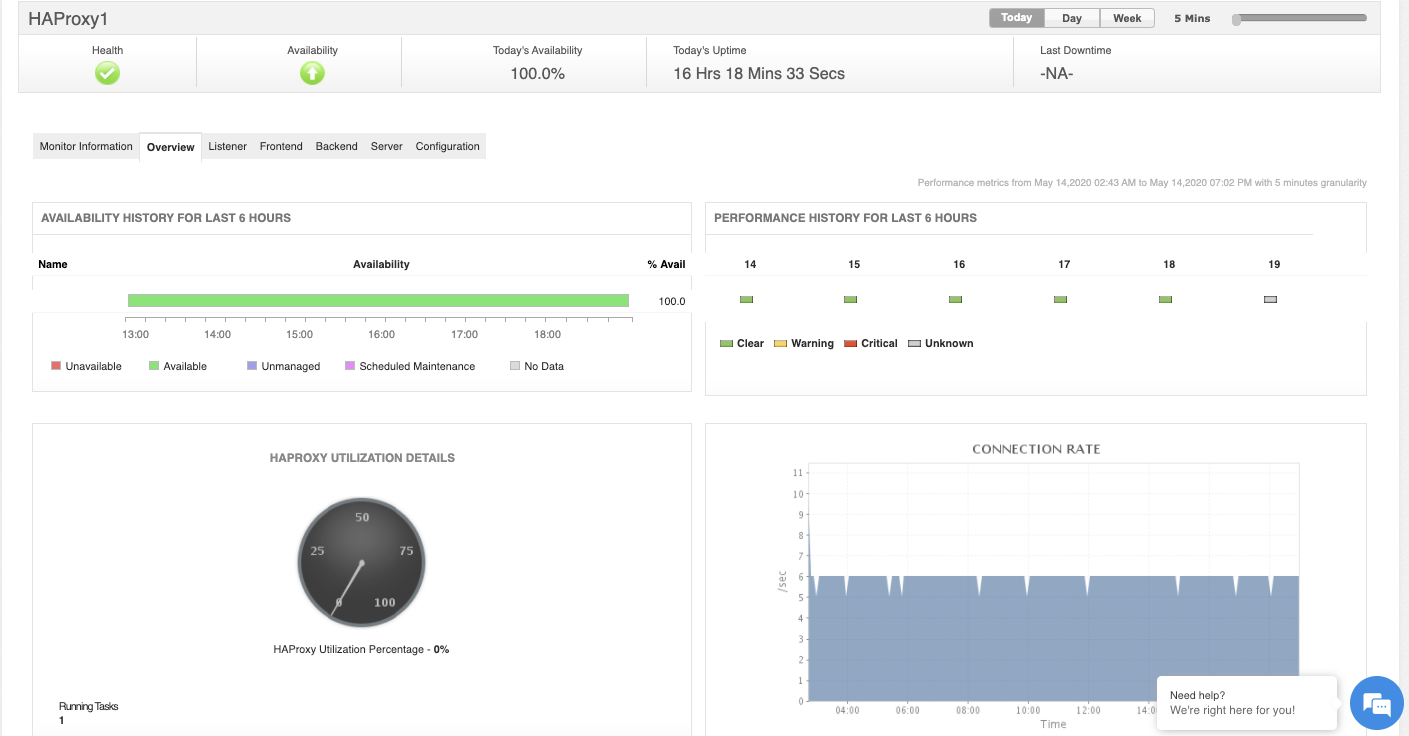
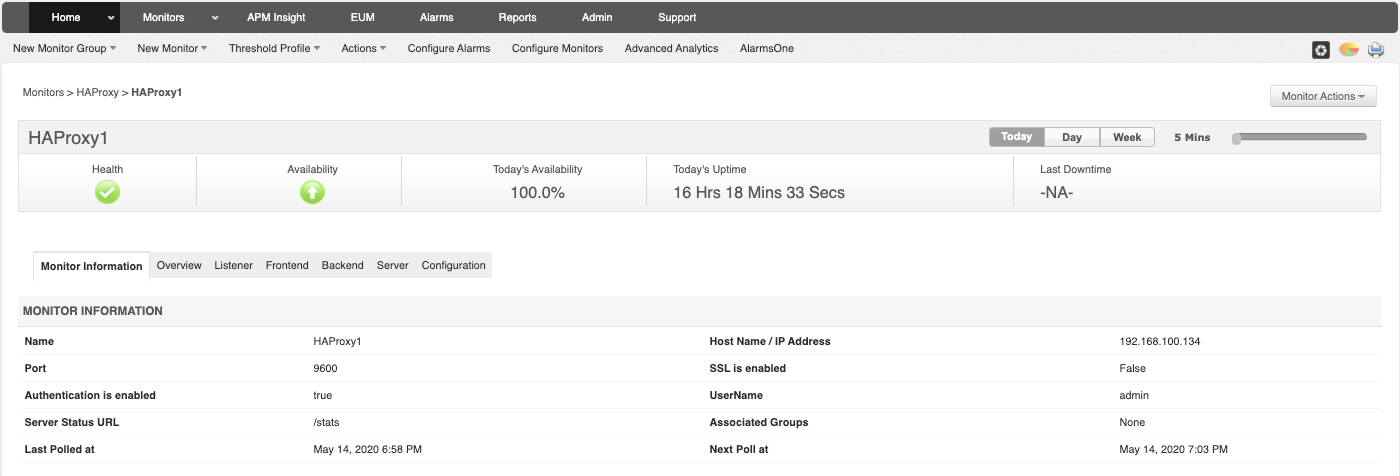
In the Monitor Information tab, you’ll see the data added during the import process.
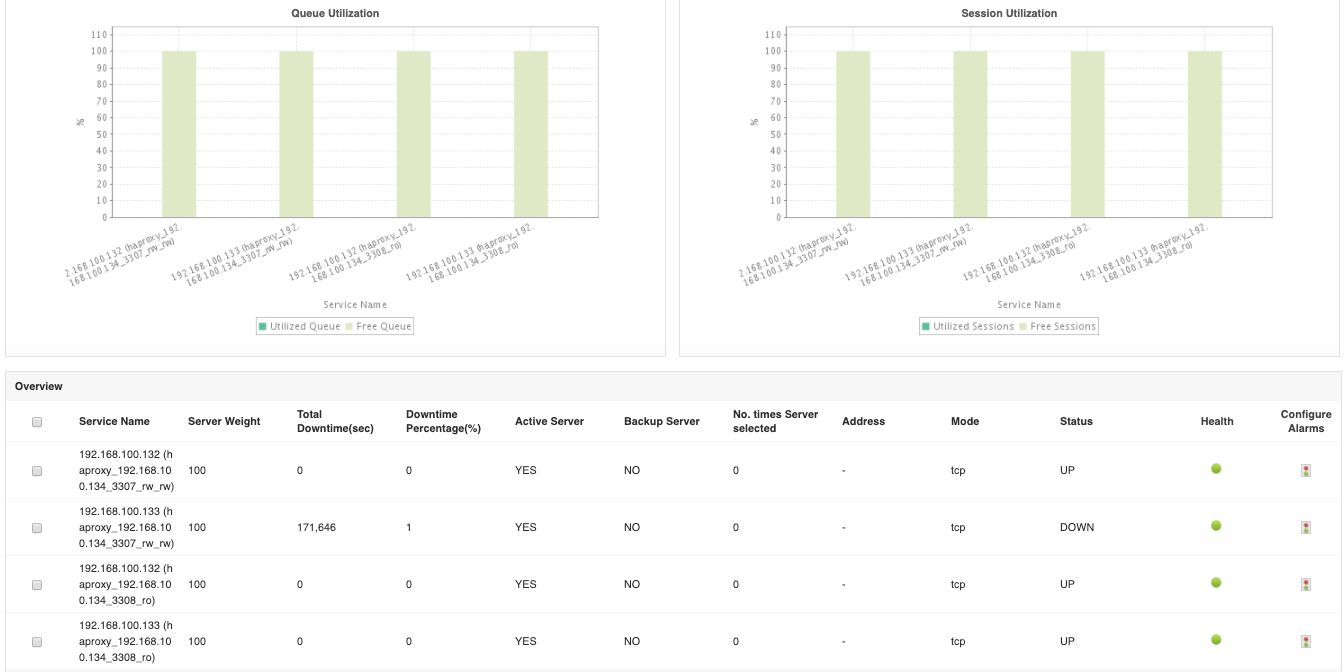
Then, you have the Listener, Frontend, Backend, and Server tabs, where you have metrics about each section, like Session Utilization, Transaction Details, Response Times, and even more.
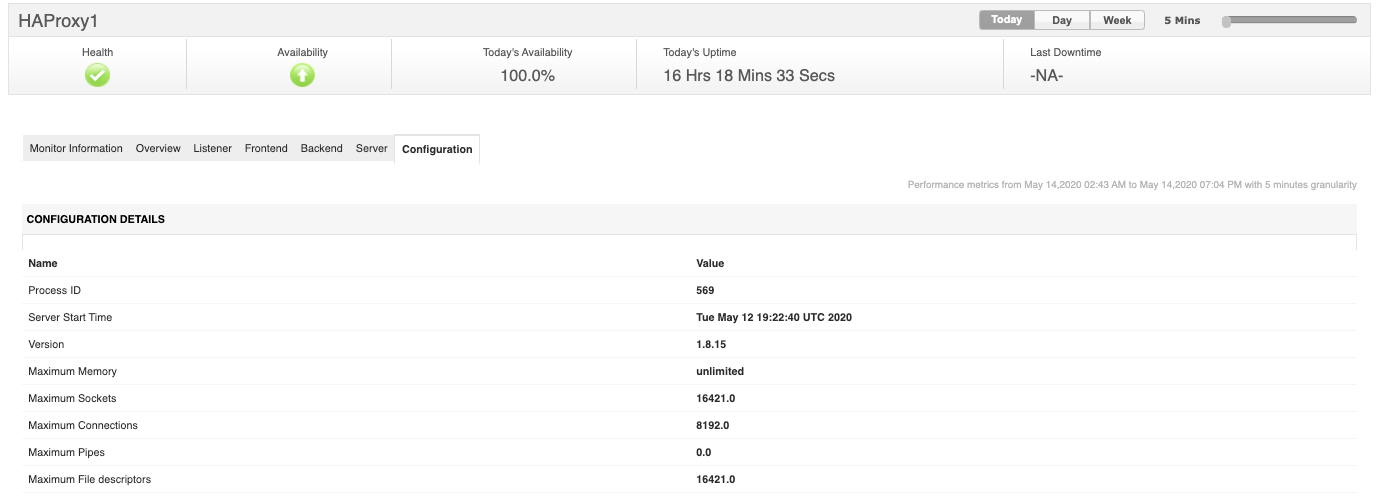
Finally, in the Configuration tab, you’ll see some HAProxy configuration values like max connections and version.
HAProxy Monitoring with ClusterControl
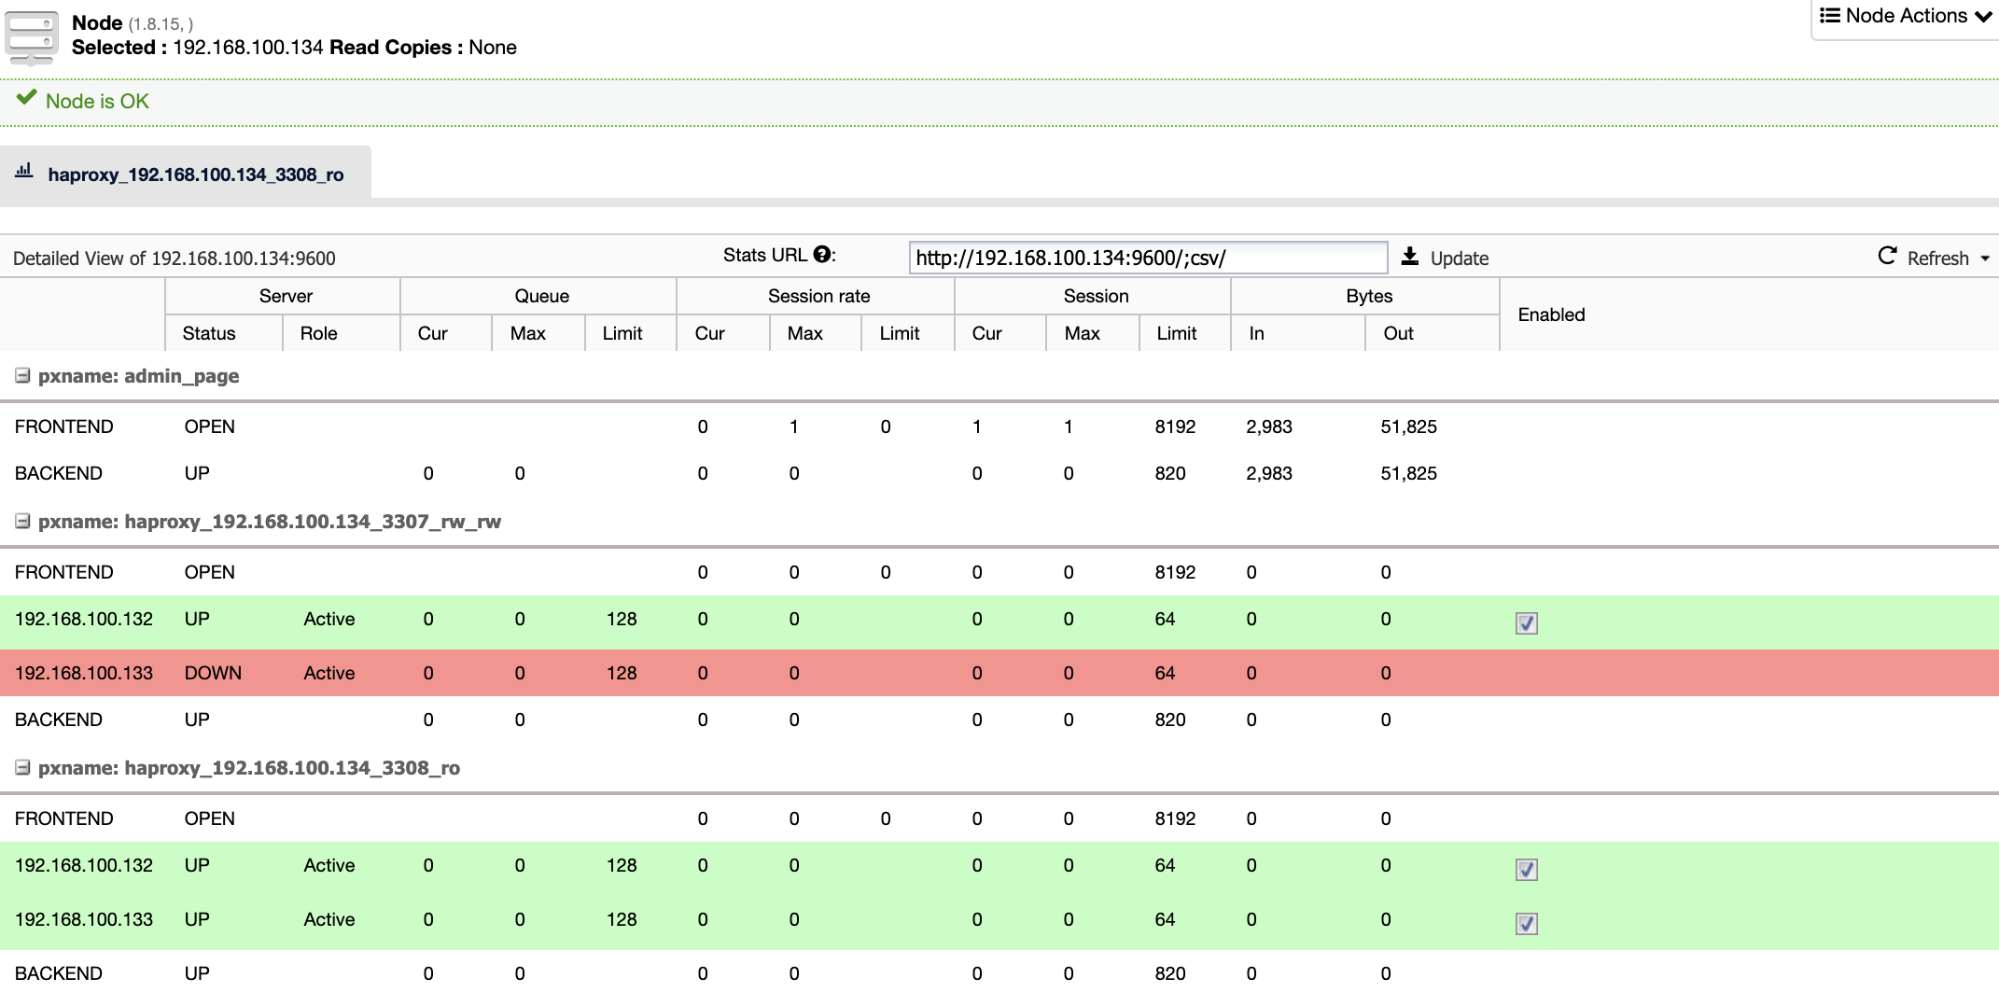
When you have your HAProxy node added into ClusterControl, you can go to ClusterControl -> Select Cluster -> Nodes -> HAProxy node, and check the current status.
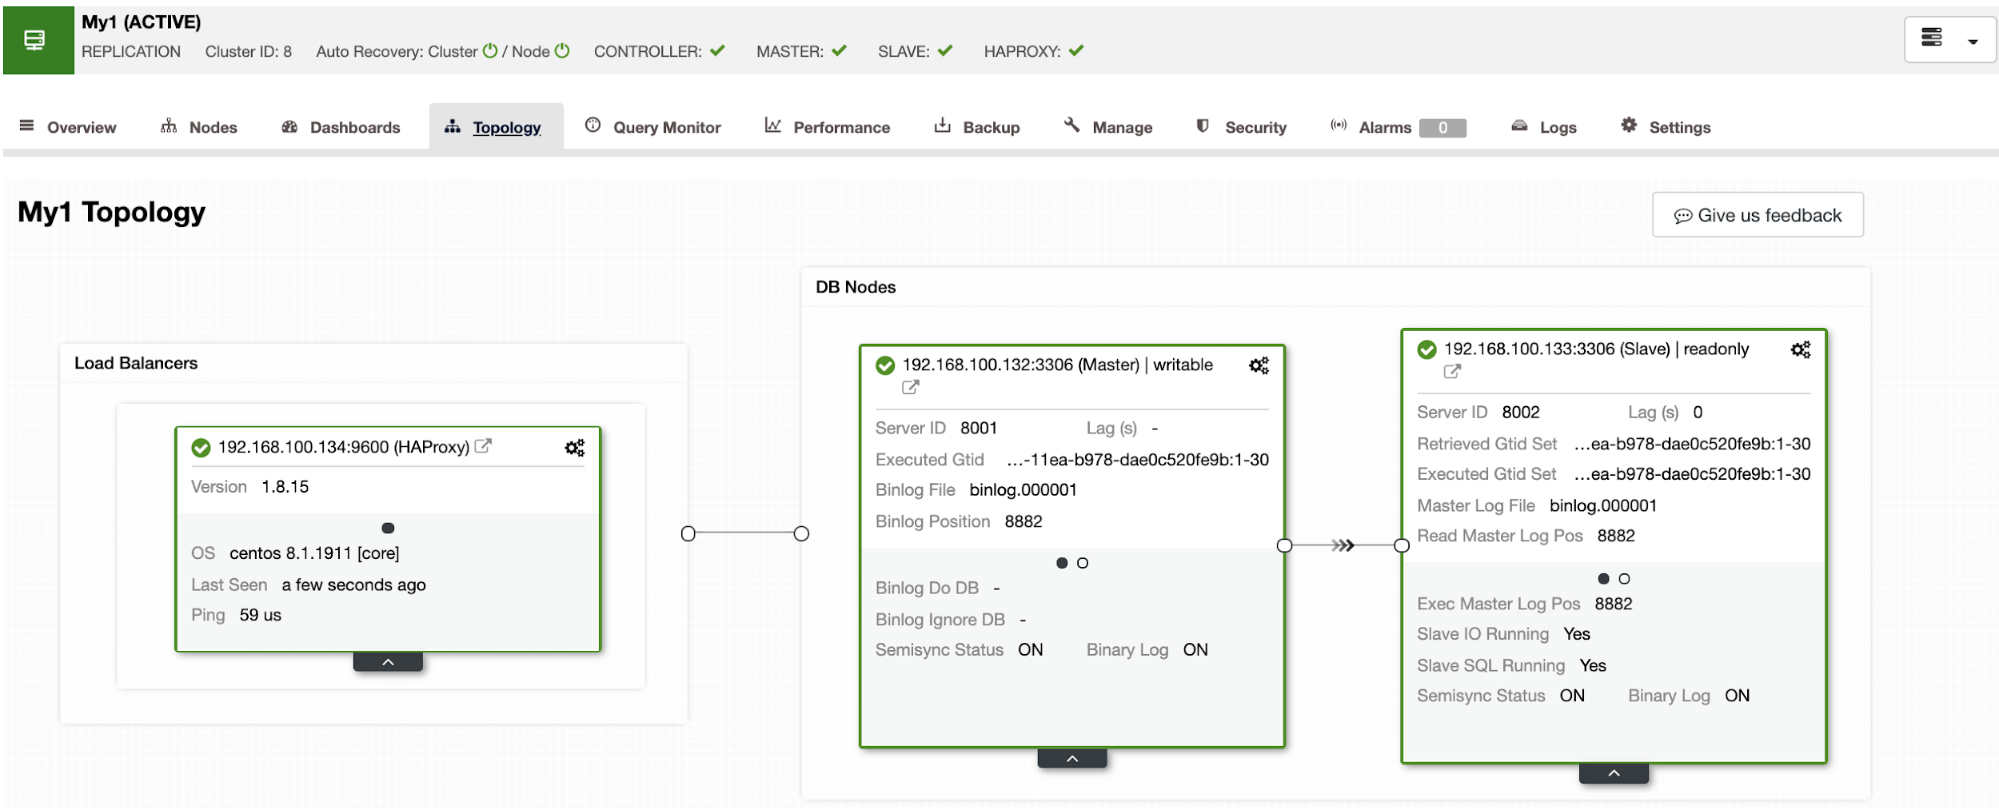
You can also check the Topology section, to have a complete overview of the environment.
But if you want to see more detailed information about your HAProxy node, you have the Dashboards section.
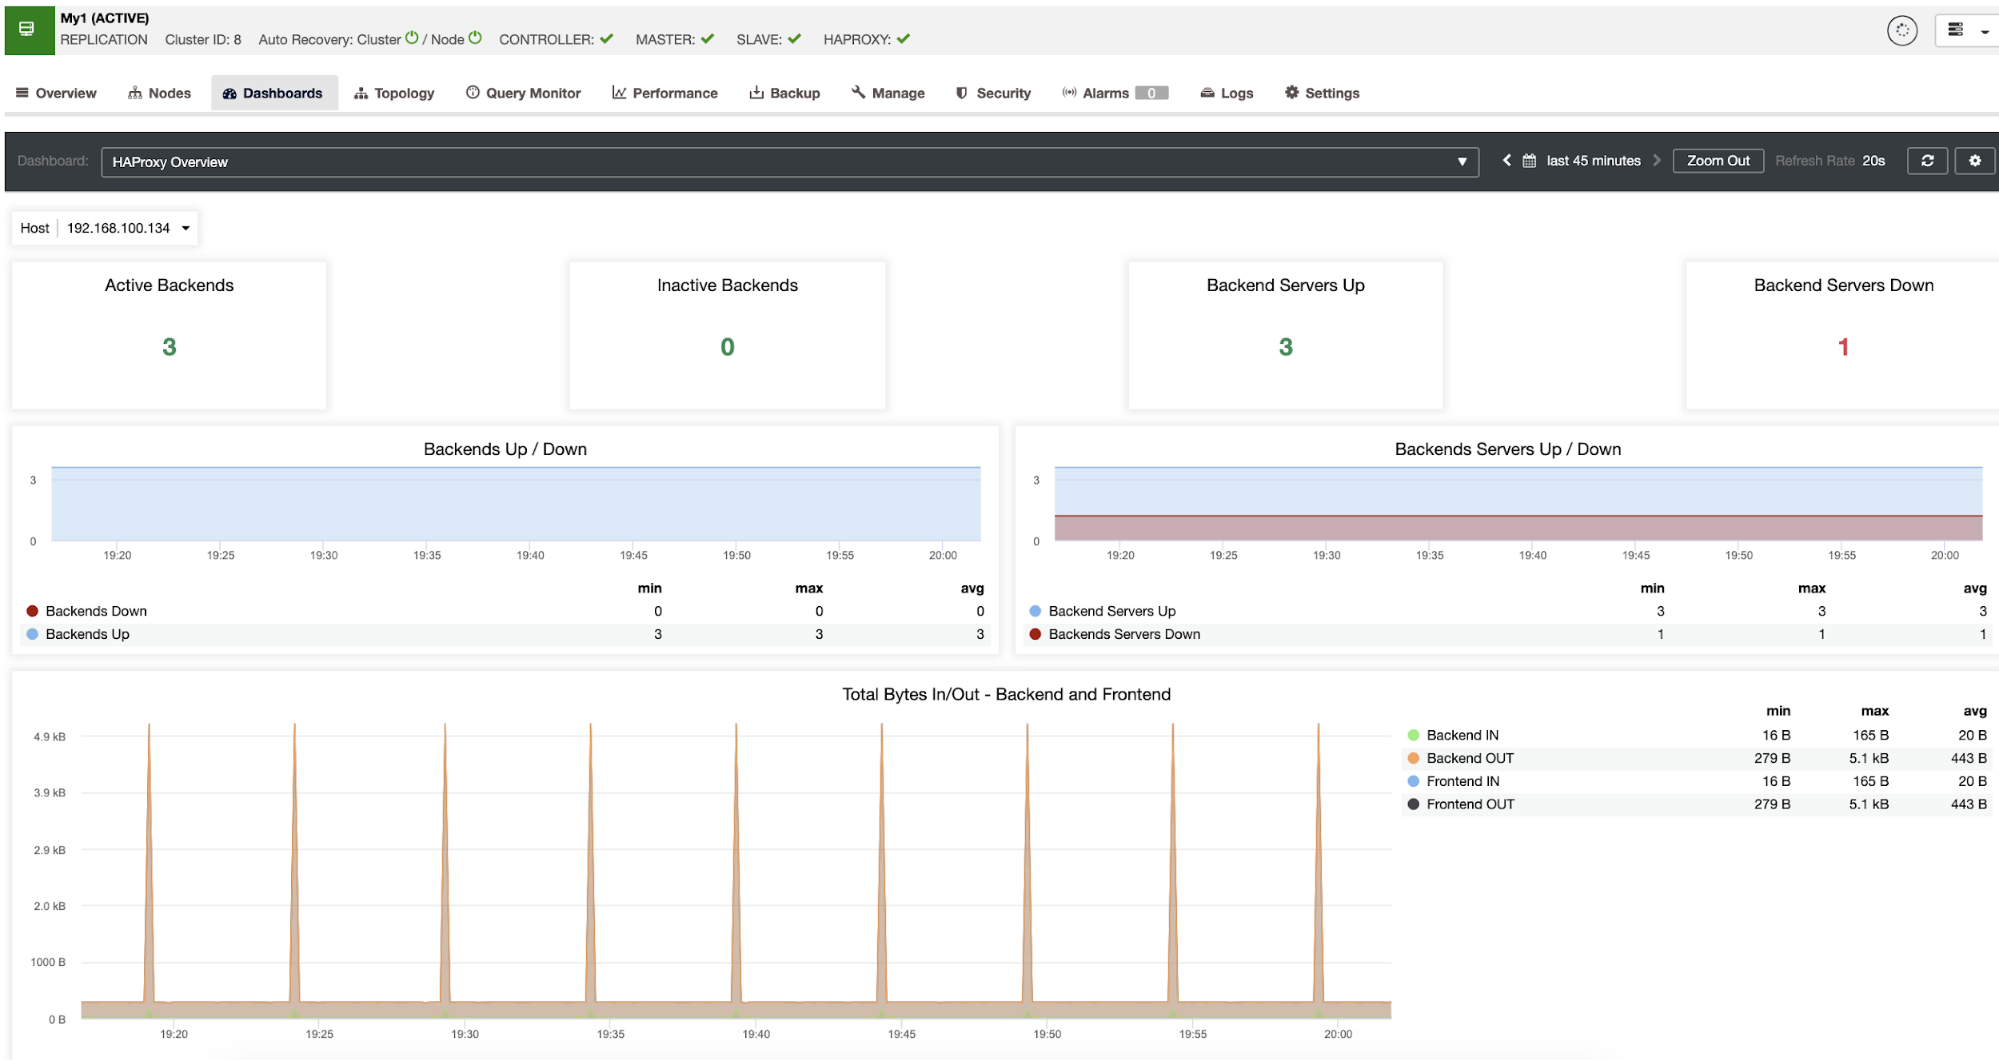
Here, you can’t only see all the necessary metrics to monitor the HAProxy node, but also to monitor all the environment using the different Dashboards.
Alarms & Notifications
Manage Engine Applications Manager Notifications
As we mentioned in the previous related blog, this system has its own alarm system where you must configure actions to be run when the alarm is generated.
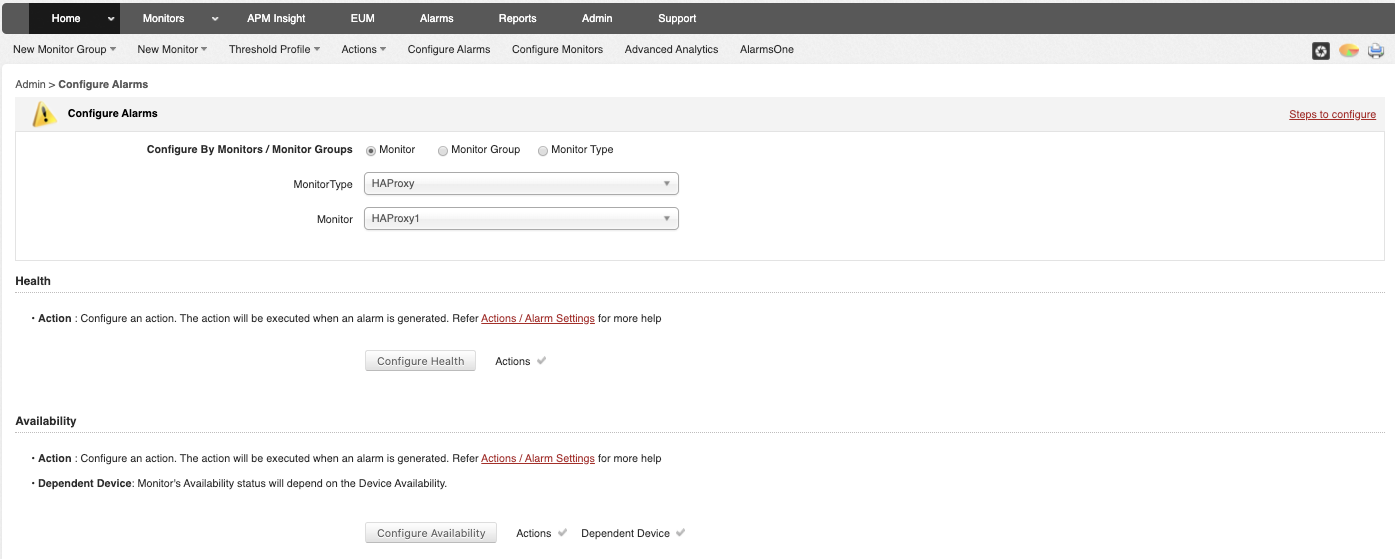
You can configure alarms and actions, and you can also integrate it with their own Alarm System called AlarmsOne (a different product).
ClusterControl Notifications
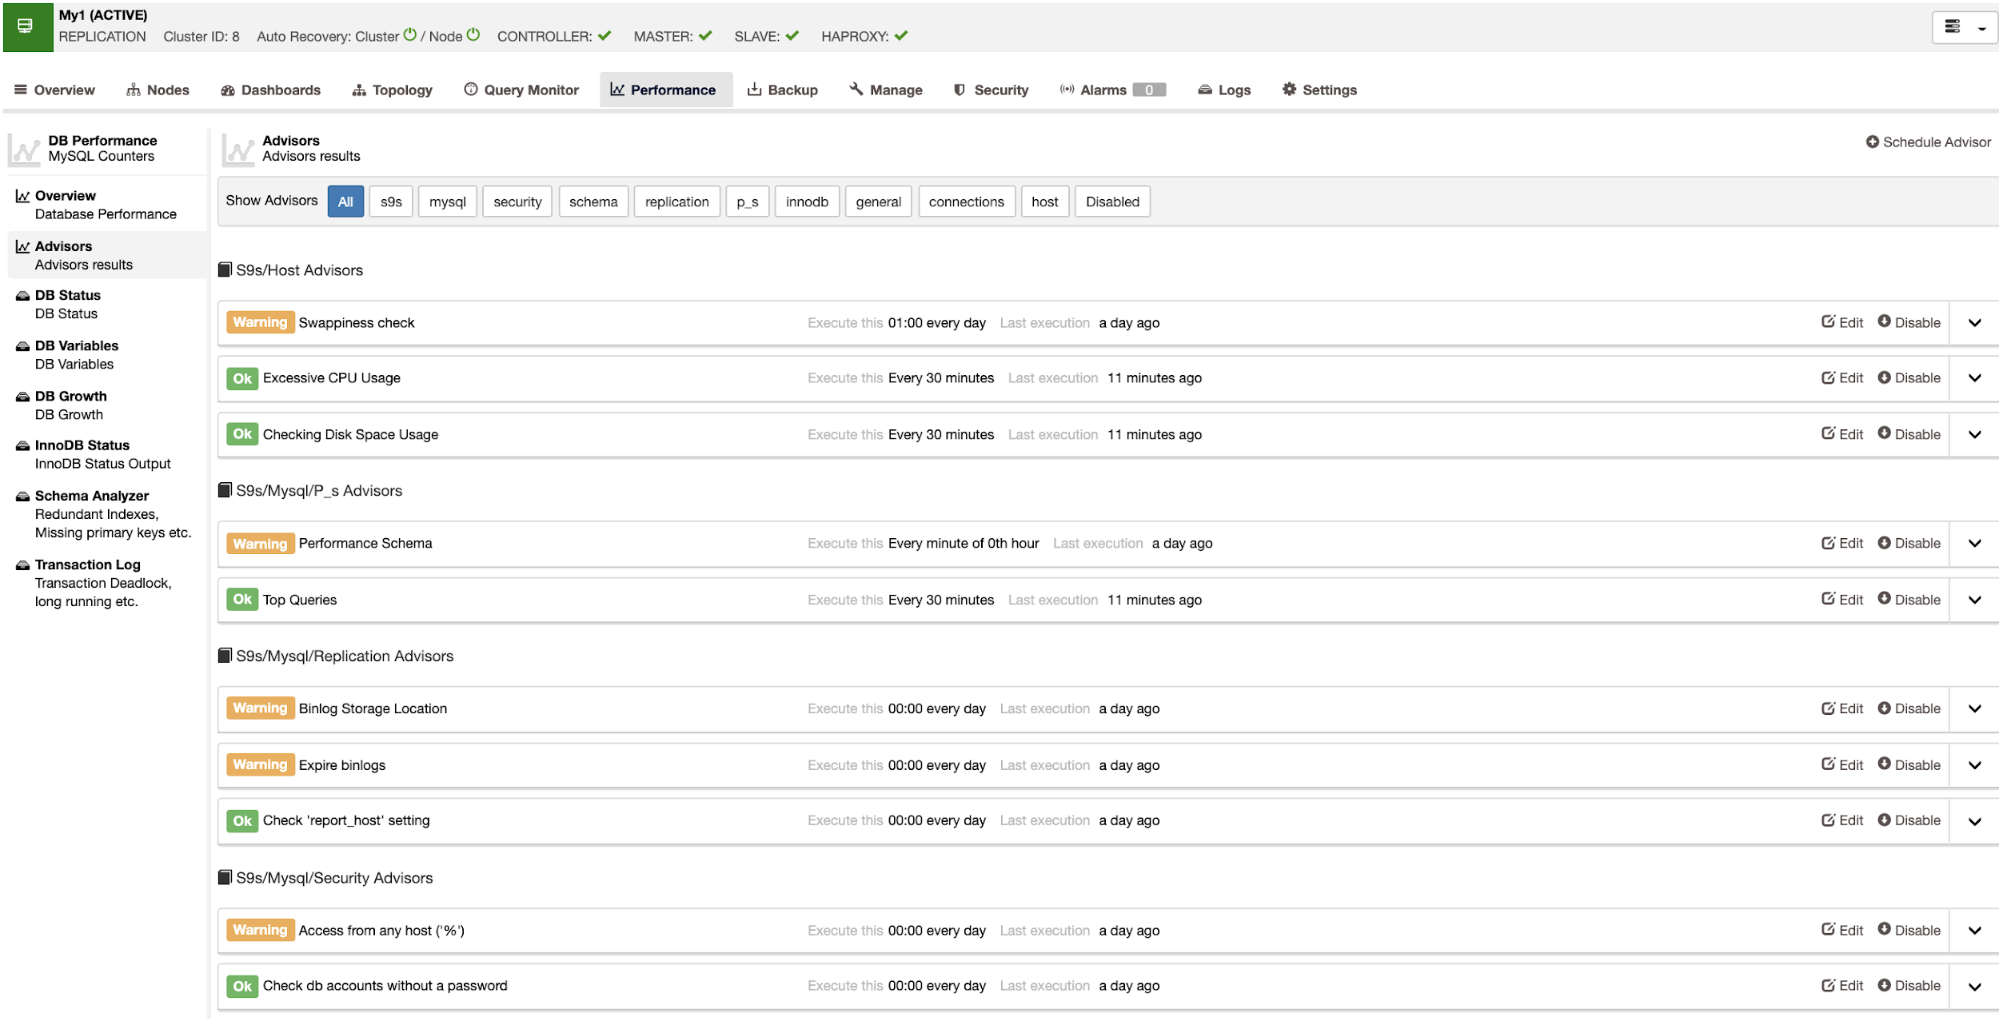
It also has an alarm system using advisors. ClusterControl comes with some predefined advisors, but you can modify it or even create a new one using the Developer Studio integrated tool.
It has integration with 3rd party tools like Slack or PagerDuty, so you can receive notifications there too.
Command Line Monitoring
Applications Manager CLI
Unfortunately, this system doesn’t have a command-line tool that allows you to monitor applications or databases from the command line.
ClusterControl CLI (s9s)
For scripting and automating tasks, or even if you just prefer the command line, ClusterControl has the s9s tool. It’s a command-line tool for managing your database cluster.
$ s9s node --cluster-id=8 --list --long

STAT VERSION    CID CLUSTER HOST            PORT COMMENT

coC- 1.7.6.3910   8 My1     192.168.100.131 9500 Up and running.

?o-- 2.12.0       8 My1     192.168.100.131 9090 Process 'prometheus' is running.

soM- 8.0.19       8 My1     192.168.100.132 3306 Up and running.

soS- 8.0.19       8 My1     192.168.100.133 3306 Up and running.

ho-- 1.8.15       8 My1     192.168.100.134 9600 Process 'haproxy' is running.

Total: 5
With this tool, you can perform all the tasks that you have in the ClusterControl UI, and even more. You can check the documentation to have more examples and information about the usage of this powerful tool.
Conclusion
As you could see, both systems are useful to monitor an HAProxy node. They have graphs, metrics, and alarms to help you to know the current status of your HAProxy node. The main differences between them are the possibility of ClusterControl to deploy the HAProxy node itself, avoiding manual tasks, and also the ClusterControl CLI feature, that allows you to import/deploy, manage, or monitor everything from the command line.
Apart from that, both solutions are a good way to keep your systems monitored all the time