blog
How to Monitor MySQL or MariaDB Galera Cluster with Prometheus Using SCUMM

ClusterControl version 1.7 introduced a new way to watch your database clusters. The new agent-based approach was designed for demanding high-resolution monitoring. ClusterControl agentless, secure SSH-based remote stats collection has been extended with modern high-frequency monitoring based on time series data.
SCUMM is the new monitoring and trending system in ClusterControl.
It includes built-in active scraping and storing of metrics based on time series data. The new version of ClusterControl 1.7 uses Prometheus exporters to gather more data from monitored hosts and services.
In this blog, we will see how to use SCUMM to monitor multi-master Percona XtraDB Cluster and MariaDB Galera Cluster instances. We will also see what metrics are available, and which ones can are tracked with built-in dashboards.
What is SCUMM?
To be able to understand the new functionality and recent changes in ClusterControl, let’s take a quick look first at the new monitoring architecture – SCUMM.
SCUMM (Severalnines ClusterControl Unified Monitoring & Management) is a new agent-based solution with agents installed on the database nodes. It consists of two core elements:
- Prometheus server which is a time series database to collect the data.
- Exporters which export metrics from services like Galera cluster WSREP API.
More details can be found in our introduction blog for SCUMM.
How to use SCUMM for Galera Cluster?
The main requirement is to upgrade your current ClusterControl or install at least version 1.7. You can find the upgrade and installation procedure in the online documentation. You will then see a new tab called Dashboards. By default, the new Dashboard is disabled. Until it’s enabled, ClusterControl monitoring is based on agentless SSH secure key.
ClusterControl takes care of installing and maintaining Prometheus as well as exporters on the monitored hosts. The installation process is automated.
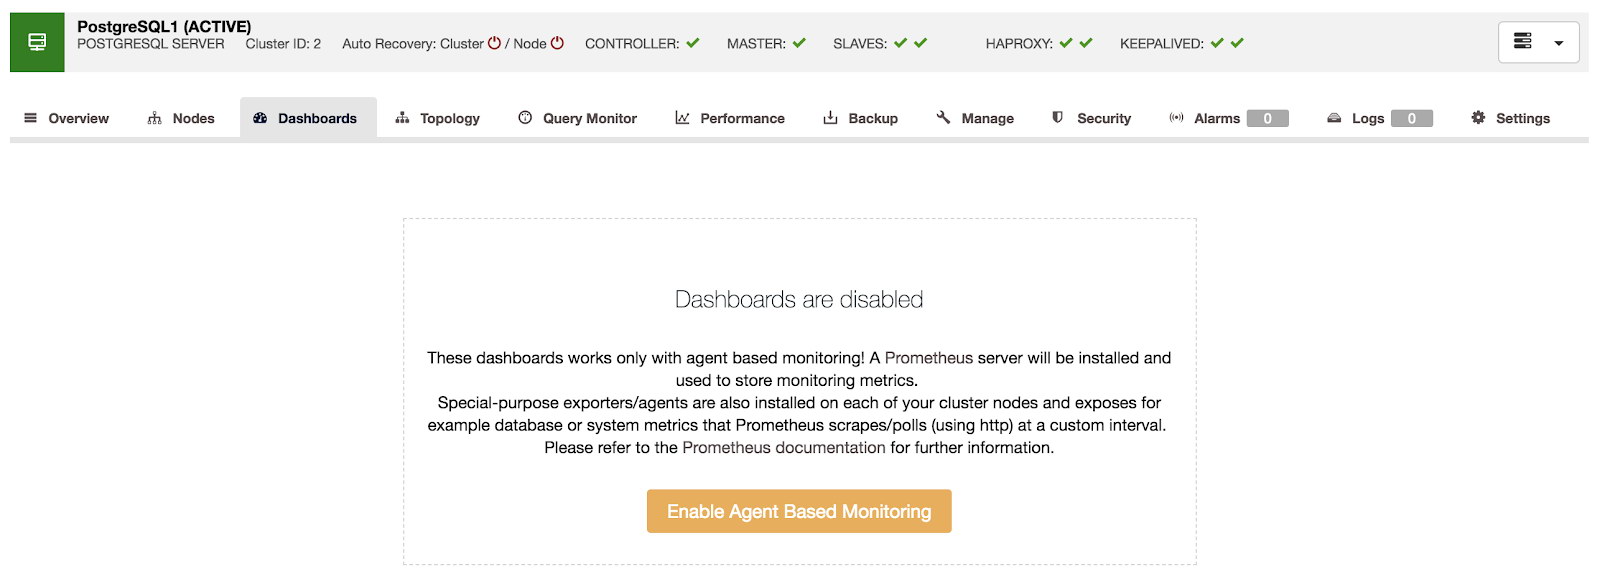
After choosing Enable Agent-Based Monitoring, you will see the following.
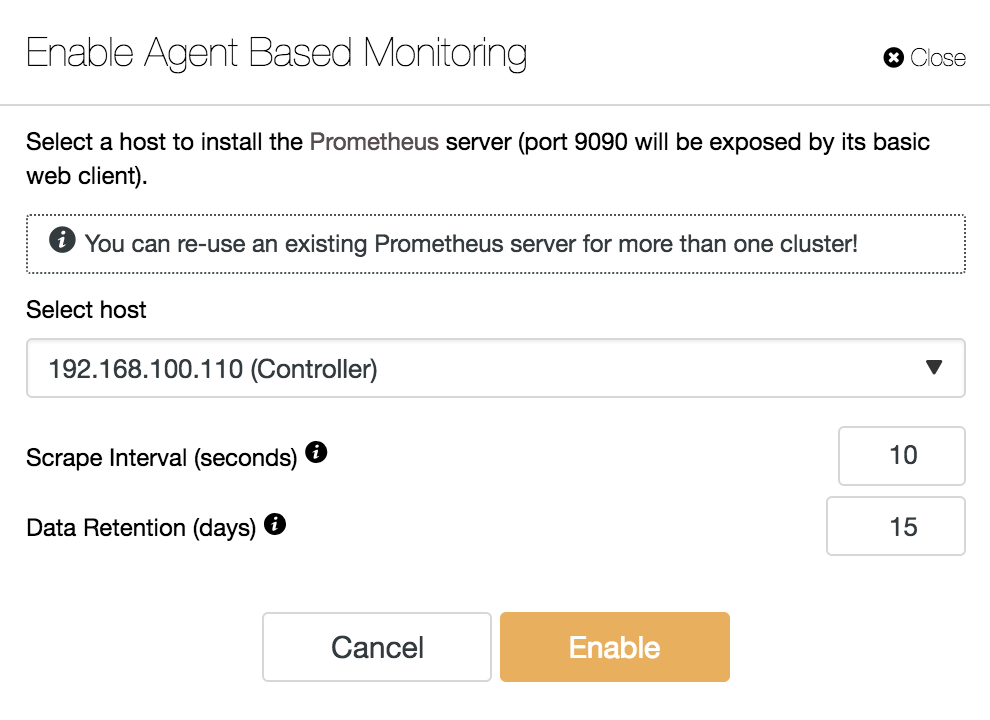
Here you can specify the host on which to install our Prometheus server. The host can be your ClusterControl server, or a dedicated one. It is also possible to re-use another Prometheus server that is managed by ClusterControl.
Other options to specify are:
- Scrape Interval (seconds): Set how often the nodes are scraped for metrics. By default 10.
- Data Retention (days): Set how long the metrics are kept before being removed. By default 15.
We can monitor the installation of our server and agents from the Activity section in our ClusterControl and, once it is finished, we can see our cluster with the agents enabled from the main ClusterControl screen.

Dashboards
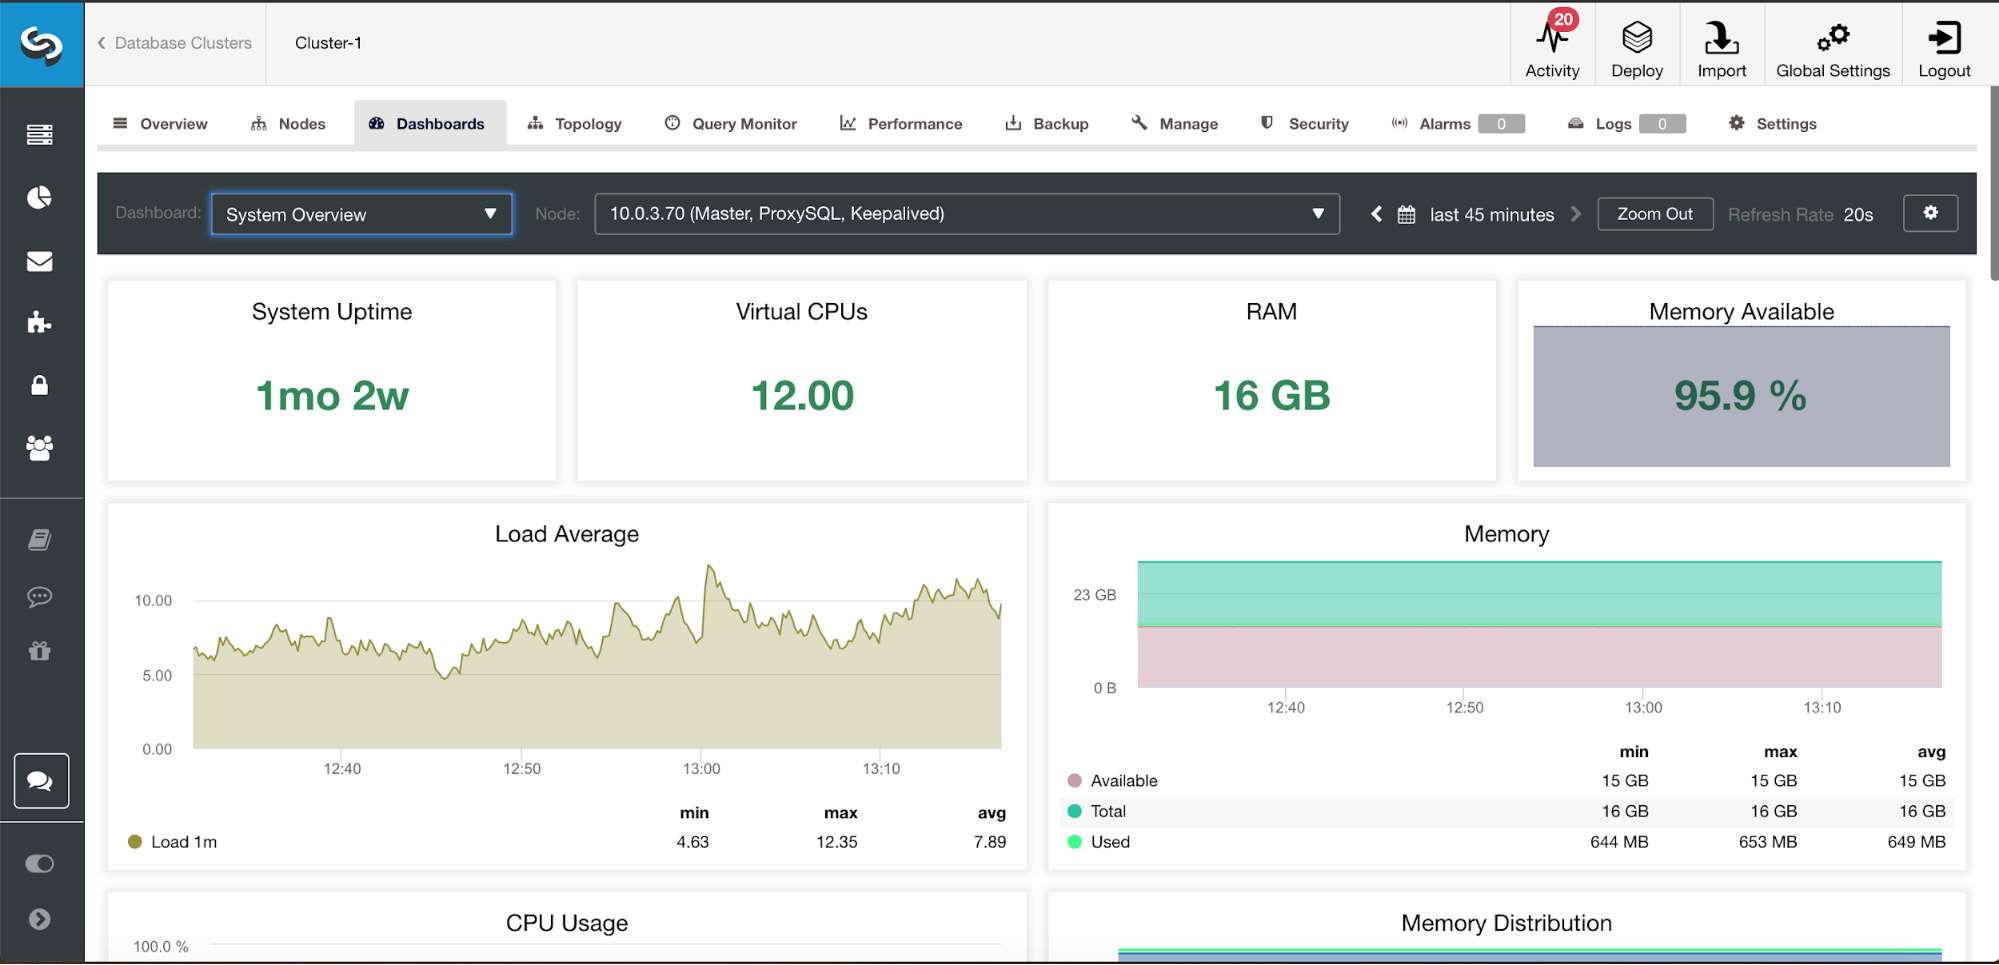
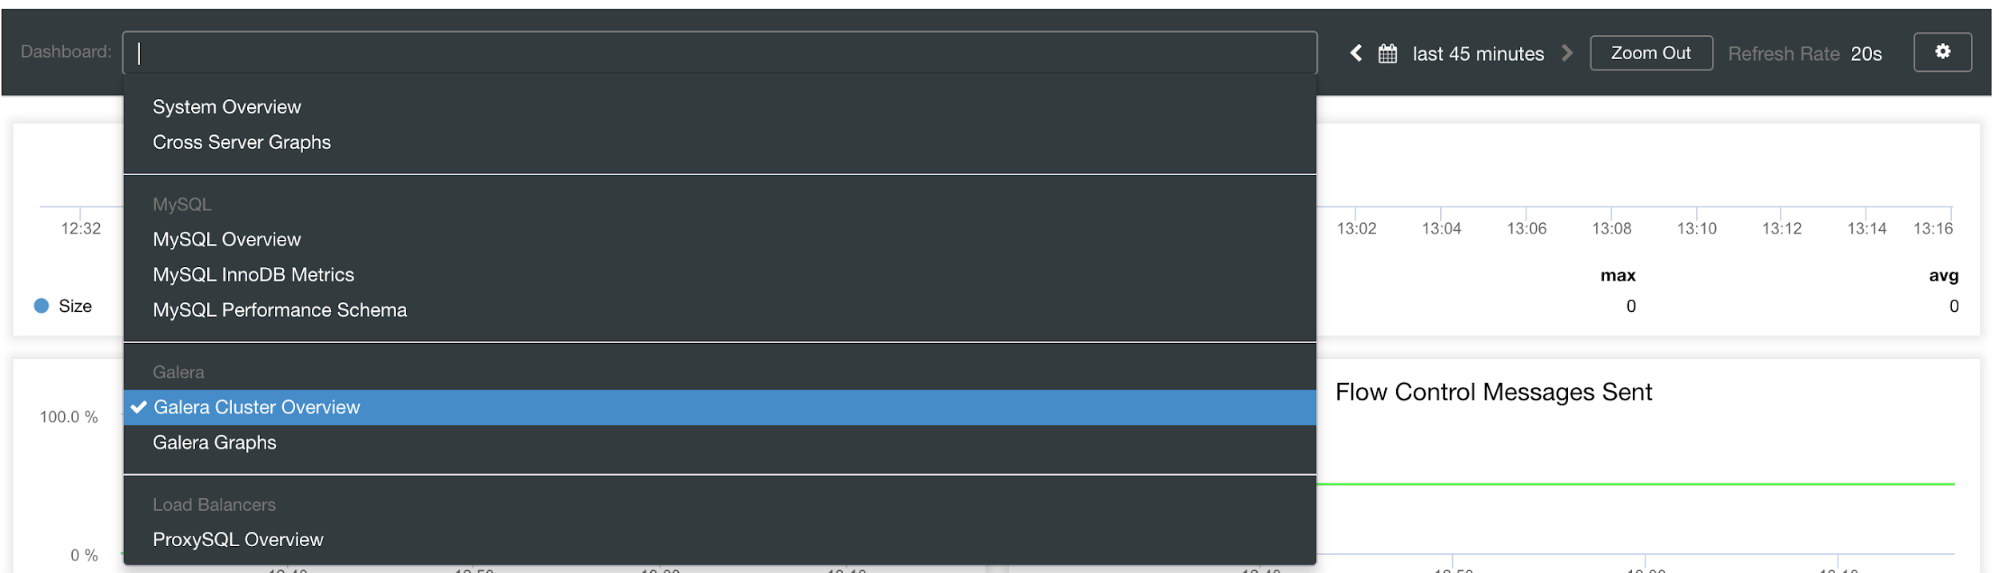
Having our agents enabled, if we go to the Dashboards section, we would see something like this:
There are seven different kinds of dashboards available: System Overview, Cross Server Graphs, MySQL Overview, MySQL InnoDB Metrics, MySQL Performance Schema, Galera Cluster Overview, Galera Graphs.
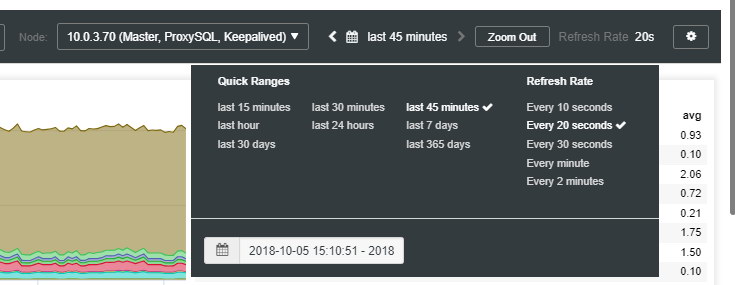
Here we can also specify which node to monitor, the time range and the refresh rate.
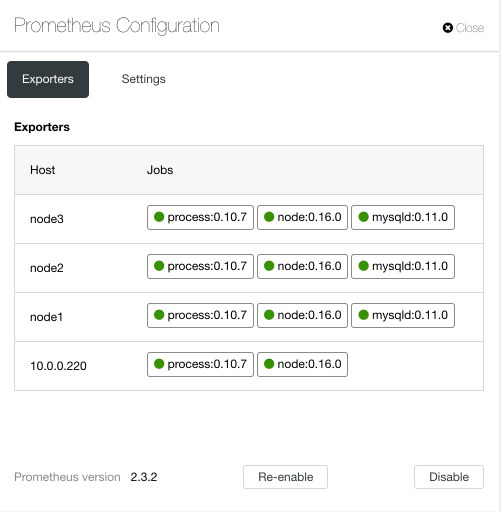
In the configuration section, we can enable or disable our agents (Exporters), check the agents status and verify the version of our Prometheus server.
Galera Cluster Overview
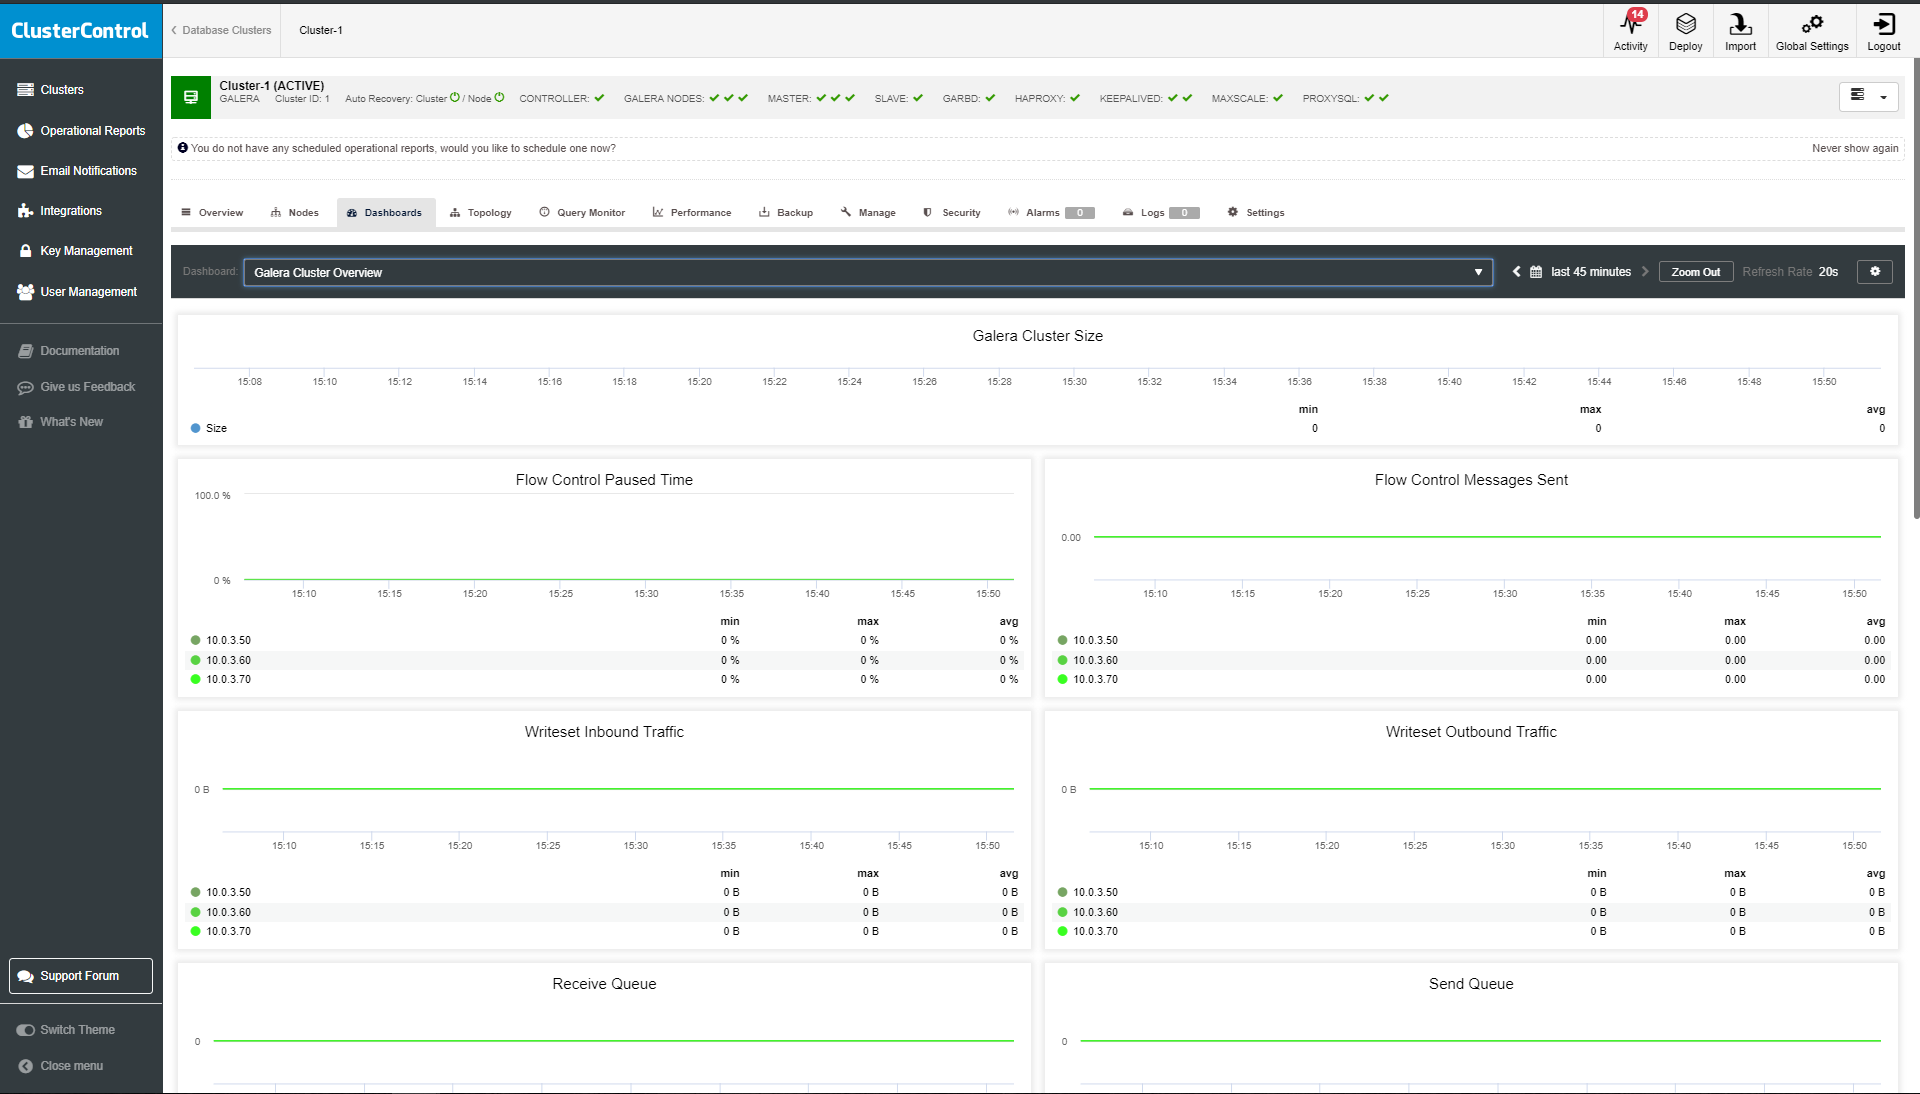
Galera Cluster overview enables you to see most critical Galera cluster metrics. The information here is based on WSREP API status.
- Galera Cluster Size: shows the number of nodes in the cluster.
- Flow Control Paused Time: a time when flow control is in effect.
- Flow Control Messages Sent: the number of messages sent to other cluster members to slow down.
- Writeset Inbound Traffic: transaction commits that the node receives from the cluster.
- Writeset Outbound Traffic: transaction commits that the node sends from the cluster.
- Receive Queue: a number of write-sets waiting to be applied.
- Send Queue: a number of write-sets sent.
- Transactions Received: a number of transactions received.
- Transactions Replicated: a number of transactions replicated.
- Average Incoming Transaction Size: number of average incoming transactions per node.
- Average Replicated Transaction: number of average replicated transactions per node.
- FC Trigger Low Limit: the point at which Flow Control engages.
- FC Trigger High Limit.
- Sequence numbers of transactions.
MySQL Overview
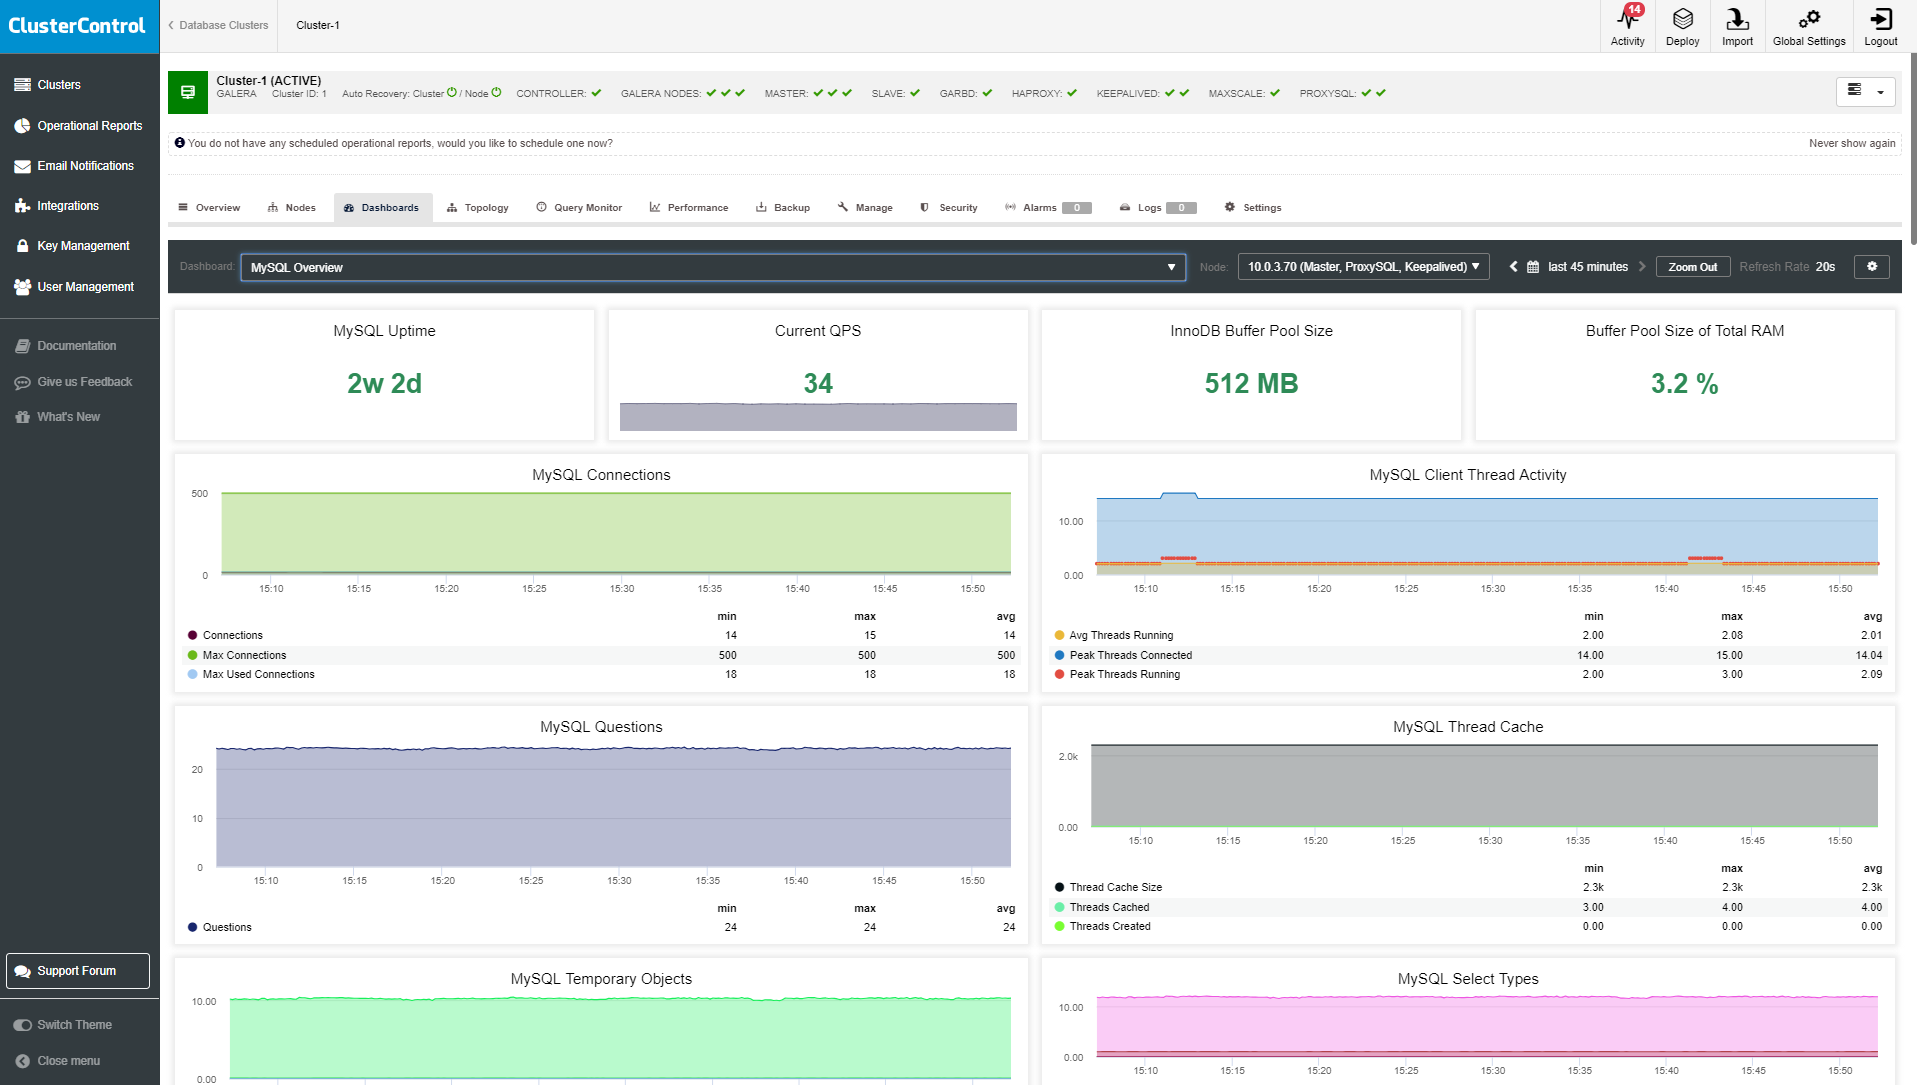
- MySQL Uptime: The amount of time since the MySQL server process was started.
- Current QPS: The number of queries executed by the server during the last second.
- InnoDB Buffer Pool Size: InnoDB buffer pool used for caching data and indexes in memory.
- Buffer Pool Size % of Total RAM: The ratio between InnoDB buffer pool size and total memory.
- MySQL Connections: The number of connection attempts (successful or not).
- MySQL Client Thread Activity: Number of threads.
- MySQL Questions: The number of queries sent to the server by clients, excluding those executed within stored programs.
- MySQL Thread Cache: The thread_cache_size metric informs how many threads the server should cache to reuse.
- MySQL Temporary Objects.
- MySQL Select Types: counters for selects not done with indexes.
- MySQL Sorts: Full table scans for sorts.
- MySQL Slow Queries: Slow queries are defined as queries being slower than the long_query_time setting.
- MySQL Aborted Connections: Number of aborted connections.
- MySQL Table Locks: Number of table locks.
- MySQL Network Traffic: Shows how much network traffic is generated by MySQL.
- MySQL Network Usage Hourly: Shows how much network traffic is generated by MySQL per hour.
- MySQL Internal Memory Overview: Shows various uses of memory within MySQL.
- Top Command Counters: The number of times each statement has been executed.
- MySQL Handlers: Internal statistics on how MySQL is selecting, updating, inserting, and modifying rows, tables, and indexes.
- MySQL Transaction Handlers.
- Process States.
- Top Process States Hourly.
- MySQL Query Cache Memory.
- MySQL Query Cache Activity.
- MySQL File Openings.
- MySQL Open Files: Number of files opened by MySQL.
- MySQL Table Open Cache Status.
- MySQL Open Tables: Number of open tables.
- MySQL Table Definition Cache.
MySQL InnoDB Metrics
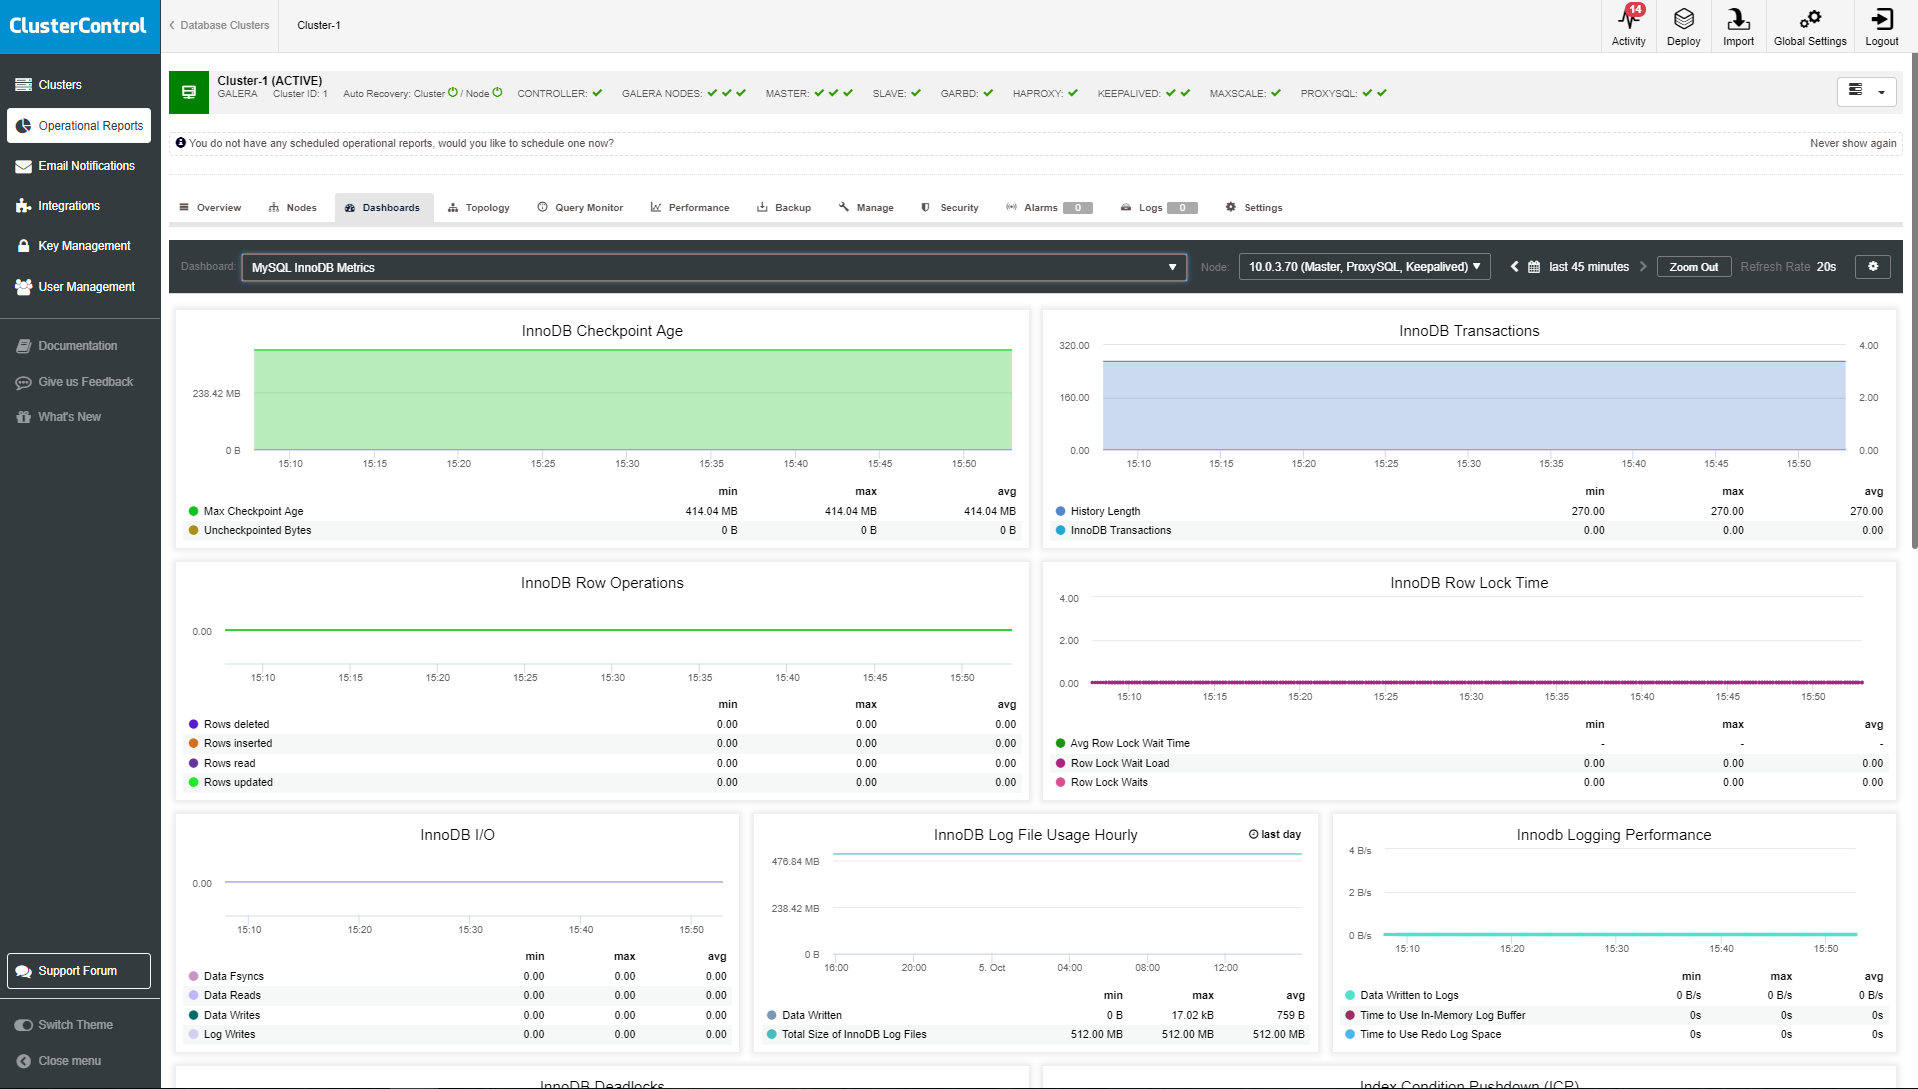
- InnoDB Checkpoint Age.
- InnoDB Transactions.
- InnoDB Row Operations.
- InnoDB Row Lock Time.
- InnoDB I/O.
- InnoDB Log File Usage Hourly.
- InnoDB Logging Performance.
- InnoDB Deadlocks.
- Index Condition Pushdown.
- InnoDB Buffer Pool Content.
- InnoDB Buffer Pool Pages.
- InnoDB Buffer Pool I/O.
- InnoDB Buffer Pool Requests.
- InnoDB Read-Ahead.
- InnoDB Change Buffer.
- InnoDB Change Buffer Activity.
MySQL Performance Schema
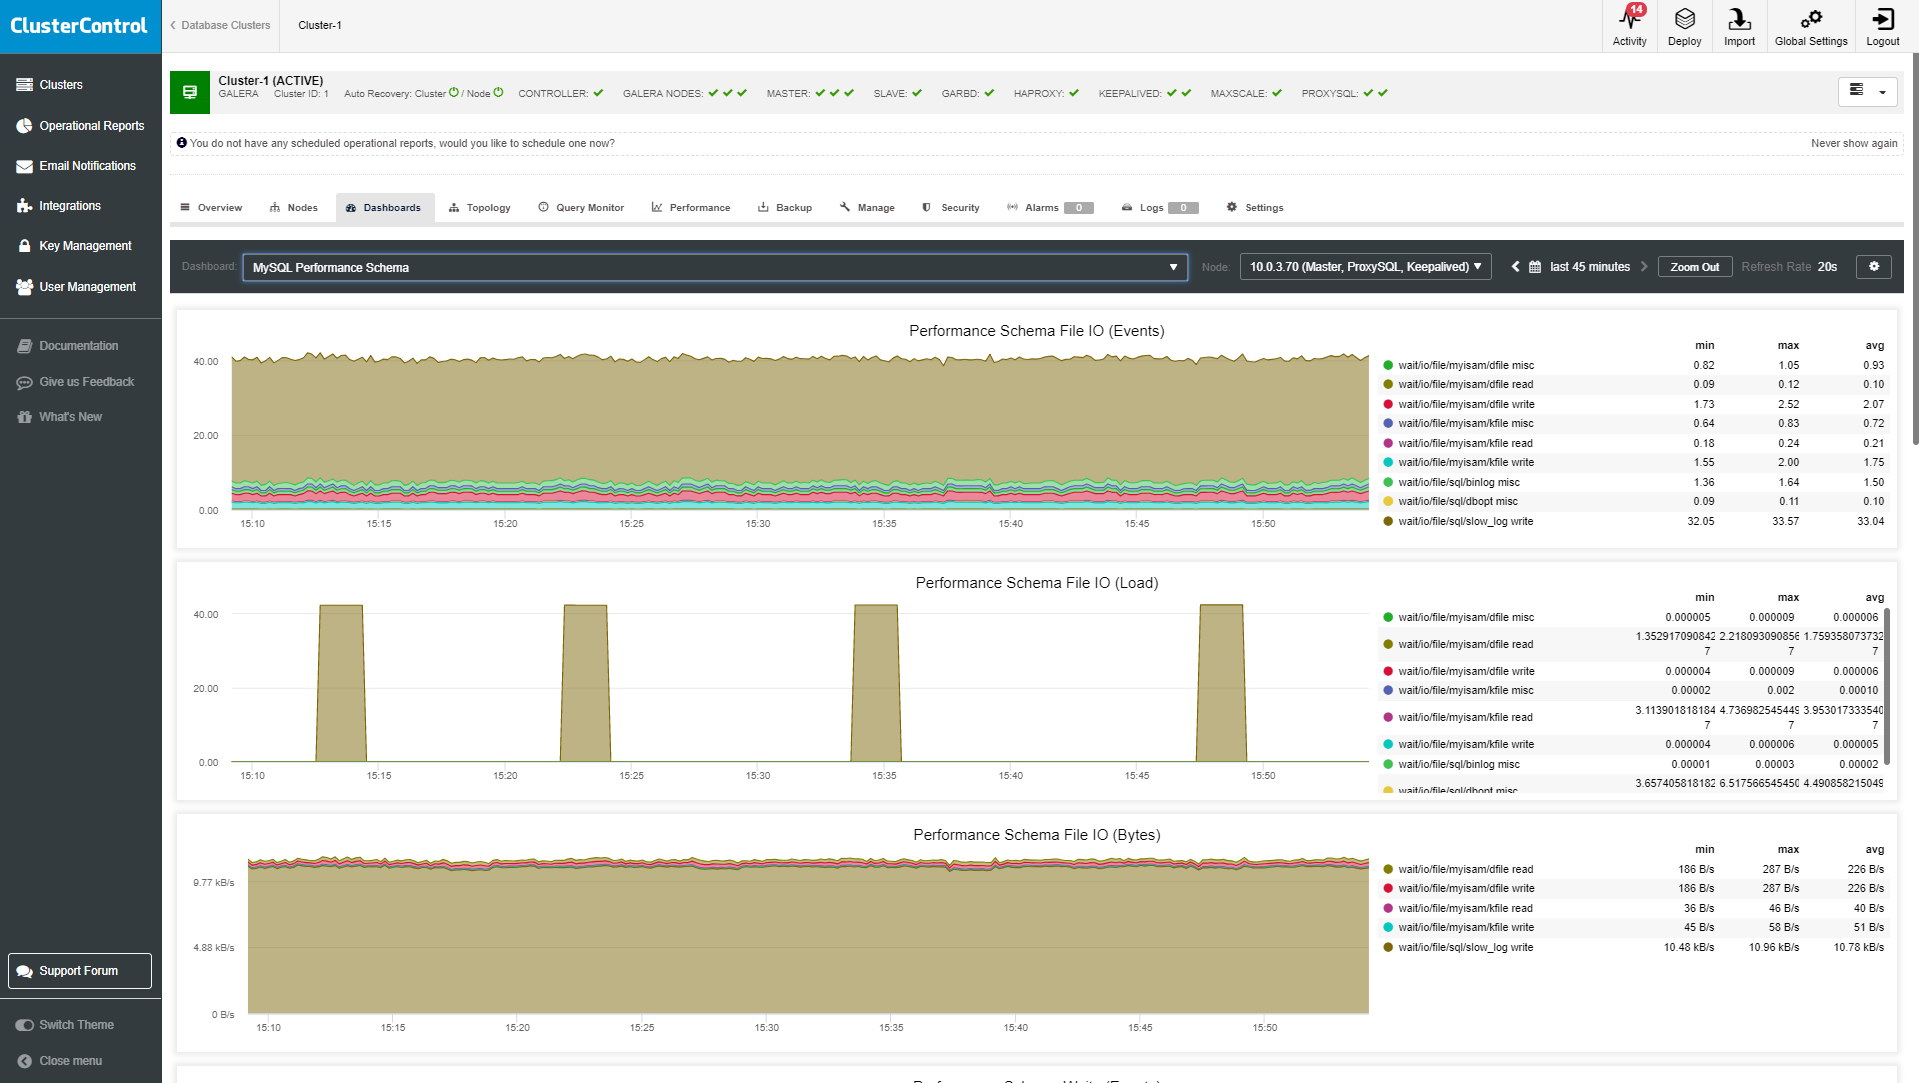
This graph provides a way to inspect the internal execution of the server at runtime. It requires to have performance schema enabled.
- Performance Schema File IO (Events).
- Performance Schema File IO (Load).
- Performance Schema File IO (Bytes).
- Performance Schema Waits (Events).
- Performance Schema Waits (Load).
- Index Access Operations (Load).
- Table Access Operations (Load).
- Performance Schema SQL & External Locks (Events).
- Performance Schema SQL and External Locks (Seconds).
System Overview Metrics
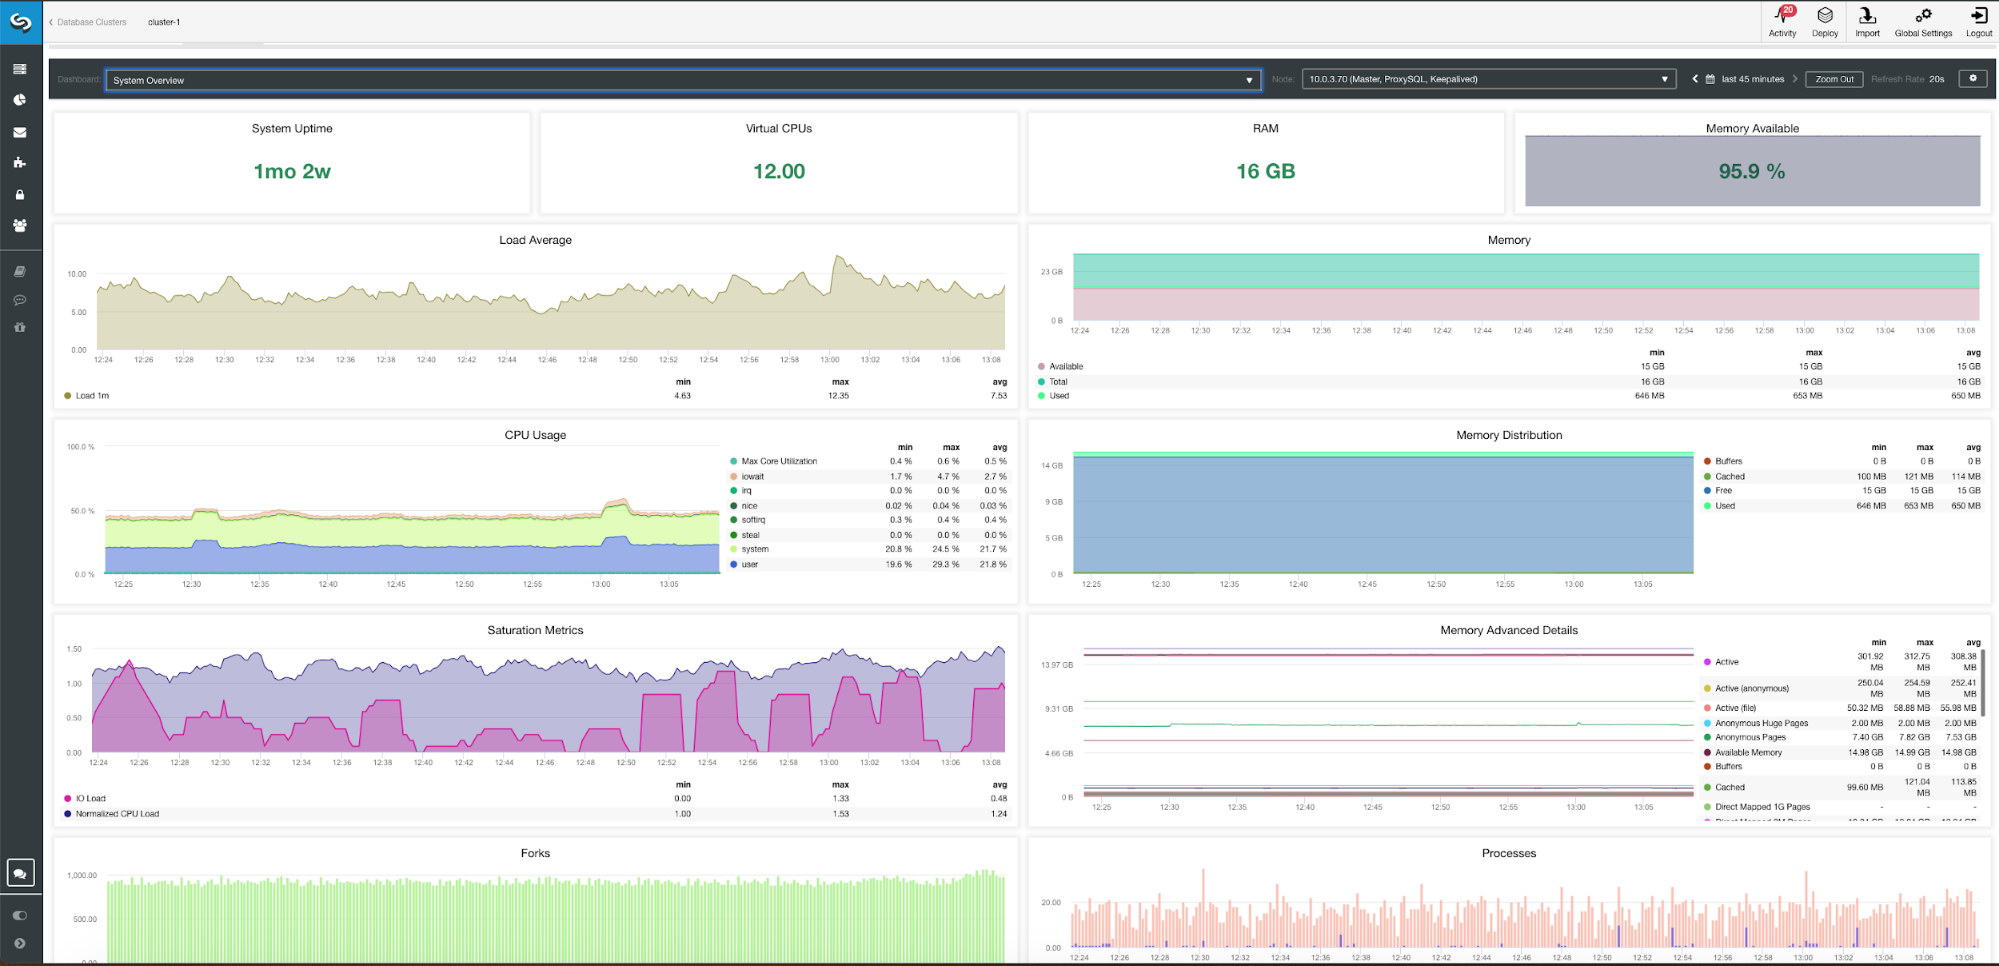
To monitor our system, we have available for each server the following metrics (all of them for the selected node):
- System Uptime: Time since the server is up.
- CPUs: Amount of CPUs.
- RAM: Amount of RAM memory.
- Memory Available: Percentage of RAM memory available.
- Load Average: Min, max and average server load.
- Memory: Available, total and used server memory.
- CPU Usage: Min, max and average server CPU usage information.
- Memory Distribution: Memory distribution (buffer, cache, free and used) on the selected node.
- Saturation Metrics: Min, max, and average of IO load and CPU load on the selected node.
- Memory Advanced Details: Memory usage details like pages, buffer and more, on the selected node.
- Forks: Amount of forks processes. The fork is an operation whereby a process creates a copy of itself. It is usually a system call, implemented in the kernel.
- Processes: Amount of processes running or waiting on the Operating System.
- Context Switches: A context switch is an action of storing the state of a processor of a thread.
- Interrupts: Amount of interrupts. An interrupt is an event that alters the normal execution flow of a program and can be generated by hardware devices or even by the CPU itself.
- Network Traffic: Inbound and outbound network traffic in KBytes per second on the selected node.
- Network Utilization Hourly: Traffic sent and received in the last day.
- Swap: Swap usage (free and used) on the selected node.
- Swap Activity: Reads and writes data on the swap.
- I/O Activity: Page in and page out on IO.
- File Descriptors: Allocated and limit file descriptors.
Cross-Server Graphs Metrics
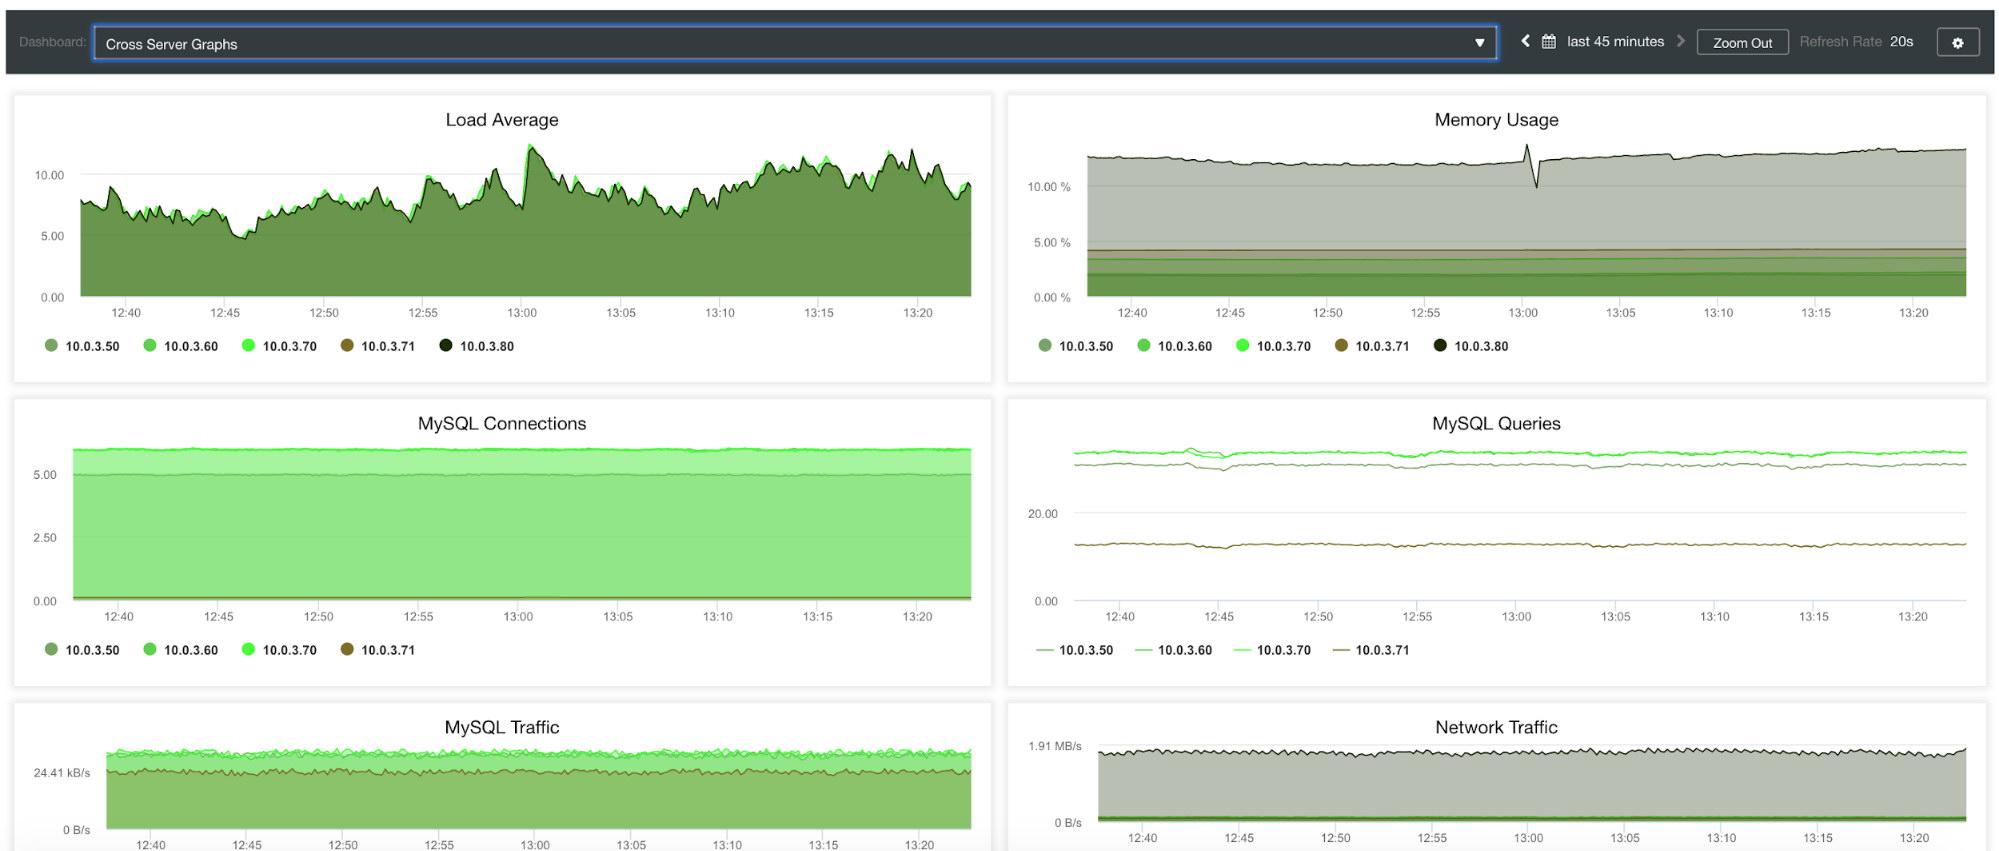
If we want to see the general state of all our servers with the information combined for OS and MySQL we can use this dashboard with the following metrics:
- Load Average: Servers load average for each server.
- Memory Usage: Percentage of memory usage for each server.
- Network Traffic: Min, max and average kBytes of network traffic per second.
- MySQL Connections: Number of client connections to MySQL server.
- MySQL Queries: Number of queries executed.
- MySQL Traffic: Provides information about min, max and avg data send end received.
Galera Graphs
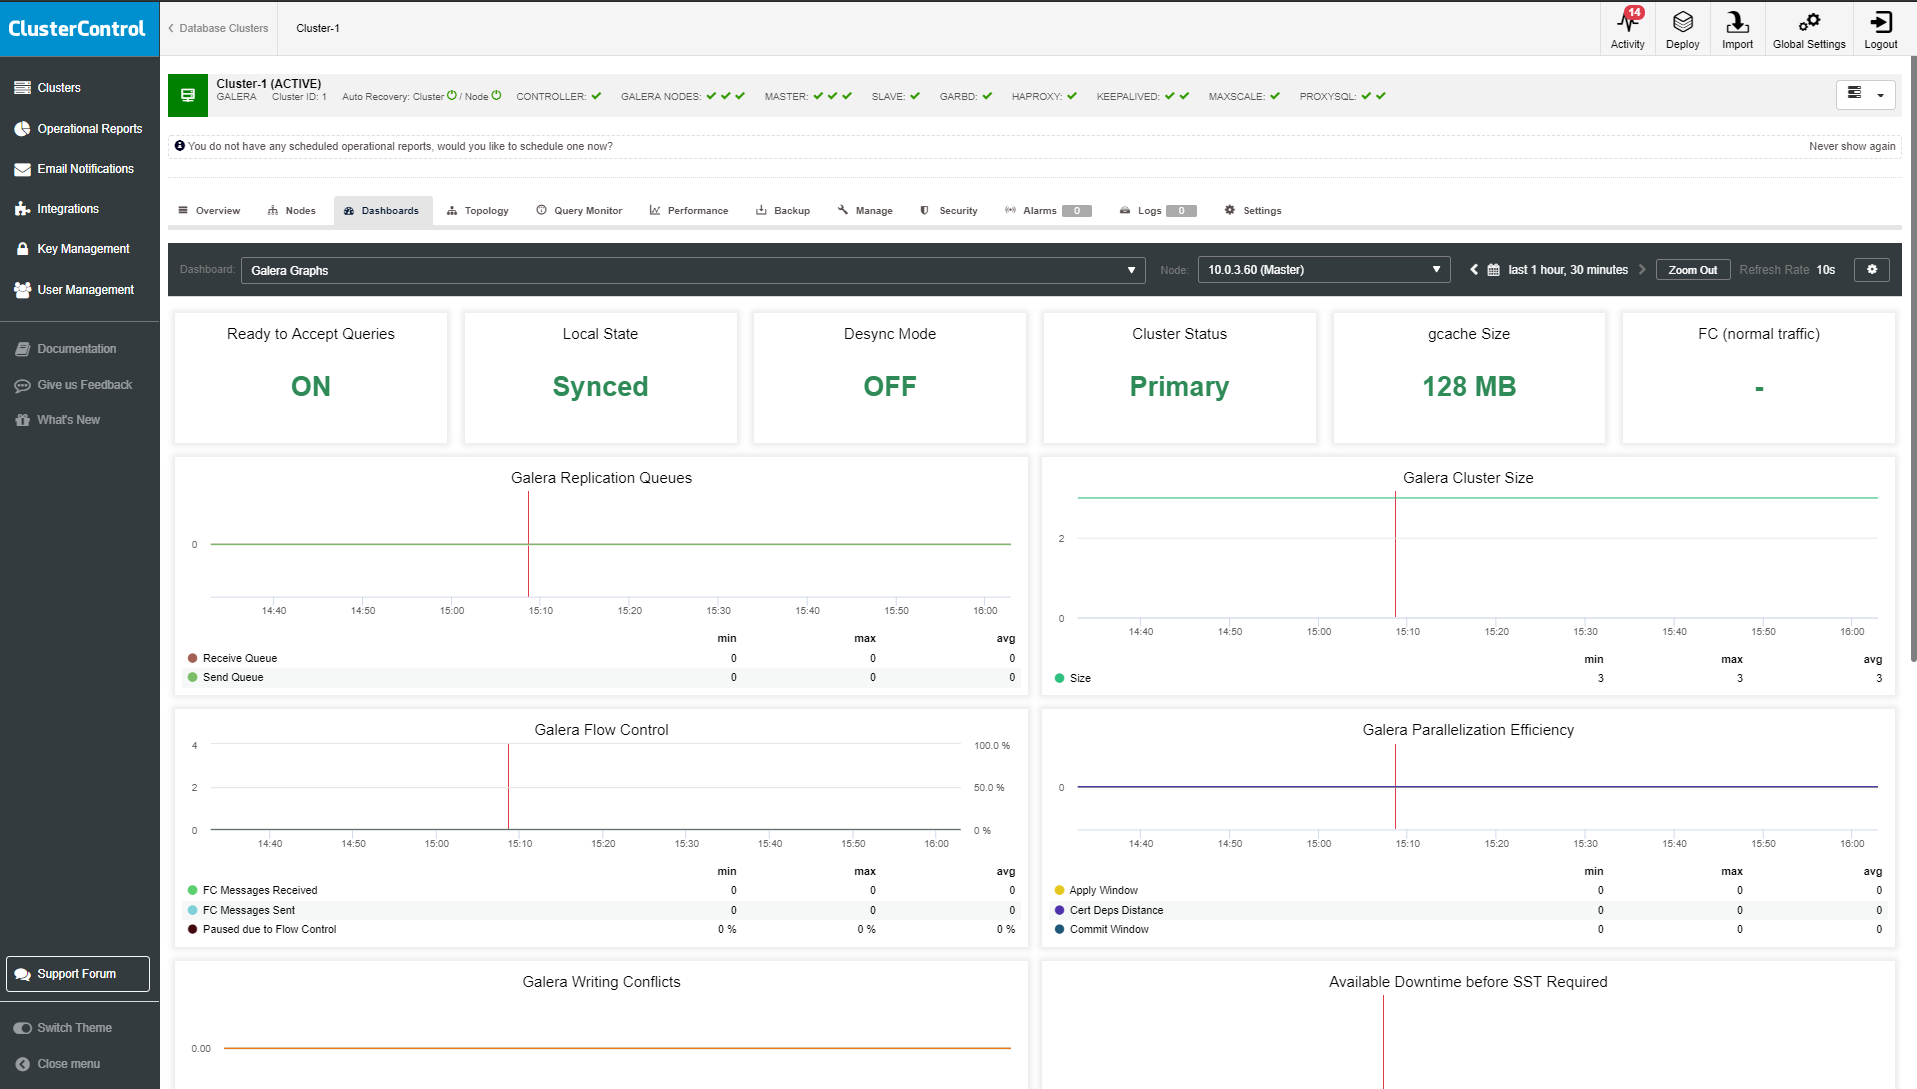
In this view, you can check Galera specific metrics for each cluster node. The dashboard lists all of your cluster nodes, so you can easily filter for performance metrics of a particular node.
- Ready to Accept: Queries: Identify if the node is able to run database operations.
- Local State: Shows the node state.
- Desync Mode: Identified if node participates in Flow Control.
- Cluster Status: Cluster component status.
- gcache Size: Galera Cluster cache size.
- FC (normal traffic): Flow control status.
- Galera Replication Queues: Size of the replication queue.
- Galera Cluster Size: Number of nodes in the cluster.
- Galera Flow Control: Identifies a number of FC calls.
- Galera Parallelization Efficiency: An average distance between highest and lowest sequence numbers that are concurrently applied, committed and can be possibly applied in parallel.
- Galera Writing Conflicts: A number of local transactions being committed on this node that failed certification.
- Available Downtime before SST Required: Downtime in minutes before SST operation.
- Galera Writeset Count: the count of transactions replicated to the cluster (from this node) and received from the cluster (any other node).
- Galera Writeset Size: This graph shows the average transaction size sent/received.
- Galera Network Usage Hourly: Network usage hourly (received and replicated).
Conclusion
Monitoring is an area where operations teams commonly spend time developing custom solutions. It is common to find IT teams integrating these systems in order to get a holistic view of their systems.
ClusterControl provides a complete monitoring system with real-time data to know what is happening now, high-resolution metrics for better accuracy, configurable dashboards, and a wide range of third-party notification services for alerting. Download ClusterControl today (it’s free).


