blog
How to Monitor MySQL Containers with Prometheus – Deployment on Standalone and Swarm: : Part One

Monitoring is a concern for containers, as the infrastructure is dynamic. Containers can be routinely created and destroyed, and are ephemeral. So how do you keep track of your MySQL instances running on Docker?
As with any software component, there are many options out there that can be used. We’ll look at Prometheus as a solution built for distributed infrastructure, and works very well with Docker.
This is a two-part blog. In this part 1 blog, we are going to cover the deployment aspect of our MySQL containers with Prometheus and its components, running as standalone Docker containers and Docker Swarm services. In part 2, we will look at the important metrics to monitor from our MySQL containers, as well as integration with the paging and notification systems.
Introduction to Prometheus
Prometheus is a full monitoring and trending system that includes built-in and active scraping, storing, querying, graphing, and alerting based on time series data. Prometheus collects metrics through pull mechanism from configured targets at given intervals, evaluates rule expressions, displays the results, and can trigger alerts if some condition is observed to be true. It supports all the target metrics that we want to measure if one would like to run MySQL as Docker containers. Those metrics include physical hosts metrics, Docker container metrics and MySQL server metrics.
Take a look at the following diagram which illustrates Prometheus architecture (taken from Prometheus official documentation):
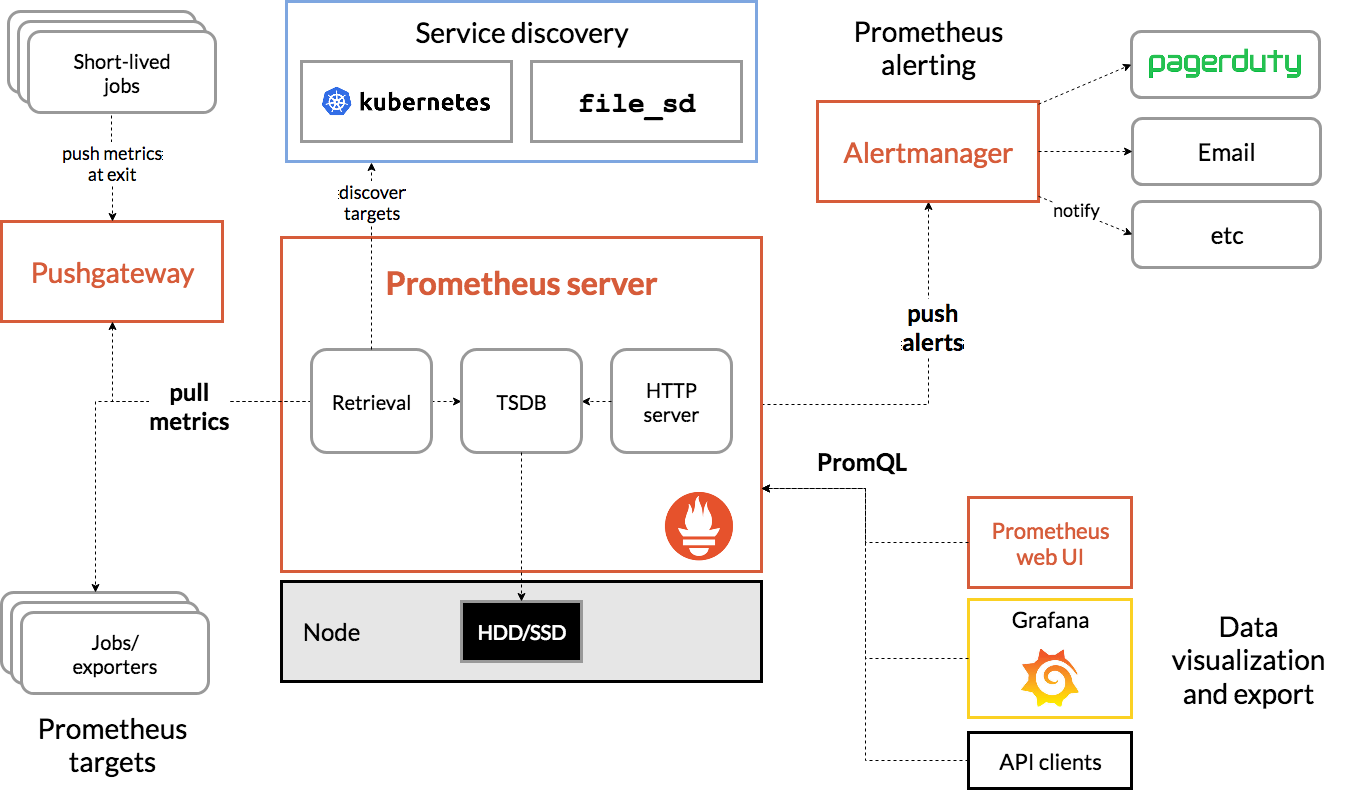
We are going to deploy some MySQL containers (standalone and Docker Swarm) complete with a Prometheus server, MySQL exporter (i.e., a Prometheus agent to expose MySQL metrics, that can then be scraped by the Prometheus server) and also Alertmanager to handle alerts based on the collected metrics.
For more details check out the Prometheus documentation. In this example, we are going to use the official Docker images provided by the Prometheus team.
Standalone Docker
Deploying MySQL Containers
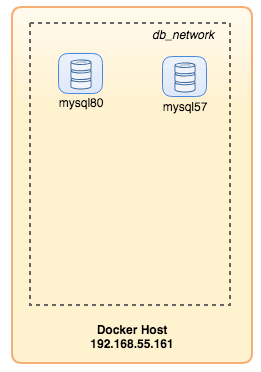
Let’s run two standalone MySQL servers on Docker to simplify our deployment walkthrough. One container will be using the latest MySQL 8.0 and the other one is MySQL 5.7. Both containers are in the same Docker network called “db_network”:
$ docker network create db_network
$ docker run -d
--name mysql80
--publish 3306
--network db_network
--restart unless-stopped
--env MYSQL_ROOT_PASSWORD=mypassword
--volume mysql80-datadir:/var/lib/mysql
mysql:8
--default-authentication-plugin=mysql_native_password
MySQL 8 defaults to a new authentication plugin called caching_sha2_password. For compatibility with Prometheus MySQL exporter container, let’s use the widely-used mysql_native_password plugin whenever we create a new MySQL user on this server.
For the second MySQL container running 5.7, we execute the following:
$ docker run -d
--name mysql57
--publish 3306
--network db_network
--restart unless-stopped
--env MYSQL_ROOT_PASSWORD=mypassword
--volume mysql57-datadir:/var/lib/mysql
mysql:5.7
Verify if our MySQL servers are running OK:
[root@docker1 mysql]# docker ps | grep mysql
cc3cd3c4022a        mysql:5.7           "docker-entrypoint.s…"   12 minutes ago      Up 12 minutes       0.0.0.0:32770->3306/tcp   mysql57
9b7857c5b6a1        mysql:8             "docker-entrypoint.s…"   14 minutes ago      Up 14 minutes       0.0.0.0:32769->3306/tcp   mysql80
At this point, our architecture is looking something like this:
Let’s get started to monitor them.
Exposing Docker Metrics to Prometheus
Docker has built-in support as Prometheus target, where we can use to monitor the Docker engine statistics. We can simply enable it by creating a text file called “daemon.json” inside the Docker host:
$ vim /etc/docker/daemon.jsonAnd add the following lines:
{
  "metrics-addr" : "12.168.55.161:9323",
  "experimental" : true
}
Where 192.168.55.161 is the Docker host primary IP address. Then, restart Docker daemon to load the change:
$ systemctl restart dockerSince we have defined –restart=unless-stopped in our MySQL containers’ run command, the containers will be automatically started after Docker is running.
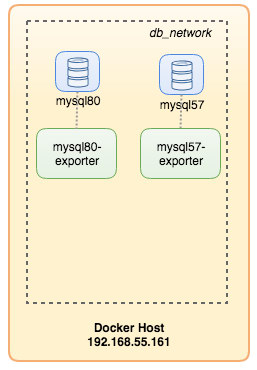
Deploying MySQL Exporter
Before we move further, the mysqld exporter requires a MySQL user to be used for monitoring purposes. On our MySQL containers, create the monitoring user:
$ docker exec -it mysql80 mysql -uroot -p
Enter password:
mysql> CREATE USER 'exporter'@'%' IDENTIFIED BY 'exporterpassword' WITH MAX_USER_CONNECTIONS 3;
mysql> GRANT PROCESS, REPLICATION CLIENT, SELECT ON *.* TO 'exporter'@'%';Take note that it is recommended to set a max connection limit for the user to avoid overloading the server with monitoring scrapes under heavy load. Repeat the above statements onto the second container, mysql57:
$ docker exec -it mysql57 mysql -uroot -p
Enter password:
mysql> CREATE USER 'exporter'@'%' IDENTIFIED BY 'exporterpassword' WITH MAX_USER_CONNECTIONS 3;
mysql> GRANT PROCESS, REPLICATION CLIENT, SELECT ON *.* TO 'exporter'@'%';Let’s run the mysqld exporter container called “mysql8-exporter” to expose the metrics for our MySQL 8.0 instance as below:
$ docker run -d
--name mysql80-exporter
--publish 9104
--network db_network
--restart always
--env DATA_SOURCE_NAME="exporter:exporterpassword@(mysql80:3306)/"
prom/mysqld-exporter:latest
--collect.info_schema.processlist
--collect.info_schema.innodb_metrics
--collect.info_schema.tablestats
--collect.info_schema.tables
--collect.info_schema.userstats
--collect.engine_innodb_status
And also another exporter container for our MySQL 5.7 instance:
$ docker run -d
--name mysql57-exporter
--publish 9104
--network db_network
--restart always
-e DATA_SOURCE_NAME="exporter:exporterpassword@(mysql57:3306)/"
prom/mysqld-exporter:latest
--collect.info_schema.processlist
--collect.info_schema.innodb_metrics
--collect.info_schema.tablestats
--collect.info_schema.tables
--collect.info_schema.userstats
--collect.engine_innodb_status
We enabled a bunch of collector flags for the container to expose the MySQL metrics. You can also enable –collect.slave_status, –collect.slave_hosts if you have a MySQL replication running on containers.
We should be able to retrieve the MySQL metrics via curl from the Docker host directly (port 32771 is the published port assigned automatically by Docker for container mysql80-exporter):
$ curl 127.0.0.1:32771/metrics
...
mysql_info_schema_threads_seconds{state="waiting for lock"} 0
mysql_info_schema_threads_seconds{state="waiting for table flush"} 0
mysql_info_schema_threads_seconds{state="waiting for tables"} 0
mysql_info_schema_threads_seconds{state="waiting on cond"} 0
mysql_info_schema_threads_seconds{state="writing to net"} 0
...
process_virtual_memory_bytes 1.9390464e+07
At this point, our architecture is looking something like this:
We are now good to setup the Prometheus server.
Deploying Prometheus Server
Firstly, create Prometheus configuration file at ~/prometheus.yml and add the following lines:
$ vim ~/prometheus.yml
global:
  scrape_interval:     5s
  scrape_timeout:      3s
  evaluation_interval: 5s

# Our alerting rule files
rule_files:
  - "alert.rules"

# Scrape endpoints
scrape_configs:
  - job_name: 'prometheus'
    static_configs:
      - targets: ['localhost:9090']

  - job_name: 'mysql'
    static_configs:
      - targets: ['mysql57-exporter:9104','mysql80-exporter:9104']

  - job_name: 'docker'
    static_configs:
      - targets: ['192.168.55.161:9323']
From the Prometheus configuration file, we have defined three jobs – “prometheus”, “mysql” and “docker”. The first one is the job to monitor the Prometheus server itself. The next one is the job to monitor our MySQL containers named “mysql”. We define the endpoints on our MySQL exporters on port 9104, which exposed the Prometheus-compatible metrics from the MySQL 8.0 and 5.7 instances respectively. The “alert.rules” is the rule file that we will include later in the next blog post for alerting purposes.
We can then map the configuration with the Prometheus container. We also need to create a Docker volume for Prometheus data for persistency and also expose port 9090 publicly:
$ docker run -d
--name prometheus-server
--publish 9090:9090
--network db_network
--restart unless-stopped
--mount type=volume,src=prometheus-data,target=/prometheus
--mount type=bind,src="$(pwd)"/prometheus.yml,target=/etc/prometheus/prometheus.yml
--mount type=bind,src="$(pwd)
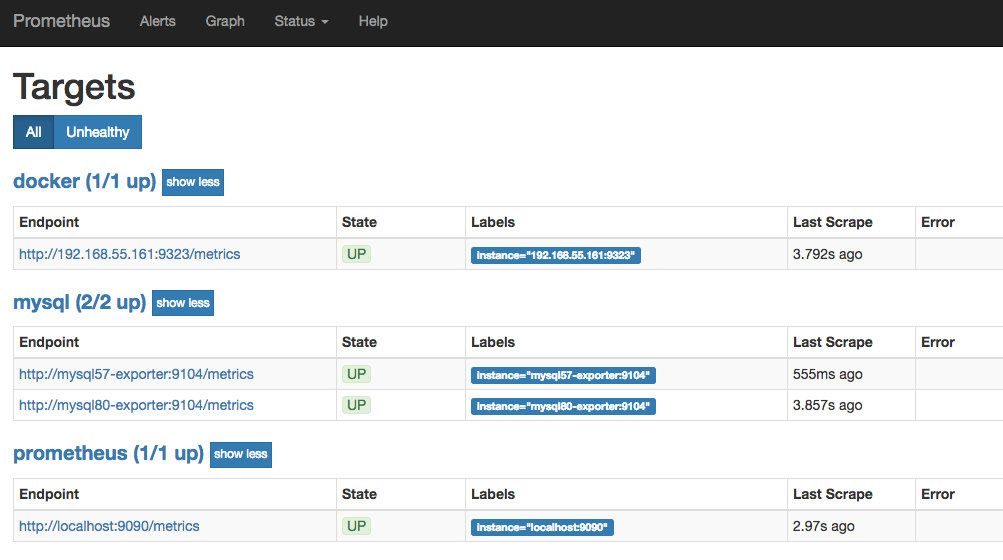
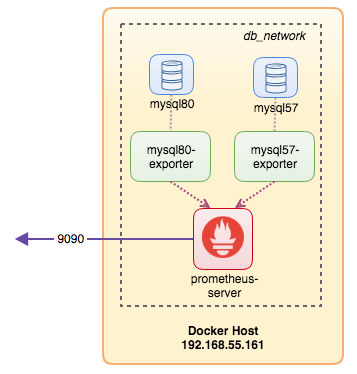
prom/prometheusNow our Prometheus server is already running and can be accessed directly on port 9090 of the Docker host. Open a web browser and go to http://192.168.55.161:9090/ to access the Prometheus web UI. Verify the target status under Status -> Targets and make sure they are all green:
At this point, our container architecture is looking something like this:
Our Prometheus monitoring system for our standalone MySQL containers are now deployed.
Docker Swarm
Deploying a 3-node Galera Cluster
Supposed we want to deploy a three-node Galera Cluster in Docker Swarm, we would have to create 3 different services, each service representing one Galera node. Using this approach, we can keep a static resolvable hostname for our Galera container, together with MySQL exporter containers that will accompany each of them. We will be using MariaDB 10.2 image maintained by the Docker team to run our Galera cluster.
Firstly, create a MySQL configuration file to be used by our Swarm service:
$ vim ~/my.cnf
[mysqld]

default_storage_engine          = InnoDB
binlog_format                   = ROW

innodb_flush_log_at_trx_commit  = 0
innodb_flush_method             = O_DIRECT
innodb_file_per_table           = 1
innodb_autoinc_lock_mode        = 2
innodb_lock_schedule_algorithm  = FCFS # MariaDB >10.1.19 and >10.2.3 only

wsrep_on                        = ON
wsrep_provider                  = /usr/lib/galera/libgalera_smm.so
wsrep_sst_method                = mariabackup
Create a dedicated database network in our Swarm called “db_swarm”:
$ docker network create --driver overlay db_swarmImport our MySQL configuration file into Docker config so we can load it into our Swarm service when we create it later:
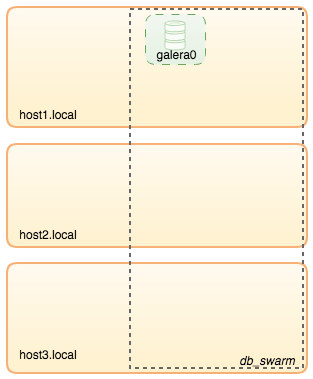
$ cat ~/my.cnf | docker config create my-cnf -Create the first Galera bootstrap service, with “gcomm://” as the cluster address called “galera0”. This is a transient service for bootstrapping process only. We will delete this service once we have gotten 3 other Galera services running:
$ docker service create
--name galera0
--replicas 1
--hostname galera0
--network db_swarm
--publish 3306
--publish 4444
--publish 4567
--publish 4568
--config src=my-cnf,target=/etc/mysql/mariadb.conf.d/my.cnf
--env MYSQL_ROOT_PASSWORD=mypassword
--mount type=volume,src=galera0-datadir,dst=/var/lib/mysql
mariadb:10.2
--wsrep_cluster_address=gcomm://
--wsrep_sst_auth="root:mypassword"
--wsrep_node_address=galera0
At this point, our database architecture can be illustrated as below:
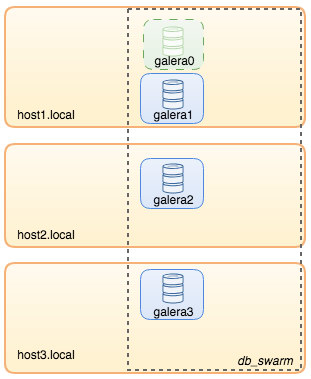
Then, repeat the following command for 3 times to create 3 different Galera services. Replace {name} with galera1, galera2 and galera3 respectively:
$ docker service create
--name {name}
--replicas 1
--hostname {name}
--network db_swarm
--publish 3306
--publish 4444
--publish 4567
--publish 4568
--config src=my-cnf,target=/etc/mysql/mariadb.conf.d/my.cnf
--env MYSQL_ROOT_PASSWORD=mypassword
--mount type=volume,src={name}-datadir,dst=/var/lib/mysql
mariadb:10.2
--wsrep_cluster_address=gcomm://galera0,galera1,galera2,galera3
--wsrep_sst_auth="root:mypassword"
--wsrep_node_address={name}
Verify our current Docker services:
$ docker service ls
ID                  NAME                MODE                REPLICAS            IMAGE               PORTS
wpcxye3c4e9d        galera0             replicated          1/1                 mariadb:10.2        *:30022->3306/tcp, *:30023->4444/tcp, *:30024-30025->4567-4568/tcp
jsamvxw9tqpw        galera1             replicated          1/1                 mariadb:10.2        *:30026->3306/tcp, *:30027->4444/tcp, *:30028-30029->4567-4568/tcp
otbwnb3ridg0        galera2             replicated          1/1                 mariadb:10.2        *:30030->3306/tcp, *:30031->4444/tcp, *:30032-30033->4567-4568/tcp
5jp9dpv5twy3        galera3             replicated          1/1                 mariadb:10.2        *:30034->3306/tcp, *:30035->4444/tcp, *:30036-30037->4567-4568/tcp
Our architecture is now looking something like this:
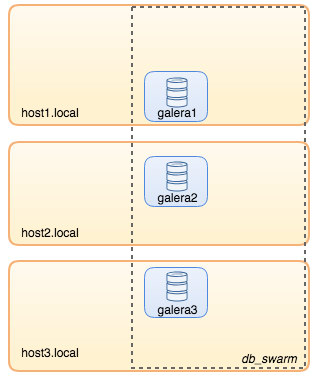
We need to remove the Galera bootstrap Swarm service, galera0, to stop it from running because if the container is being rescheduled by Docker Swarm, a new replica will be started with a fresh new volume. We run the risk of data loss because the –wsrep_cluster_address contains “galera0” in the other Galera nodes (or Swarm services). So, let’s remove it:
$ docker service rm galera0At this point, we have our three-node Galera Cluster:
We are now ready to deploy our MySQL exporter and Prometheus Server.
MySQL Exporter Swarm Service
Login to one of the Galera nodes and create the exporter user with proper privileges:
$ docker exec -it {galera1} mysql -uroot -p
Enter password:
mysql> CREATE USER 'exporter'@'%' IDENTIFIED BY 'exporterpassword' WITH MAX_USER_CONNECTIONS 3;
mysql> GRANT PROCESS, REPLICATION CLIENT, SELECT ON *.* TO 'exporter'@'%';Then, create the exporter service for each of the Galera services (replace {name} with galera1, galera2 and galera3 respectively):
$ docker service create
--name {name}-exporter
--network db_swarm
--replicas 1
-p 9104
-e DATA_SOURCE_NAME="exporter:exporterpassword@({name}:3306)/"
prom/mysqld-exporter:latest
--collect.info_schema.processlist
--collect.info_schema.innodb_metrics
--collect.info_schema.tablestats
--collect.info_schema.tables
--collect.info_schema.userstats
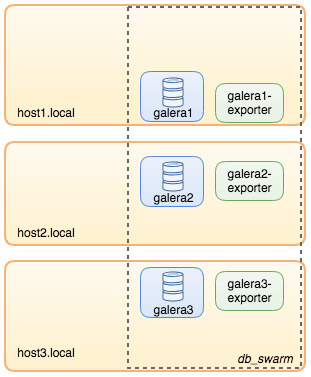
--collect.engine_innodb_statusAt this point, our architecture is looking something like this with exporter services in the picture:
Prometheus Server Swarm Service
Finally, let’s deploy our Prometheus server. Similar to the Galera deployment, we have to prepare the Prometheus configuration file first before importing it into Swarm using Docker config command:
$ vim ~/prometheus.yml
global:
  scrape_interval:     5s
  scrape_timeout:      3s
  evaluation_interval: 5s

# Our alerting rule files
rule_files:
  - "alert.rules"

# Scrape endpoints
scrape_configs:
  - job_name: 'prometheus'
    static_configs:
      - targets: ['localhost:9090']

  - job_name: 'galera'
    static_configs:
      - targets: ['galera1-exporter:9104','galera2-exporter:9104', 'galera3-exporter:9104']
From the Prometheus configuration file, we have defined three jobs – “prometheus” and “galera”. The first one is the job to monitor the Prometheus server itself. The next one is the job to monitor our MySQL containers named “galera”. We define the endpoints on our MySQL exporters on port 9104, which expose the Prometheus-compatible metrics from the three Galera nodes respectively. The “alert.rules” is the rule file that we will include later in the next blog post for alerting purposes.
Import the configuration file into Docker config to be used with Prometheus container later:
$ cat ~/prometheus.yml | docker config create prometheus-yml -Let’s run the Prometheus server container, and publish port 9090 of all Docker hosts for the Prometheus web UI service:
$ docker service create
--name prometheus-server
--publish 9090:9090
--network db_swarm
--replicas 1
--config src=prometheus-yml,target=/etc/prometheus/prometheus.yml
--mount type=volume,src=prometheus-data,dst=/prometheus
prom/prometheus
Verify with the Docker service command that we have 3 Galera services, 3 exporter services and 1 Prometheus service:
$ docker service ls
ID NAME MODE REPLICAS IMAGE PORTS
jsamvxw9tqpw galera1 replicated 1/1 mariadb:10.2 *:30026->3306/tcp, *:30027->4444/tcp, *:30028-30029->4567-4568/tcp
hbh1dtljn535 galera1-exporter replicated 1/1 prom/mysqld-exporter:latest *:30038->9104/tcp
otbwnb3ridg0 galera2 replicated 1/1 mariadb:10.2 *:30030->3306/tcp, *:30031->4444/tcp, *:30032-30033->4567-4568/tcp
jq8i77ch5oi3 galera2-exporter replicated 1/1 prom/mysqld-exporter:latest *:30039->9104/tcp
5jp9dpv5twy3 galera3 replicated 1/1 mariadb:10.2 *:30034->3306/tcp, *:30035->4444/tcp, *:30036-30037->4567-4568/tcp
10gdkm1ypkav galera3-exporter replicated 1/1 prom/mysqld-exporter:latest *:30040->9104/tcp
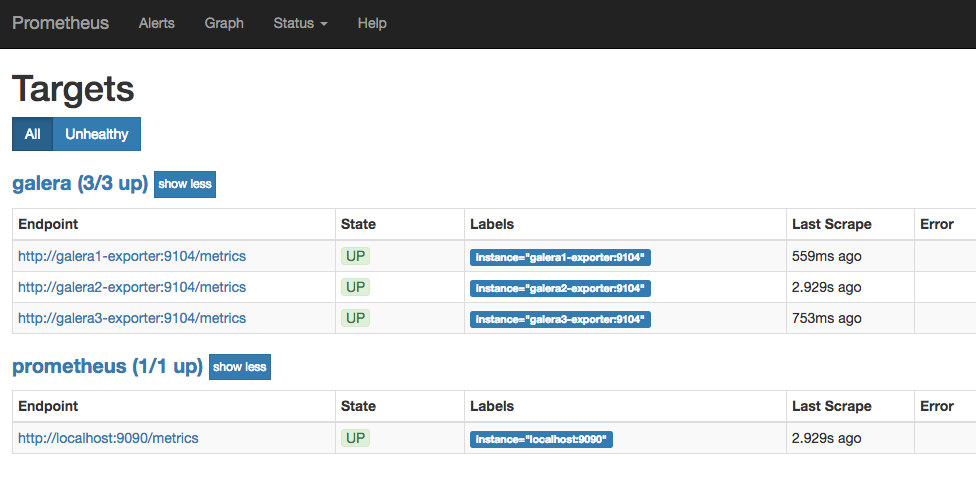
gv9llxrig30e prometheus-server replicated 1/1 prom/prometheus:latest *:9090->9090/tcpNow our Prometheus server is already running and can be accessed directly on port 9090 from any Docker node. Open a web browser and go to http://192.168.55.161:9090/ to access the Prometheus web UI. Verify the target status under Status -> Targets and make sure they are all green:
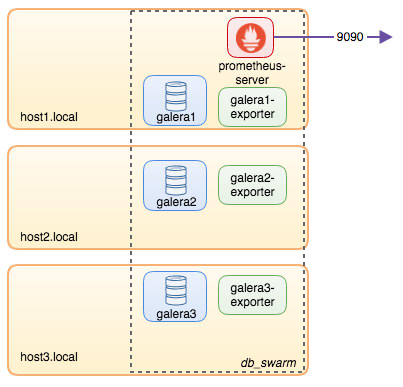
At this point, our Swarm architecture is looking something like this:
To be Continued..
We now have our database and monitoring stack deployed on Docker. In part 2 of the blog, we will look into the different MySQL metrics to keep an eye on. We’ll also see how to configure alerting with Prometheus.