blog
Driving Performance for PostgreSQL with HAProxy

Database performance is a very important concern when maintaining your database cluster, especially as it grows over the time. This is especially true if your application started out with low traffic going then growting to moderate or heavy read-write workloads.
The thing to remember is that there is no perfect configuration that you can rely on for a long time, as certain workloads might change over time.
With ClusterControl, creating or deploying a new PostgreSQL database cluster performs a basic analysis such as checking your hardware resources, then applies auto-tuning and sets the values for the selected tunable parameters. As PostgreSQL evolves, a lot of tools have been developed as well to support different configurations, especially for load balancing.
In this blog, we’ll take a look at the importance of HAProxy and how it can help drive performance. It’s an old tool, yet a powerful proxy and/or load balancer which supports not only database servers, but also network application-specific protocols. HAProxy can operate via layer four and layer seven respectively, depending on the type of setup based on the configuration.
PostgreSQL Performance Tuning
One of the primary factors for driving performance for PostgreSQL starts with the basic parameter tuning from initdb to runtime parameter values. This has to be able to handle desired workload in accordance to your certain requirements. Before we can take an en route for the HAProxy feature for PostgreSQL, your database server has to be stable and tuned up to its desired variables. Let’s take a list of areas for PostgreSQL on what are things that can impact performance drive for your database server.
Tuning For Feasible Memory Management
PostgreSQL is efficient and it is possible to run effectively in as little as 256Mb of memory. Memory is not expensive, yet most data sets are less than 4Gib. If you have at least 4Gib your active data set can remain in file and/or shared_buffer cache.
Tuning up your PostgreSQL for memory management is one of the most primary and basic things that you need to set. Setting it appropriately can impact on boosting the performance of your database server. Although it depends on what kind of tables you are playing with. Bad queries and poor table definitions can also lead to poor performance. With proper indexes defined to your tables and with queries referencing to indexes, chances can reach from 80% – 100% of queries can be retrieved from your memory. This especially if the index buffer has the right value to load your index defined on your tables. Let’s look at the parameters that are commonly set for performance improvement.
- shared_buffers – PostgreSQL sizes its main memory space with shared_buffers. The working cache of all hot tuples (and index entries) within PostgreSQL. This parameter sets the amount of memory that the database server uses for shared memory buffers. It’s a pre-allocated cache (buffers). For Linux based systems, it’s ideal to set the kernel parameter kernel.shmmax which can be persistently set via /etc/sysctl.conf kernel configuration file.
- temp_buffers – Sets the maximum number of temporary buffers used for each session. These are local session buffers used only to access temporary tables. A session will assign the temporary buffers as needed up to the limit given by temp_buffers.
- work_mem – The working memory available for work operations (sorts) before PostgreSQL will swap. Don’t set globally (postgresql.conf). Use per transaction as this can be bad per query, per connection, or per sort. Using EXPLAIN ANALYZE is recommended to see if you are overflowing or not.
- maintenance_work_mem – Specifies the amount of memory to be used for maintenance operations (VACUUM, CREATE INDEX, and ALTER TABLE … ADD FOREIGN KEY…)
Tuning For Feasible Disk Management
A number of runtime parameters to set here. Let’s list what are these:
- temp_file_limit – Specifies the maximum amount of disk space that a session can use for temporary files, such as sort and hash temporary files, or the storage file for a held cursor. A transaction attempting to exceed this limit will be canceled.
- fsync – If fsync is enabled, PostgreSQL will try to make sure that the updates are physically written to the disk. This ensures that the database cluster can be recovered to a consistent state after an operating system or hardware crash. While disabling fsync generally improves performance, it can cause data loss in the event of a power failure or a system crash. Therefore, it is only advisable to deactivate fsync if you can easily recreate your entire database from external data
- synchronous_commit – Used to enforce that commit will wait for WAL to be written on disk before returning a success status to the client. This variable has trade-offs between performance and reliability. If you need more performance, set this to off which means when server crashes, tendency to encounter data loss. Otherwise, if reliability is important set this to on. This means that there will be a time gap between the success status and a guaranteed write to disk, thus can impact performance.
- checkpoint_timeout, checkpoint_completion_target – PostgreSQL writes changes into WAL, which is an expensive operation. If it’s frequently writing changes into WAL, it can impact the performance poorly. So how it works, the checkpoint process flushes the data into the data files. This activity is done when CHECKPOINT occurs and can cause a huge amount of IO. This whole process involves expensive disk read/write operations. Though you (admin user) can always issue CHECKPOINT whenever it seems necessary or automate it by setting desired values for these parameters. The checkpoint_timeout parameter is used to set time between WAL checkpoints. Setting this too low decreases crash recovery time, as more data is written to disk, but it hurts performance too since every checkpoint ends up consuming valuable system resources. The checkpoint_completion_target is the fraction of time between checkpoints for checkpoint completion. A high frequency of checkpoints can impact performance. For smooth checkpointing, checkpoint_timeout must be a low value. Otherwise the OS will accumulate all the dirty pages until the ratio is met and then go for a big flush.
Tuning Other Parameters for Performance
There are certain parameters that provide boost and drive for performance in PostgreSQL. Let’s list what are these below:
- wal_buffers – PostgreSQL writes its WAL (write ahead log) record into the buffers and then these buffers are flushed to disk. The default size of the buffer, defined by wal_buffers, is 16MB, but if you have a lot of concurrent connections then a higher value can give better performance.
- effective_cache_size – The effective_cache_size provides an estimate of the memory available for disk caching. It is just a guideline, not the exact allocated memory or cache size. It does not allocate actual memory but tells the optimizer the amount of cache available in the kernel. If the value of this is set too low the query planner can decide not to use some indexes, even if they’d be helpful. Therefore, setting a large value is always beneficial.
- default_statistics_target – PostgreSQL collects statistics from each of the tables in its database to decide how queries will be executed on them. By default, it does not collect too much information, and if you are not getting good execution plans, you should increase this value and then run ANALYZE in the database again (or wait for the AUTOVACUUM).
PostgreSQL Query Efficiency
PostgreSQL has a very powerful feature for optimizing queries. With the built-in Genetic Query Optimizer (known as GEQO). It uses a genetic algorithm which is a heuristic optimization method through randomized search. This is applied when performing optimization using JOINs which provides a very good performance optimization. Each candidate in the join plan is represented by a sequence in which to join the base relations. It randomly performs a genetic relationship by simply generating some possible join sequence but at random.
For each join sequence considered, the standard planner code is invoked to estimate the cost of performing the query using that join sequence. So for each of the JOIN sequences, all have their initially-determined relation scan plans. Then, the query plan will compute the most feasible and performant plan, i.e. with lower estimated cost and are considered as “more fit” than those with higher cost.
Given that it has a powerful feature integrated within PostgreSQL and the proper configured parameters in accordance to your desired requirements, it doesn’t defeat the feasibility when it comes to performance if the load is only thrown to a primary node. Load balancing with HAProxy helps even more drive performance for PostgreSQL.
Driving Performance for PostgreSQL With Read-Write Splitting
You might have a great performance dealing with your PostgreSQL server node but you might not be able to anticipate what type of workload you might have especially when high traffic hits and the demand goes out of the boundary. Balancing the load between a primary and secondary provides a performance boost within your application and/or clients connecting to your PostgreSQL database cluster. How this can be done, is not a question anymore as it’s a very common setup for a high availability and redundancy when it comes to distributing the load and avoiding the primary node to bogged down due to high load processing.
Setting up with HAProxy is easy. Yet, it’s more efficiently quicker and feasible with ClusterControl. So we’ll use ClusterControl to set this up for us.
Setting up PostgreSQL with HAProxy
To do this, we’ll just have to install and setup HAProxy on top of the PostgreSQL clusters. HAProxy has a feature to support PostgreSQL through option pgsql-check but its support is a very simple implementation to determine if a node is up or not. It does not have checks for identifying a primary and a recovery node. An option is to use xinetd for which we will rely on communicating the HAProxy to listen via our xinetd service which checks the health of a particular node in our PostgreSQL cluster.
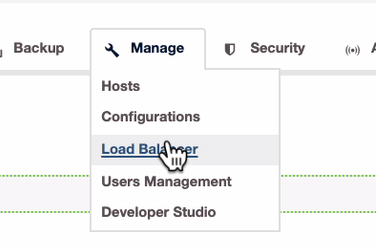
Under ClusterControl, navigate to Manage → Load Balancer just as below,
Then just follow based on the UI per below screenshot. You may click the Show advanced settings to view more advanced options. Following the UI is very straightforward though. See below,
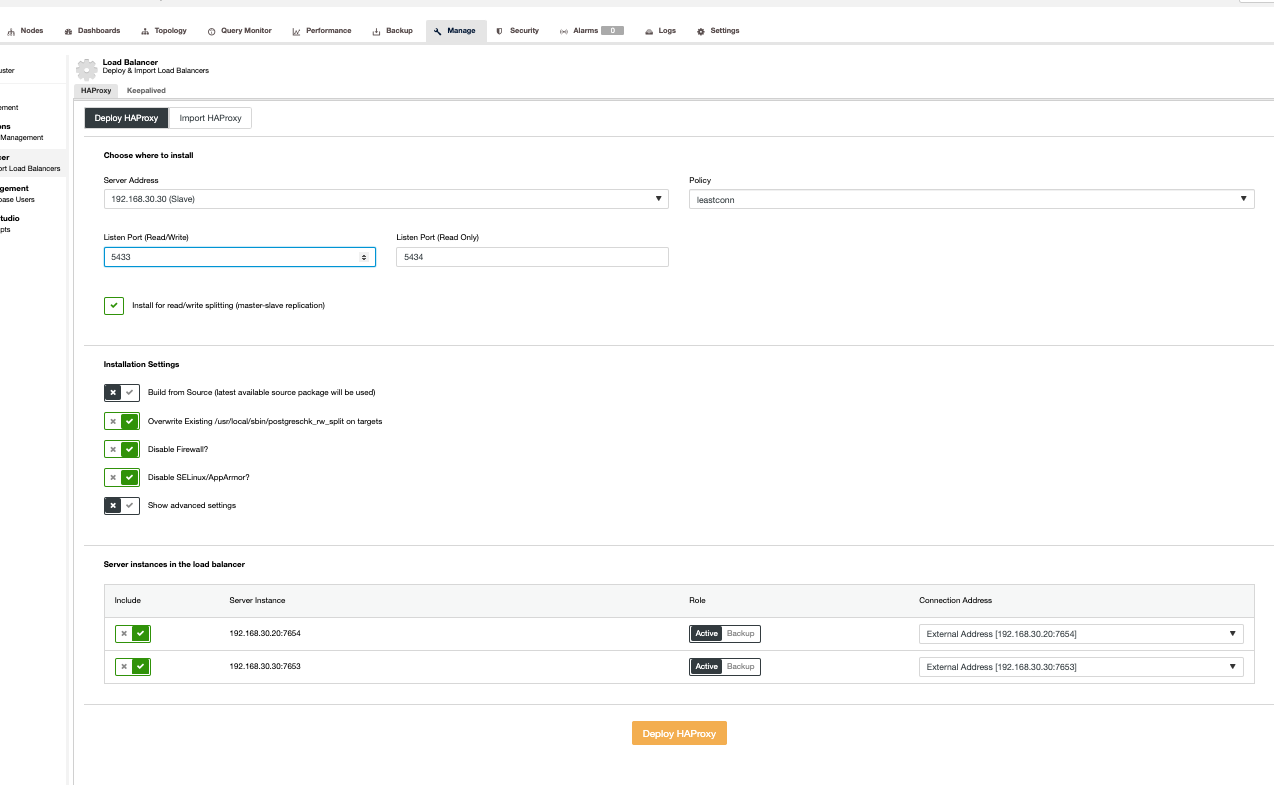
I’m importing only single node HAProxy without redundancy but for the purpose of this blog, let’s make it simpler.
My sample HAProxy view is shown below,
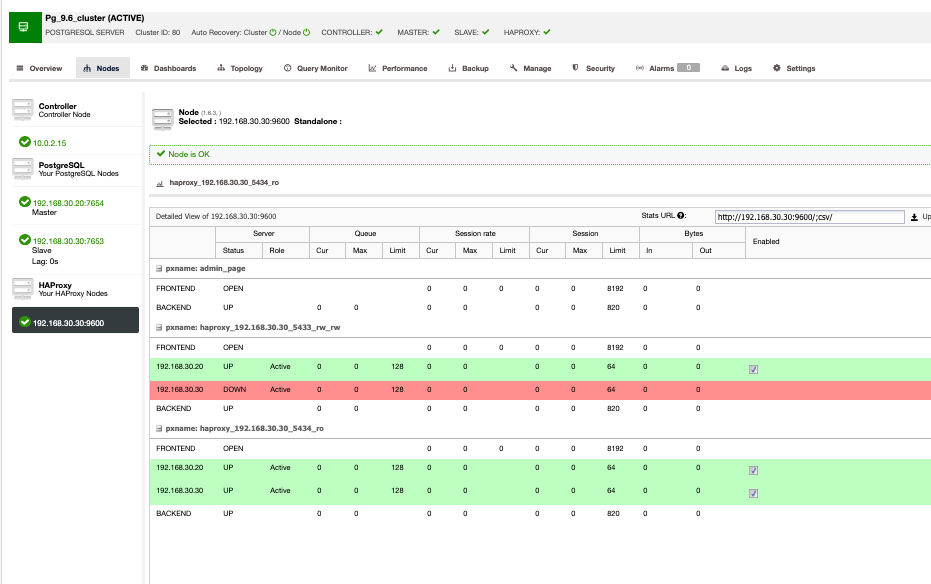
As shown above, the 192.168.30.20 and 192.168.30.30 are the primary and secondary/recovery nodes respectively. Whereas the HAProxy is installed in the secondary/recovery node. Ideally, you might install your HAProxy on multiple nodes to have more redundancy and highly available, it is best to isolate it against the database nodes. If you are tight on budget or economizing your usage, you might opt to install your HAProxy nodes, where your database nodes are installed as well.
ClusterControl setup this automatically and also includes the xinetd service for PostgreSQL check. This can be verified with netstat just like below,
root@debnode3:~# netstat -tlv4np|grep haproxy

tcp        0      0 0.0.0.0:5433            0.0.0.0:*               LISTEN      28441/haproxy

tcp        0      0 0.0.0.0:5434            0.0.0.0:*               LISTEN      28441/haproxy

tcp        0      0 0.0.0.0:9600            0.0.0.0:*               LISTEN      28441/haproxy
Whereas port 5433 is read-write and 5444 is the read-only.
For PostgreSQL check for xinetd service namely postgreshk as seen below,
root@debnode3:~# cat /etc/xinetd.d/postgreschk

# default: on

# description: postgreschk

service postgreschk

{

        flags           = REUSE

        socket_type     = stream

        port            = 9201

        wait            = no

        user            = root

        server          = /usr/local/sbin/postgreschk

        log_on_failure  += USERID

        disable         = no

        #only_from       = 0.0.0.0/0

        only_from       = 0.0.0.0/0

        per_source      = UNLIMITED

}
The xinetd services also relies on /etc/services so you might be able to find the port that is designated to map.
root@debnode3:~# grep postgreschk /etc/services

postgreschk        9201/tcp
If you need to change the port of your postgreschk to what port to map, you have to change this file as well aside from the service config file and then do not forget to restart xinetd daemon.
The postgreschk service contains a reference to an external file which does basically a check for nodes if it’s writable, meaning it’s a primary or a master. If a node is in recovery, then it’s a replica or a recovery node.
root@debnode3:~# cat /usr/local/sbin/postgreschk

#!/bin/bash

#

# This script checks if a PostgreSQL server is healthy running on localhost. It will

# return:

# "HTTP/1.x 200 OKr" (if postgres is running smoothly)

# - OR -

# "HTTP/1.x 500 Internal Server Errorr" (else)

#

# The purpose of this script is make haproxy capable of monitoring PostgreSQL properly

#


export PGHOST='localhost'

export PGUSER='s9smysqlchk'

export PGPASSWORD='password'

export PGPORT='7653'

export PGDATABASE='postgres'

export PGCONNECT_TIMEOUT=10


FORCE_FAIL="/dev/shm/proxyoff"


SLAVE_CHECK="SELECT pg_is_in_recovery()"

WRITABLE_CHECK="SHOW transaction_read_only"


return_ok()

{

    echo -e "HTTP/1.1 200 OKrn"

    echo -e "Content-Type: text/htmlrn"

    if [ "$1x" == "masterx" ]; then

        echo -e "Content-Length: 56rn"

        echo -e "rn"

        echo -e "PostgreSQL master is running.rn"

    elif [ "$1x" == "slavex" ]; then

        echo -e "Content-Length: 55rn"

        echo -e "rn"

        echo -e "PostgreSQL slave is running.rn"

    else

        echo -e "Content-Length: 49rn"

        echo -e "rn"

        echo -e "PostgreSQL is running.rn"

    fi

    echo -e "rn"


    unset PGUSER

    unset PGPASSWORD

    exit 0

}


return_fail()

{

    echo -e "HTTP/1.1 503 Service Unavailablern"

    echo -e "Content-Type: text/htmlrn"

    echo -e "Content-Length: 48rn"

    echo -e "rn"

    echo -e "PostgreSQL is *down*.rn"

    echo -e "rn"


    unset PGUSER

    unset PGPASSWORD

    exit 1

}


if [ -f "$FORCE_FAIL" ]; then

    return_fail;

fi


# check if in recovery mode (that means it is a 'slave')

SLAVE=$(psql -qt -c "$SLAVE_CHECK" 2>/dev/null)

if [ $? -ne 0 ]; then

    return_fail;

elif echo $SLAVE | egrep -i "(t|true|on|1)" 2>/dev/null >/dev/null; then

    return_ok "slave"

fi


# check if writable (then we consider it as a 'master')

READONLY=$(psql -qt -c "$WRITABLE_CHECK" 2>/dev/null)

if [ $? -ne 0 ]; then

    return_fail;

elif echo $READONLY | egrep -i "(f|false|off|0)" 2>/dev/null >/dev/null; then

    return_ok "master"

fi


return_ok "none";
The user/password combination must be a valid ROLE in your PostgreSQL server. Since we’re installing via ClusterControl, this is handled automatically.
Now that we have a complete HAProxy installation, this setup allows us to have a read-write splitting where read-writes go to the primary or writable node, whereas read-only for both primary and secondary/recovery nodes. This setup does not mean it’s performant already, it has still been tuned up as discussed earlier with a combination of HAProxy for load balancing adds more performance boost for your application and respective database clients.